


I think last Friday’s session was telling in that the S&P 500 finished the week up about 1% while the Nasdaq 100 was nearly flat. The top two sectors on Friday’s session were Real Estate and Industrials. The bottom two sectors? None other than the two top-performing sectors in 2023: Technology and Communication Services.


A small difference in returns, to be sure, but also a great indication that growth leadership names may be due for a pullback, while value sectors are not showing the same extreme momentum conditions.
A number of mega cap growth stocks were overbought recently, and just as they were testing resistance from the summer highs. Charts like NFLX NFLX are perfect examples of this short-term bearish signal, where a stock that has a quick run higher often needs to take a break and reset before the uptrend can continue.


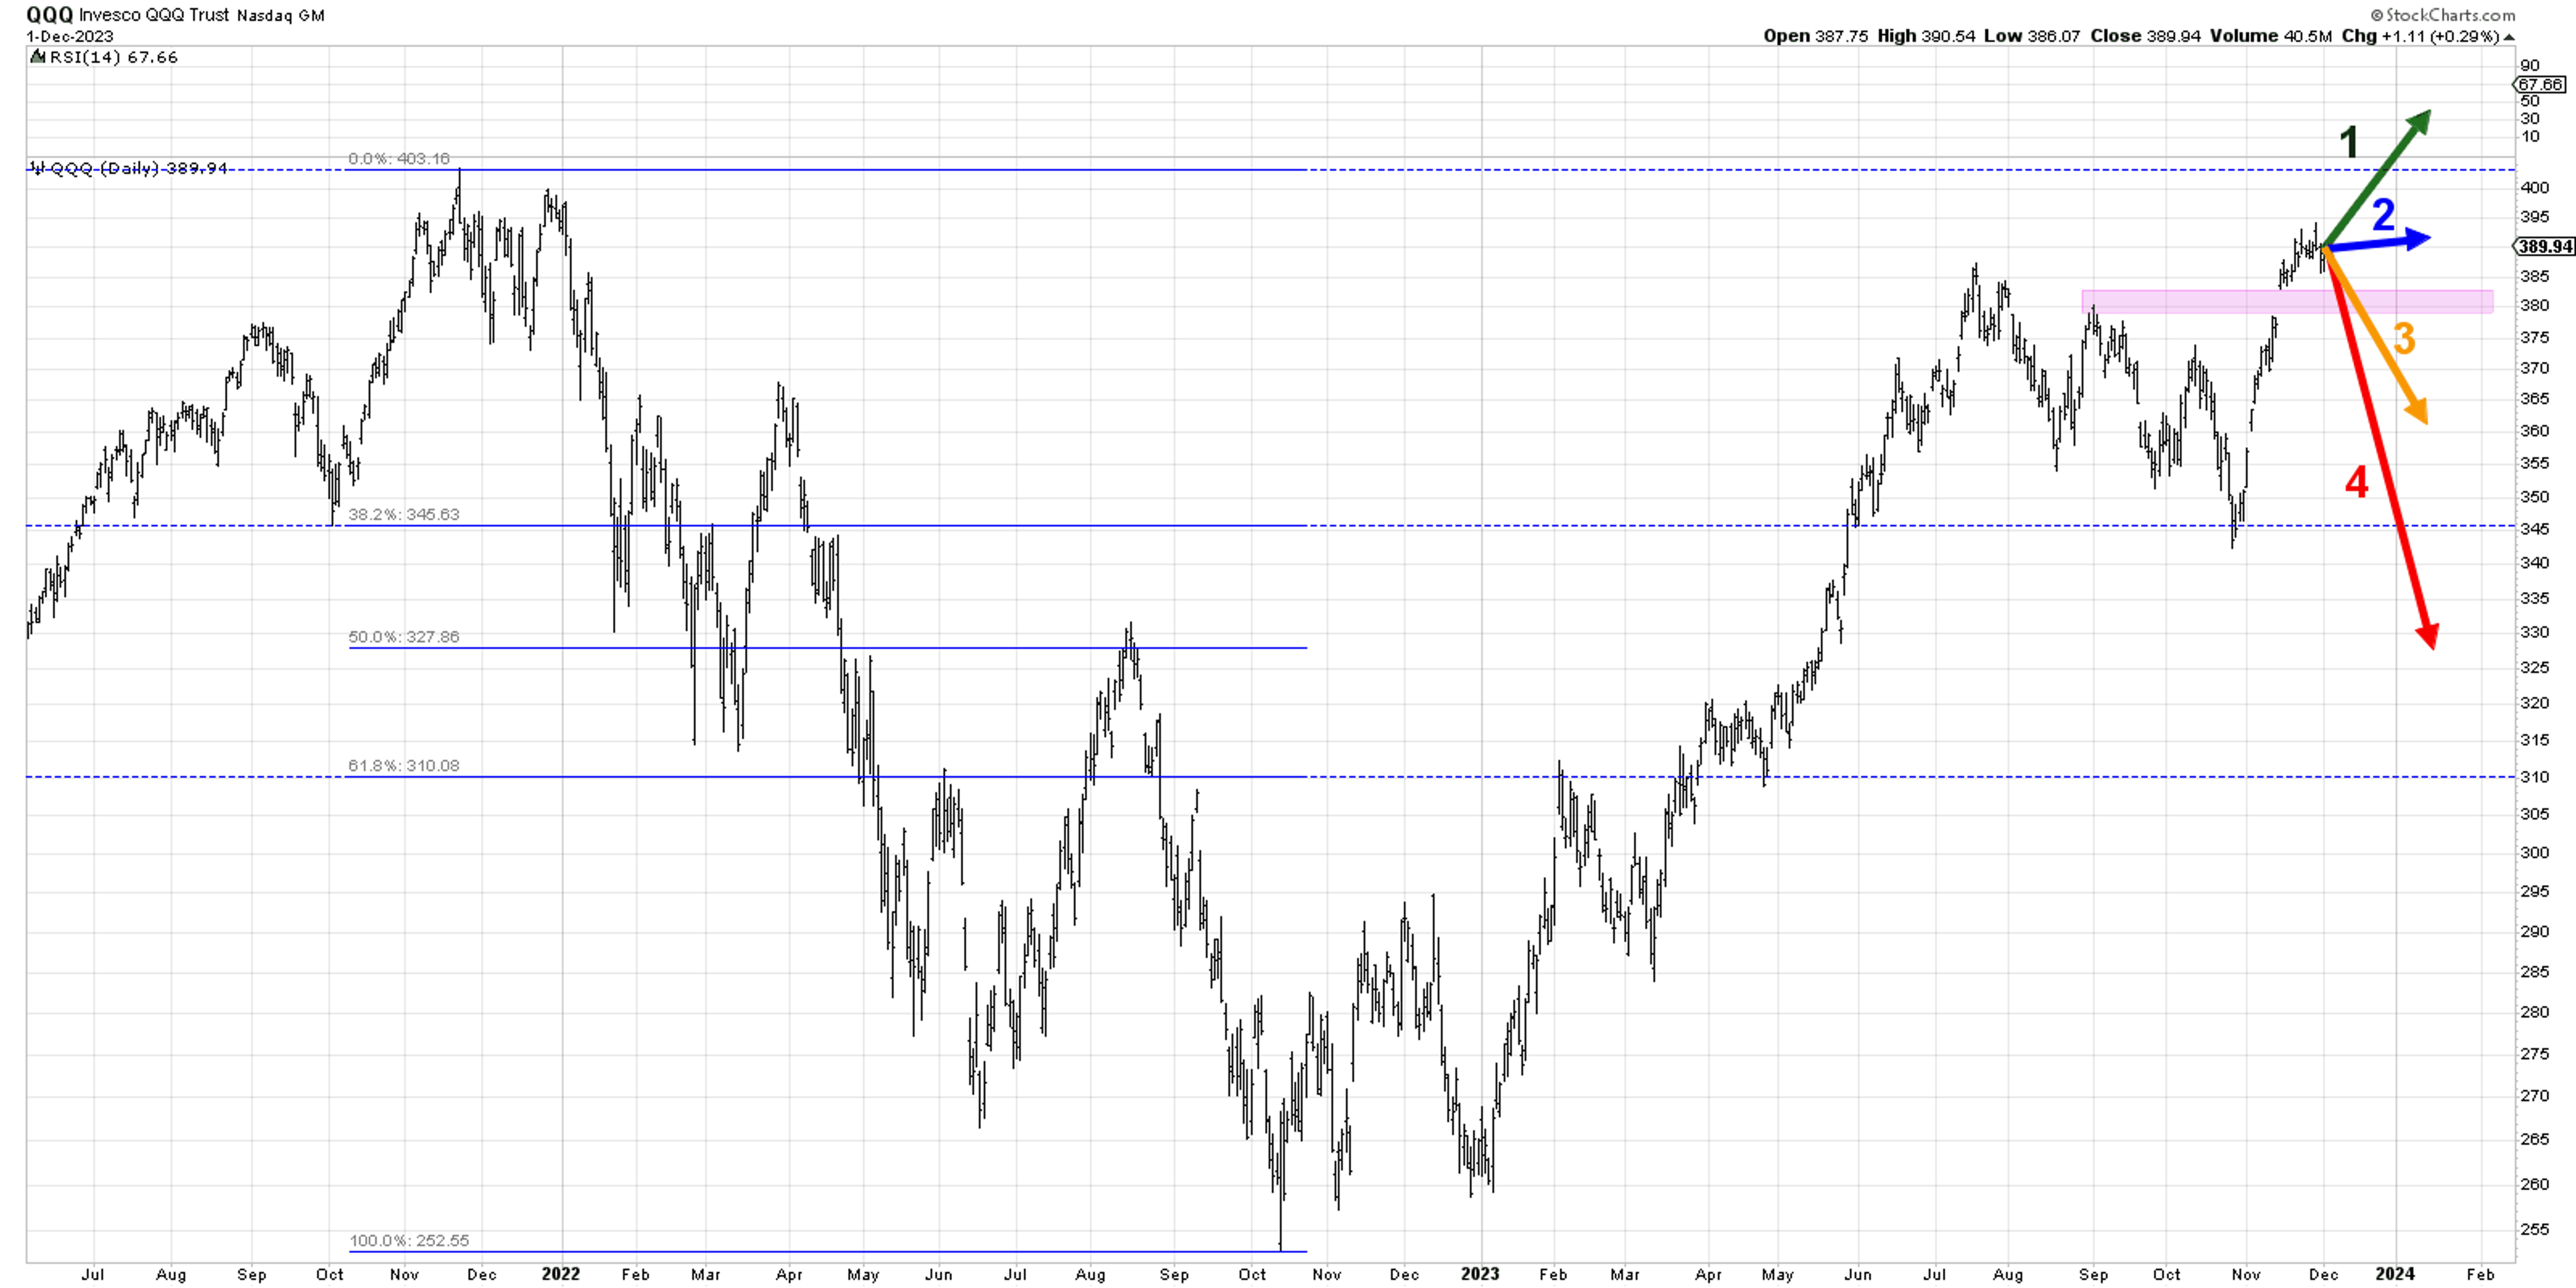
What could a pullback look like for the QQQ QQQ, and what would that mean for conditions heading into January 2024? And what other scenarios are a possibility for growth stocks? Let’s lay out four potential outcomes for the Nasdaq 100, and I’ll share my estimated probability for each scenario.
And remember the point of this exercise is threefold:
- Consider all four potential future paths for the index, think about what would cause each scenario to unfold in terms of the macro drivers, and review what signals/patterns/indicators would confirm the scenario.
- Decide which scenario you feel is most likely, and why you think that's the case. Don't forget to drop me a comment and let me know your vote!
- Think about how each of the four scenarios would impact your current portfolio. How would you manage risk in each case? How and when would you take action to adapt to this new reality?
Let's start with the most optimistic scenario, involving a new all-time high in January 2024.


Option 1: The Very Bullish Scenario
The most optimistic scenario would mean the last week was a bit of an aberration, a brief respite in the year of growth dominance. The Magnificent 7 stocks break higher into year-end, giving the Nasdaq 100 a new all-time high in January. Is that just the beginning of a supremely bullish 2024?
Given how stocks like GOOGL GOOGL and NFLX have already dropped after showing signs of upside exhaustion, I don’t see this as a likely option. But it’s always good to think through the goldilocks scenario, if only to think through what signs could show it’s becoming more likely.
Dave’s Vote: 10%
Option 2: The Mildly Bullish Scenario
If you think growth stocks do pull back from their overbought conditions, and that the pause in this recent upswing delays any further rally into early next year, then this may be a more decent choice. The gap higher around $380 from a couple weeks ago after October CPI seems like a decent downside boundary for this mildly bullish scenario.
This one is really my base case here, as the seasonal patterns would suggest a strong December following a strong November. But I see signs of upside exhaustion in breadth indicators as well, and I would not be surprised if a pullback continues into mid-December.
Dave’s vote: 60%
Option 3: The Mildly Bearish Scenario
What if the gap mentioned above does not hold, and an initial pullback in the Magificent 7 stocks ends up ushering in additional sellers who begin to fear a much further drop? Pullbacks in uptrends can be sudden and disorienting, and even if value stocks like Industrials and Financials manage to rally, it still wouldn’t be enough to prevent our growth-oriented benchmarks from pushing lower.
I could see this happening given the severity of the rally off the October low, and that price gap around $380 is going to be an important level to monitor. It’s hard not see charts like NFLX as a big double top right about now!
Dave’s vote: 25%
Option 4: The Super Bearish Scenario
I always include a very negative and very unlikely scenario, because it helps to think about what risk factors could light up to warn of additional selling to come. If economic data in December comes in hotter than expected, or the Fed stresses that additional rate hikes are still on the table, or the Ten Year Treasury Yield turns back up toward 5%, then this could certainly happen.
A drop below the October lows seems incredibly unlikely, given the seasonal strength in December and how much growth stocks would have to drop coming off a very solid run higher. But it’s best to think these options through before they actually happen!
Dave’s vote: 5%
What probabilities would you assign to each of these four scenarios? We have two videos queued up to show you how each scenario may play out, and how we would assign probabilities to each of the four options.
Watch this one first, which outlines the four scenarios and how they could play out:
Then watch this one, which assigns the probabilities for each along with what motivated the results:
RR#6, Dave
PS- Ready to upgrade your investment process? Check out my free behavioral investing course!
David Keller, CMT Chief Market Strategist StockCharts.com
David Keller, CMT is Chief Market Strategist at StockCharts.com, where he helps investors minimize behavioral biases through technical analysis. He is also President and Chief Strategist at Sierra Alpha Research LLC, a boutique investment research firm focused on managing risk through market awareness. He is a Past President of the Chartered Market Technician (CMT) Association and currently serves on the CMT Curriculum and Test Committee. David was formerly a Managing Director of Research at Fidelity Investments in Boston as well as a technical analysis specialist for Bloomberg in New York. You can follow his thinking at MarketMisbehavior.com, where he explores the relationship between behavioral psychology and the financial markets.
Disclaimer: This blog is for educational purposes only and should not be construed as financial advice. The ideas and strategies should never be used without first assessing your own personal and financial situation, or without consulting a financial professional.
The author does not have a position in mentioned securities at the time of publication. Any opinions expressed herein are solely those of the author and do not in any way represent the views or opinions of any other person or entity.
Edge Rankings
Price Trend
© 2025 Benzinga.com. Benzinga does not provide investment advice. All rights reserved.
Trade confidently with insights and alerts from analyst ratings, free reports and breaking news that affects the stocks you care about.

