


(Tuesday market open) One session into the month and October feels a lot like September, with major indexes unable to sustain rallies as Treasury yields climb the ladder. The 10-year Treasury note yield topped 4.7% this morning for the first time in 16 years, and major indexes turned red in premarket trading.
Other elements of the tricky triumvirate of crude, the dollar, and yields were mixed today. The Dollar Index ($DXY) jumped to a new 2023 high above 107—a level that could make earnings growth tougher for U.S. companies selling products overseas. But crude oil prices eased to two-week lows amid hopes for more production (see below). Investors await key jobs data this morning and later this week.
Yesterday’s struggles could arguably be blamed on comments by Federal Reserve speakers, including Fed Governor Michelle Bowman’s support of more rate hikes. The Federal Open Market Committee’s (FOMC) latest projections show rates rising just one more time before the current cycle ends. The market builds in close to 30% chances of a 25-basis-point rate increase next month.
Trading today could again hinge on remarks from Fed officials, and there’s a full flock of them this week, including Atlanta Fed President Raphael Bostic, San Francisco Fed President Mary Daly, Chicago Fed President Austan Goolsbee, and Cleveland Fed President Loretta Mester.
“The market will parse their comments carefully for any insight on the future direction of rates and quantitative tightening,” says Jeffrey Kleintop, chief global investment strategist at Schwab.
Energy shares were under pressure on Monday as crude oil prices posted their lowest close since mid-September possibly due in part to profit-taking by speculators. Financial shares also fell as higher yields turned the focus back toward a challenging loan picture for many banks. Tech shares bucked the softer trend yesterday as mega-caps found buyers after a rough quarter.


Morning rush
- The 10-year Treasury note yield (TNX) jumped 5 basis points to 4.73%, the highest in 16 years.
- The U.S. Dollar Index ($DXY) reached a new 2023 high and recently traded at 107.23.
- Cboe Volatility Index (VIX) futures edged higher to 18.5.
- WTI Crude Oil (/CL) fell 0.5% to $88.40 per barrel.
The recent spike in 10-year Treasury note yields reflects a stew of factors: increased supply from the U.S. Treasury as deficits climb; recent hawkish Fed comments and projections; mounting worries that inflation and high interest rates could last well into next year; the Fed’s quantitative tightening (QT) policy; and fears of less demand for U.S. Treasuries from overseas investors as rates rise in places like Japan. That said, foreign demand for U.S. Treasuries remains strong for now, says Kathy Jones, Schwab’s chief fixed income strategist.
What to watch
Jobs fair: We’re entering a heavy stretch for data, beginning with today’s Job Openings and Labor Turnover Survey (JOLTS) report. It’s due out soon after the open and could influence trading. A higher-than-expected headline number might get a bearish read as a sign the jobs market remains tight. Recent nine-month lows in initial unemployment claims helped drive JOLTS expectations higher ahead of the report.
Analysts surveyed by Trading Economics expect job openings to stay roughly steady near 8.8 million in August, down from double-digits during the initial pandemic recovery. A narrowing gap between available jobs and available workers is what the Fed wants to see, because it could keep inflationary wage increases from accelerating.
Friday’s September Nonfarm Payrolls report is expected to show jobs growth of 158,000, down from 187,000 in August, according to Trading Economics. Digging deeper, analysts expect the September unemployment rate to be 3.7%, down from 3.8% in August, and hourly wage growth of 0.3%, from 0.2% in August. The average work week is seen unchanged.
If analysts are correct about the overall 158,000 number, it would help confirm the reduction of job market growth from the epic gains in 2021 and 2022. However, analysts have a long record of underestimating the government’s monthly headline figure, and the government has a long record of initially issuing bountiful growth numbers followed by downward revisions. In sum, this one is getting tougher to predict and follow. As always, look for any revisions to the August and July data.
Yesterday’s September Institute for Supply Management (ISM) Manufacturing Index featured headline and expectations figures topping Wall Street’s estimates. That said, it was the 11th straight month of contraction for the ISM below 50, coming in at 49%. The report’s prices component gave some ground, the latest sign that disinflation continues at least on the goods side of the economy even as services inflation remains elevated.
OPEC on deck: The crude cartel and its allies meet this week and could decide Wednesday on production plans. One thing to watch is signs that Saudi Arabia might end its lowered production early in the face of high crude prices that could potentially blunt global economic growth. Those worries surfaced in some of yesterday’s lower crude trade.
OPEC’s production rose more than 100,000 barrels a day in September from August, the second monthly increase in a row, Reuters said. This reflects increased production from Iran and Nigeria even as Saudi Arabia stuck with its promise to cut 1 million barrels per day from output—which it intends to do until the end of the year. With prices so high, it’s going to likely be difficult for the cartel to keep all its members in line with quotas.
Stocks in spotlight
Strike update: U.S. automakers have lost $4 billion since the strike by the United Auto Workers (UAW) began, media reports said last night, citing research by economic consulting firm Anderson Economic Group. Shares of the companies are relatively flat since the strike began last month. Meanwhile, Ford F and General Motors GM are eliminating 500 factory jobs, the Wall Street Journal reports.
Lights out at utilities: Quietly, the S&P 500 utilities sector is taking a beating. It plunged almost 5% Monday after a nearly 10% drop in September. It’s lost 20% year-to-date, burdened in part by rising costs for utility companies and by competition from Treasuries and their 16-year high yields. When Treasury yields spike, it often pressures “defensive” sectors like utilities and staples that derive some of their stock values from paying out generous dividends.
Some investors might see the selloff and be tempted to jump into utilities, which also have one of the lower sector valuations on Wall Street. However, keep in mind that utilities sector earnings growth is expected to be 9th of the 11 sectors next year, according to research firm CFRA. And if rates stay “higher for longer,” as the market baked in after the last Fed meeting, that’s also not the best news for utilities.
Eye on the Fed
Early today, the probability that the Federal Open Market Committee (FOMC) will raise its benchmark funds rate from its current 5.25% to 5.50% target range following its October 31–November 1 meeting was 28%, according to the CME FedWatch Tool. Odds that rates could be a quarter-point higher coming out of the December 12–13 meeting were about 45%.
Green machine: The U.S. dollar recently motored to its highest levels all year as the Fed promised higher rates for longer. What’s next for this currency with so much impact on the global economy? Schwab’s Kathy Jones takes a look in her latest article.
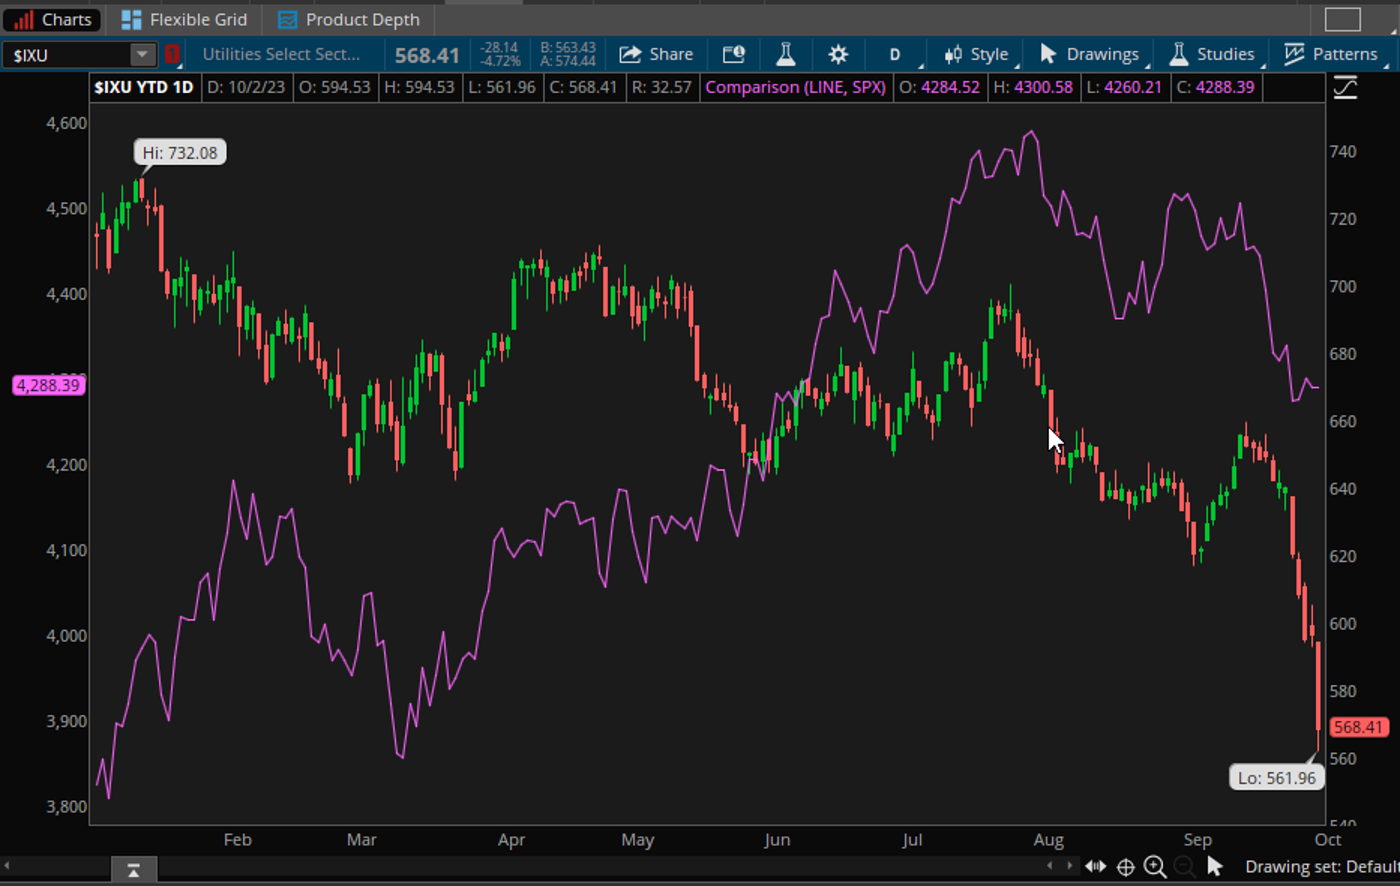
CHART OF THE DAY: LIGHTS OUT. The S&P 500 Index (SPX-purple line) has had a tough two months, but nothing compared with the struggles of the S&P utilities sector (IXU-candlesticks), which fell nearly 5% on Monday alone, dragged down by rising Treasury yields. Data source: S&P Dow Jones Indices. Chart source: The thinkorswim® platform from TD Ameritrade. For illustrative purposes only. Past performance does not guarantee future results.
Thinking cap
Ideas to mull as you trade or invest
Uphill climb: The Fed continues its quantitative tightening (QT) program, which slowly reduces its balance sheet to raise borrowing costs around the economy. Researchers are unclear how much impact QT has, as this is only the second attempt at it. The hardest work may be ahead, especially with the heavy issuance of U.S. government debt in some ways working against the central bank. Even other central banks can diminish the Fed’s impact. For instance, ideas that the Bank of Japan (BoJ) might raise rates in coming quarters caused U.S. yields to spike this summer as investors anticipated greater Japanese demand for domestic debt. Some or all these factors might have driven FOMC policy makers’ 2024 projections that removed two rate cuts built into their previous model. Minutes from the September FOMC meeting due October 11 might shed light.
Curve bending: The curve between the 10-year Treasury note yield and 2-year Treasury note yield (sometimes called the 10/2) remains inverted, but much less than its peak earlier this year. It’s narrowed to less than 50 basis points from more than 100, mainly because of rising longer-term yields. This strength reflects multiple factors beyond basic worries about higher interest rates for longer. Another possible factor pushing long-term yields higher could be investors fretting about inflation, perhaps driven by energy prices.
Scraping barrel: The S&P 500® Index (SPX) trades not far above its 200-day moving average of near 4,200. However, two factors might be in the market’s favor, including very low bullish expectations among investors (which can be a contrarian positive indicator), and the fact that just 11% of SPX stocks traded above their respective 50-day moving averages entering the week. The percentage is slightly higher for Nasdaq (COMP) stocks at 21%, but still near the bottom of the barrel historically. Percentages like this could imply oversold conditions.
Calendar
Oct. 4: September ISM Non-Manufacturing Index and August Factory Orders.
Oct. 5: August Trade Balance and expected earnings from Conagra (CAG).
Oct. 6: September Nonfarm Payrolls.
Oct. 9: No major earnings or data expected.
Oct. 10: August Wholesale Inventories and expected earnings from PepsiCo (PEP).
The Schwab Center for Financial Research is a division of Charles Schwab & Co., Inc.
Charles Schwab & Co., Inc. (“Schwab”) and TD Ameritrade, Inc., members SIPC are separate but affiliated subsidiaries of The Charles Schwab Corporation. TD Ameritrade is a trademark jointly owned by TD Ameritrade IP Company, Inc. and The Toronto-Dominion Bank.
TD Ameritrade® commentary for educational purposes only. Member SIPC.
Image sourced from Shutterstock
This post contains sponsored content. This content is for informational purposes only and not intended to be investing advice.
Edge Rankings
Price Trend
© 2025 Benzinga.com. Benzinga does not provide investment advice. All rights reserved.
Trade confidently with insights and alerts from analyst ratings, free reports and breaking news that affects the stocks you care about.

