


(Thursday Market Open) The Federal Reserve apparently still has work to do, judging from fresh data Thursday. That has Wall Street a bit anxious.
The government’s third estimate of Gross Domestic Product (GDP) is usually a nonevent, but Thursday’s report is another example of 2022 being a continuing exception. The stronger-than-expected growth and inflation in GDP pushed stock index futures down further after previous overnight losses.
Final Q3 GDP rose 3.2%, the government said, up from its previous estimate of 2.9%. In normal times, this would be great news, but today it’s getting a cold shoulder from Wall Street as it could raise concerns that the Fed might have to tighten rates even more to snuff out this galloping economy. The GDP deflator, which measures changes in the price of goods and services, was 4.4%, above Wall Street’s 4.3% consensus.
Piling on, initial jobless claims for the week were near the low end of the recent range at 216,000. Continuing claims didn’t budge.
The labor market isn’t cooling, and inflation and growth are both higher. This isn’t the kind of data the equities market wanted, and it could show up especially in the interest-rate sensitive stocks like info tech and the info tech sub-sector semiconductors.
One thing to keep in mind is that trading volume has been low all week, which can exacerbate moves one way or the other. If you’re trading these markets, consider extra caution. Also, in a low-volume environment around the holidays, there’s something of a legitimacy question around any moves, either up or down. Without the kind of volume that shows widespread conviction, it’s often hard to claim that the market is truly tilting in any particular direction.
While strong earnings from Nike NKE provided a tailwind on Wednesday, the market is feeling pressure today from two disappointing earnings reports shared by Micron MU and CarMax KMX.

Morning Rush
- The 10-year Treasury yield (TNX) is down slightly at 3.67%.
- The U.S. Dollar Index ($DXY) is steady near 104.06.
- Cboe Volatility Index® (VIX) futures are at 20.24.
- WTI Crude Oil (/CL) is up 1.67% at $79.67.
Heading into the holiday week, volatility remains relatively low, indicating market participants don’t expect any huge moves in the near future. However, both the 10-year yield and crude are flashing conflicting warning signs, as they’re significantly elevated from earlier this month.
Higher crude could make the Federal Reserve’s inflation-fighting job more difficult with energy prices potentially on the rise again. And while rising yields may indicate investors’ recession expectations could be moderating—that’s not good news for a Fed trying to cool spending and an overheated job market.
The 10-year yield clicked up slightly after the GDP and jobless claims data, so keep an eye on it to see if it continues climbing.
Potential Market Movers
Semiconductor chipmaker MU shares fell in premarket trading after the company missed Wall Street’s consensus earnings per share (EPS) and revenue estimates. Its outlook showed revenue would meet analysts’ forecasts but EPS would come up short. All in all, not a pretty picture. The company’s earnings press release emphasized cost-cutting measures and that the industry is “experiencing a severe imbalance” of supply and demand.
It wouldn’t be surprising to see other chip stocks like Nvidia (NVDA) and Advanced Micro Devices (AMD) get caught up in the negativity around MU. But on the other hand, there’s some sentiment out there that the sector has been kicked around enough and may be scraping against the bottom. Similar sentiment about a different industry helped lift FedEx (FDX) shares yesterday despite a less-than-stellar earnings report. So far this morning, however, MU remains solidly lower with 3% losses, and NVDA and AMD are also lower in premarket trading.
KMX shares cratered more than 13% in premarket trading after the company missed analysts’ earnings and revenue expectations. KMX and MU are the last major earnings before the new year.
Crunching Data
Today’s GDP report was more of a backward glance to last summer. Investors who want a better sense of the current economic situation will be glued to their screens tomorrow before the opening bell for November Personal Consumption Expenditures (PCE) prices and spending.
The PCE inflation reading is one that the Fed has said it pays close attention to, and Wall Street’s consensus is now for a 0.2% increase, according to research firm Briefing.com. PCE rose 0.3% in October and 6% year over year. Core PCE prices, which don’t include food and energy, are expected to increase to 0.3% in November after a 0.2% gain in October.
If PCE and core PCE come in as expected or below consensus, it likely will reinforce investor thinking that inflation is starting to fade. If they’re higher, the sound you hear on Wall Street might be “Timber!” as inflation and rate fears likely grab center stage. Get ready for possible volatility around the time those numbers come out at 8:30 a.m. ET tomorrow.
Personal spending, another data point coming out at 8:30 a.m. tomorrow, is expected to rise just 0.1% in November, down sharply from 0.8% in October and conceivably a sign that inflation and interest rates sapped consumers’ willingness to open their wallets. We saw signs of that in FDX earnings earlier this week.
Those are followed early Friday by:
- December Consumer Sentiment
- November New Home Sales
- November Durable Orders
- November Personal Consumption Expenditure (PCE) prices
Numbers to Know
4.50%–4.75%: It’s more than a month until the next Federal Open Market Committee (FOMC) meeting scheduled for January 31–February 1. Still, it’s not too early to start discussing the market’s expectations for rate policy coming out of that meeting. At this point, the odds are 72% of a 25-basis-point hike to 4.5%–4.75%, according to the CME FedWatch Tool. Traders have priced in 28% odds of a 50-basis-point hike at that time.
Whether we get 25 or 50 could depend on the inflation data between now and then, particularly numbers like this Friday’s PCE price data and next months’ Consumer Price Index (CPI) and Producer Price Index (PPI). Employment and wage growth between now and then also might play a big role in shaping the Fed’s decision, considering what Fed Chairman Jerome Powell said last week about the labor situation, which the Fed still considers overheated and contributing to price growth.
–7.7%: Existing home sales for November took a nosedive, extending the monthly streak of falling volume to 10 in a row. However, prices still rose for the 129th month in a row, with the median value up 3.5% to $370,000. To find the last time home prices fell from one month to the next, you have to go back to early 2012. Total home sales fell a massive 35% from a year ago in November, which is further evidence of higher interest rates slowing down the rate-sensitive sector. However, don’t expect prices to follow suit. Inventories fell month over month, and first-time buyers, who typically purchase lower-priced homes, accounted for just 28% of buyers in November. Fewer homes and more affluent buyers seldom lead to lower prices.
600,000: Sticking with the housing market, analysts expect tomorrow’s November New Home Sales to come in at a seasonally adjusted 600,000, down from 632,000 in October. That report is due soon after Friday’s opening bell.
12.4 million: That’s the number of still-unprocessed tax returns as of September 2022, well above 2021’s total backlog of 1.9 million. In a December report, the Government Accountability Office particularly called out Internal Revenue Service (IRS) delays in processing seasonal tax refunds, which for many households represent fairly substantial sums to save, spend, or invest. In 2022, the average refund was about $3,100. Will relief come with the recent hiring of more than 4,000 IRS customer service representatives and 700 in-person taxpayer assistance center staffers? Stay tuned—and perhaps, prepare to stay patient.
Reviewing the Market Minutes
Tuesday’s stock market gains were the equivalent of dipping a toe into the water. Wednesday was a full-fledged swim as major indexes started higher and stayed there pretty much all day. Volume came in below normal levels, however, again raising questions about market conviction.
The media explained it as an earnings-influenced rally, but that’s hard to support. Yes, Nike (NKE) had a great quarter, but FDX really didn’t impress, and one solid earnings report doesn’t necessarily change Wall Street’s long-standing view that next year’s average analyst estimate of 5.3% S&P 500® EPS growth is likely going to have to come down. Data were also mixed Wednesday between a soft Existing Home Sales report and a better-than-expected read on Consumer Confidence.
Instead, yesterday’s rally seemed more speculative and technical in nature. The S&P 500 index’s (SPX) resilience in bouncing back from 3,800 on Tuesday provided some early momentum, and once it breached resistance at 3,850, more buying interest appeared. Apparently, there’s money on the sidelines, perhaps trying to get into the market ahead of a possible “Santa Claus rally,” which isn’t guaranteed, of course, but traditionally takes place the week between Christmas and New Year’s. This isn’t much to hang your hat on and definitely not a good thing to build your investment strategy around, but speculators will speculate.
Having said all that, NKE appeared to be the spark needed to push the counternarrative that “earnings may not be as bad.”
Only time will tell the actual story.
Here’s how the major indexes performed Wednesday:
- The Dow Jones Industrial Average® ($DJI) rose 526 points, or 1.6%, to 33,376.
- The Nasdaq® ($COMP) climbed 1.54% to 10,709.
- The Russell 2000® (RUT) gained 1.65% to 1,776.
- The SPX rose 56 points, or 1.49%, to 3,878.
Every S&P sector rose yesterday; leaders included financials, energy, industrials, and info tech, which typically performs better in a growing economy.
Talking Technicals: As we noted yesterday, it’d be constructive technically if the SPX can hold these gains to close out the week and finish above key support at 3,850. The next resistance level is the round number of 3,900. One thing we’ve learned this week, if the current pattern holds, is that there’s plenty of buying interest when the SPX falls below 3,850. No guarantees it’ll happen again on the next fall below that, but it’s worth noting.
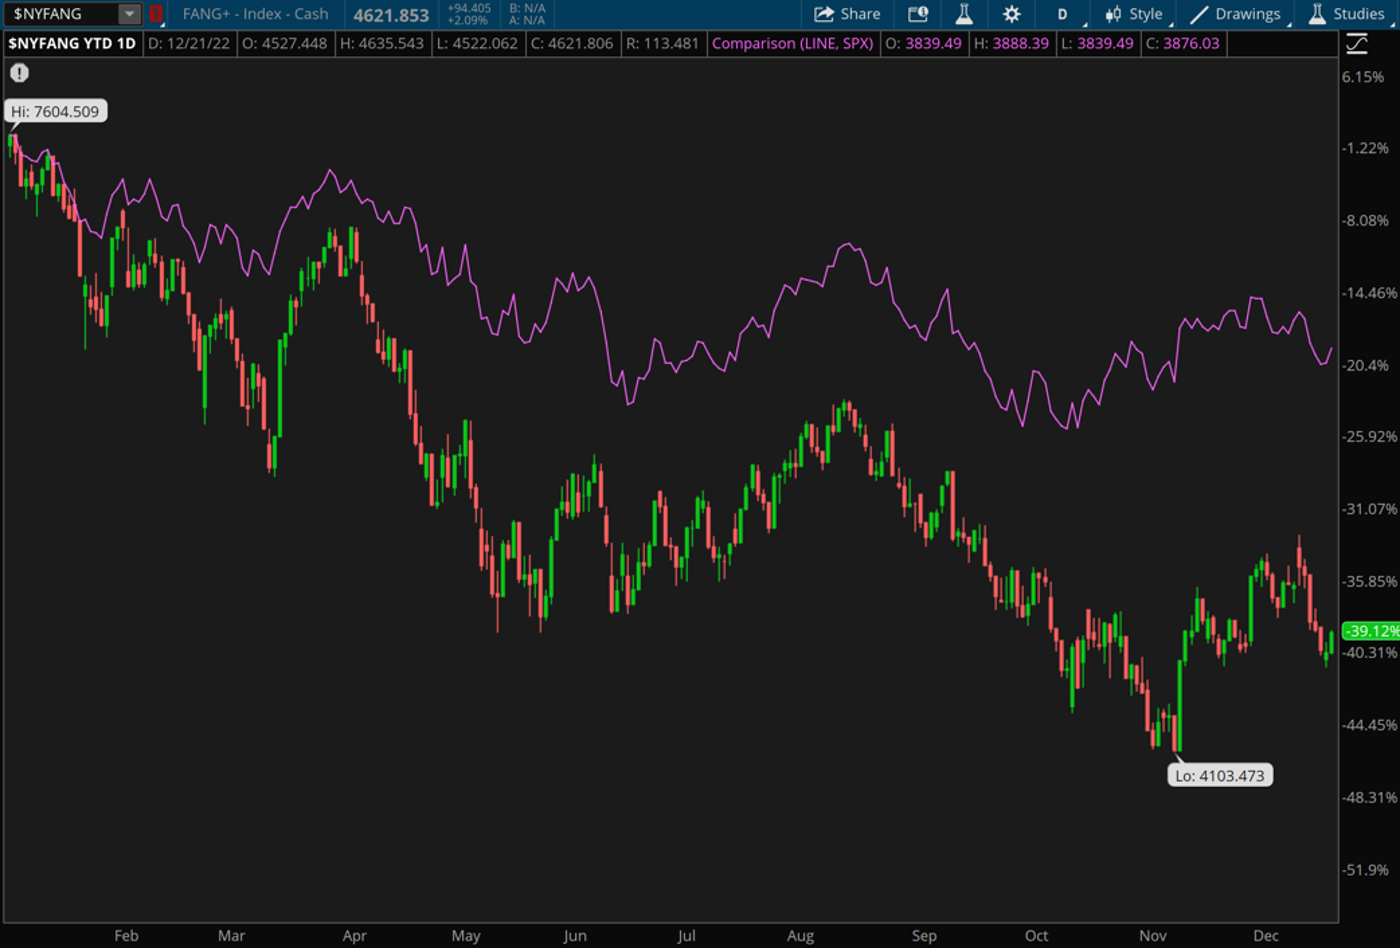
CHART OF THE DAY: NO FUN FOR FAANGS. Think the SPX (purple line) had a tough year? The stocks once known as the “FAANGs” can top that. The $NYFANG (candlesticks) has fallen 39.1% year to date versus roughly 19% for the SPX. That reflects the overall poor performance of info tech and communication services sectors in 2022, both of which are near the bottom of the sector scorecard. Consumer discretionary, which Amazon (AMZN) belongs to, has also struggled mightily. Data sources: NYSE, S&P Dow Jones Indices. Chart source: The thinkorswim® platform. For illustrative purposes only. Past performance does not guarantee future results.
Three Things to Watch
FAANG Flop: A few years ago, “FAANG” trading was a way of life on Wall Street, enlivened by the vigorous late 2010s performance of FAANG components Facebook (FB, now Meta Platforms, or MET), Amazon (AMZN), Apple (AAPL), Netflix NFLX), and Alphabet (GOOGL). Oh, how the mighty have fallen. An investor who’d put $1,000 into the $NYFANG on January 1, 2022, would find themselves with just $610 today after an ugly year for every component in the index (see chart above). Even AAPL, which had been holding up a bit better than some peers, lost its grip in December and is now down about 24% year to date, a worse performance than the SPX. It’s the first losing year for AAPL shares since a 6% loss in 2018, and the worst annual performance for the stock since a stomach-churning 56% plunge in 2008. So-called “Friends of FAANG” like Microsoft (MSFT) and Nvidia (NVDA) didn’t escape the 2022 damage either. Bulls might argue that this historically awful performance potentially positions the FAANGs and the info tech and communication services sectors they belong to for a 2023 revival. That can’t be ruled out, especially considering how the price-earnings (P/E) ratios have come back down for some of these shares. AAPL’s P/E recently sat near 22 after being well above 30 at the peak of the market, but whether FAANGs make a comeback could depend more on the economy’s ability to steer away from recession.
Looking Back: So if FAANGS weren’t the five stocks to own in 2022, which five high-visibility, high market-cap stocks had positive performances? You’d certainly need an energy component or maybe a few given that the SPX Energy Select Sector (IXE) rose more than 50% year to date. If you want the biggest energy firm for your bundle, that would be ExxonMobil (XOM), shares of which rose 75% in 2022. XOM just surpassed Tesla (TSLA) in market capitalization. Looking at other market-cap leaders for 2022, UnitedHealth Group (UNH) comes to mind, with shares up 4% year to date (relatively strong considering the SPX is down about 19%). Sticking with health care, we come across Johnson & Johnson (JNJ), up about 3% so far this year in a market that has rewarded “defensive” sectors like the health and staples areas JNJ has a hand in. Berkshire Hathaway (BRK.B) has its mitts on lots of staples companies, which could explain why it’s up 2.6% year to date. Rounding out our list, if we stick with mega-cap companies that saw shares rally in 2022, is, naturally, another energy company, Chevron (CVX). It’s enjoyed nearly 50% gains. So, there you have it, the FAANGS of 2022. But somehow, EUJBC doesn’t have the same ring.
2023 View: We’re not in the prediction business, so don’t ask which five big stocks you should own in 2023. However, from a big-picture perspective, Charles Schwab Chief Investment Strategist Liz Ann Sonders, in her 2023 Market Outlook podcast, suggested focusing on companies that are positioned to thrive in a realm of high-interest rates and elevated inflation.
“In a rising-interest-rate/high-inflation environment, you want to look for companies that have strong balance sheets with lower debt (and) higher cash flows,” Sonders said. “As rates go up, you want companies that have that cash flow that can pay the interest on their debt … You don’t want to focus on companies (with) cash flows or profitability way out into the future, because now, with higher interest rates, that makes those far-in-the-future cash flows and profits less valuable. I think there will be an opportunity to go a little bit more risk-on, kind of slightly down the quality spectrum to get leverage to a pickup in economic growth.”
Notable Calendar Items
Dec. 23: November Durable Orders, November Personal Income and Spending, November PCE Prices, November New Home Sales, and Final December University of Michigan Consumer Sentiment. Reader’s note: This will be our last regularly-scheduled Daily Market Update for 2022 unless there’s significant market volatility next week.
Dec. 26: Markets closed for official Christmas Day holiday. Enjoy if you celebrate!
Dec. 27: December Consumer Confidence
Dec. 28: November Pending Home Sales
Dec. 29: Weekly Initial Unemployment Claims
Dec. 30: December Chicago PMI
Jan. 2: Markets close in observance of New Year’s Day. Happy holidays! Reader’s note: Daily Market Update returns January 3.
This post contains sponsored advertising content. This content is for informational purposes only and not intended to be investing advice.
Edge Rankings
Price Trend
© 2025 Benzinga.com. Benzinga does not provide investment advice. All rights reserved.
Trade confidently with insights and alerts from analyst ratings, free reports and breaking news that affects the stocks you care about.

