


(Friday Market Open) Stocks quickly relinquished overnight gains Friday after wholesale inflation rose slightly more than expected in November. The eagerly awaited Producer Price Index (PPI) raised questions about how quickly inflation is cooling.
The November PPI showed a 0.3% gain in headline wholesale inflation and a 0.4% rise in the core category, versus Wall Street’s consensus expectation of 0.2% for each. The government also revised October’s headline and core figures upward to 0.3% and 0.1% from the previous 0.2% and 0.0%.
The year-over-year PPI moderated a bit to 7.4% from 8.1%, the lowest level in more than a year. That said, the rise in month-over-month data appears to be causing some uneasiness. Want a culprit? Here’s one: Vegetable prices climbed 38% last month.
Immediately after the report, the Dow Jones Industrial Average® ($DJI) dropped 150 points, erasing previous upward progress. The benchmark 10-year Treasury yield (TNX) added two basis points to 3.5%.
While the hotter-than-expected PPI data isn’t likely to change what the Fed’s been telegraphing about a likely 50-basis-point rate hike next week, higher inflation could lead to discussion down the line about a possible higher terminal, or peak, rate. The median Fed terminal rate was 4.6% back in September when it last made a projection. That will be updated Wednesday.
One way of looking at the action so far today following PPI is that the Street got overly optimistic on the trajectory of inflation. While there are still signs that the price picture is improving, it’s not going to be an overnight fix and there will be hiccups along the way. This is a hiccup.


Morning Rush
- The 10-year Treasury yield (TNX) rose 2 basis points after PPI to 3.5%.
- The U.S. Dollar Index ($DXY) sat right at 105.
- Cboe Volatility Index® (VIX) rose to 22.8.
- WTI Crude Oil (/CL) edged up to just above $72 per barrel but remains about 10% lower for the week.
Yesterday’s equity market saw relatively broad buying interest, and major indexes managed to rebound a couple times when the selling crept in. The 3,920 – 3,940 range has continued to form a support channel for the benchmark S&P 500® index (SPX).
Despite showing some resilience yesterday, the market entered Friday on pace for a losing week. Asian stocks mostly gained this week while European stocks fell.
Data Watch
Next week is all about the Federal Open Market Committee (FOMC) meeting. It starts Tuesday, and a rate decision is expected Wednesday afternoon.
- Before the Fed decides anything, it’ll look at Tuesday morning’s Consumer Price Index (CPI) data for November. Last month’s report, if you’ll recall, caused stocks to spike and Treasury yields to roll up the sidewalks when it came in much softer than analysts had expected. The October CPI report may be behind speculation that the Fed probably will raise rates by “just” 50 points next Wednesday, down from the series of 75-pointers it threw at the market the last four meetings.
- By now, it may be too late for the Fed to steer away from a 50-point hike even if the CPI data is a lot worse (higher) than expected. As of early Friday, the market still built in about a 20% chance that the Fed might raise rates 75 points, perhaps accounting for the possibility of a hot CPI number.
- Keep an eye on the CME FedWatch Tool today following the PPI data and on Tuesday following the CPI data. If that 20% chance starts climbing, look for stocks—especially interest-rate sensitive ones in areas like info tech and communication services—to perhaps take a hit and for yields to climb.
- If the FOMC meeting and CPI aren’t enough for you next week, wait until Thursday; it’s jam packed with data, including November retail sales, the Empire State Manufacturing survey, and November Industrial Production and Capacity Utilization.
Potential Market Movers
Several market bellwethers reported earnings after the bell Thursday, and judging by how shares reacted, it’s a mixed reception.
Broadcom AVGO took home the gold medal, achieving a quick 2% gain in postmarket trading after the company’s earnings per share (EPS) beat Wall Street’s estimates and revenue came in as analysts had expected. AVGO also issued better-than-expected guidance for its fiscal Q1 and reported strong product demand. Additionally, the company increased its dividend.
Because AVGO took gold, that leaves silver for Costco COST, which had shares fell about 1% after its EPS and revenue both missed Wall Street’s consensus views. The losses may have been blunted by the fact that COST already reported slowing November store sales, and the disappointment was already mostly built into the share price.
And bronze goes to Lululemon LULU, where shares dove 8% following an earnings report that was hard to find too much fault with. It met or beat Wall Street’s earnings and revenue expectations, and its guidance was within the expected range. Comparable store sales, an important category for retail, rose 14%, which looks solid. Perhaps there were some “whisper” numbers that investors had hoped the company might meet, or maybe they’d hoped LULU might provide better guidance (some analysts said just that after the news). It’s also possible that a drop in adjusted operating margin might’ve weighed on shares.
Thinking Cap
In her final Market Snapshot video of the year, Charles Schwab Chief Investment Strategist Liz Ann Sonders discussed her 2023 market outlook and called the Fed’s likely 50-basis-point hike next week an “important shift” from the 75-point hikes that occurred at the last four meetings.
It’s also important, she noted, to consider the cumulative impact of both the rate hikes and quantitative tightening, or QT—the process through which the Fed has been slowly reducing its $9 trillion balance sheet. Through QT, combined with rate hikes, the Fed hopes to soak up some of the excess dollars out there, making borrowing more difficult and cooling the overheated economy.
The San Francisco Fed has created a so-called proxy rate, which takes both current rates and the impact of QT into account for a better sense of just how tight economic conditions are. The proxy federal funds rate is more than 6%, well above the current federal funds rate of 3.75% – 4%.
“So, we have to look past just the level of short-term interest rates to understand the impact that (the Fed), to some degree, has already had,” Sonders said. Read her outlook or watch the video for more detail.
Reviewing the Market Minutes
After five losing sessions in a row and having its worst start to December since 2011, the SPX bounced back Thursday with moderate gains. So did the other major indexes, led by the Nasdaq Composite® ($COMP).
The $COMP added more than 1% following several days of posting the worst performance of the major indexes. It’s packed with info tech stocks that can be more fragile in times of economic pullbacks than the old-line industrial and staples stocks that dominate other parts of the market.
Here’s how the major indexes performed Thursday:
- The $DJI rose 183 points, or 0.55%, to 33,781.
- The $COMP climbed 1.13% to 11,082.
- The Russell 2000® (RUT) added 0.63% to 1,818.
- The SPX increased 29 points, or 0.75%, to 3,963.
Talking Technicals: The benchmark 10-year Treasury yield (TNX) continues to flirt with a trendline of support just below current levels, at around 3.44%. The yield briefly dropped below that midweek but quickly gained ground to trade back above it. Yields are quite sensitive to inflation data, so the path of PPI and CPI could help determine whether the TNX continues to rebound off this support area or plunges beneath it. Coincidentally or not, the 100-day moving average is near 3.48%, around the level of TNX early Friday before PPI. Technically, then, it’s fair to say the TNX is trading at an important inflection point, and it could be interesting to see which way it goes from here.
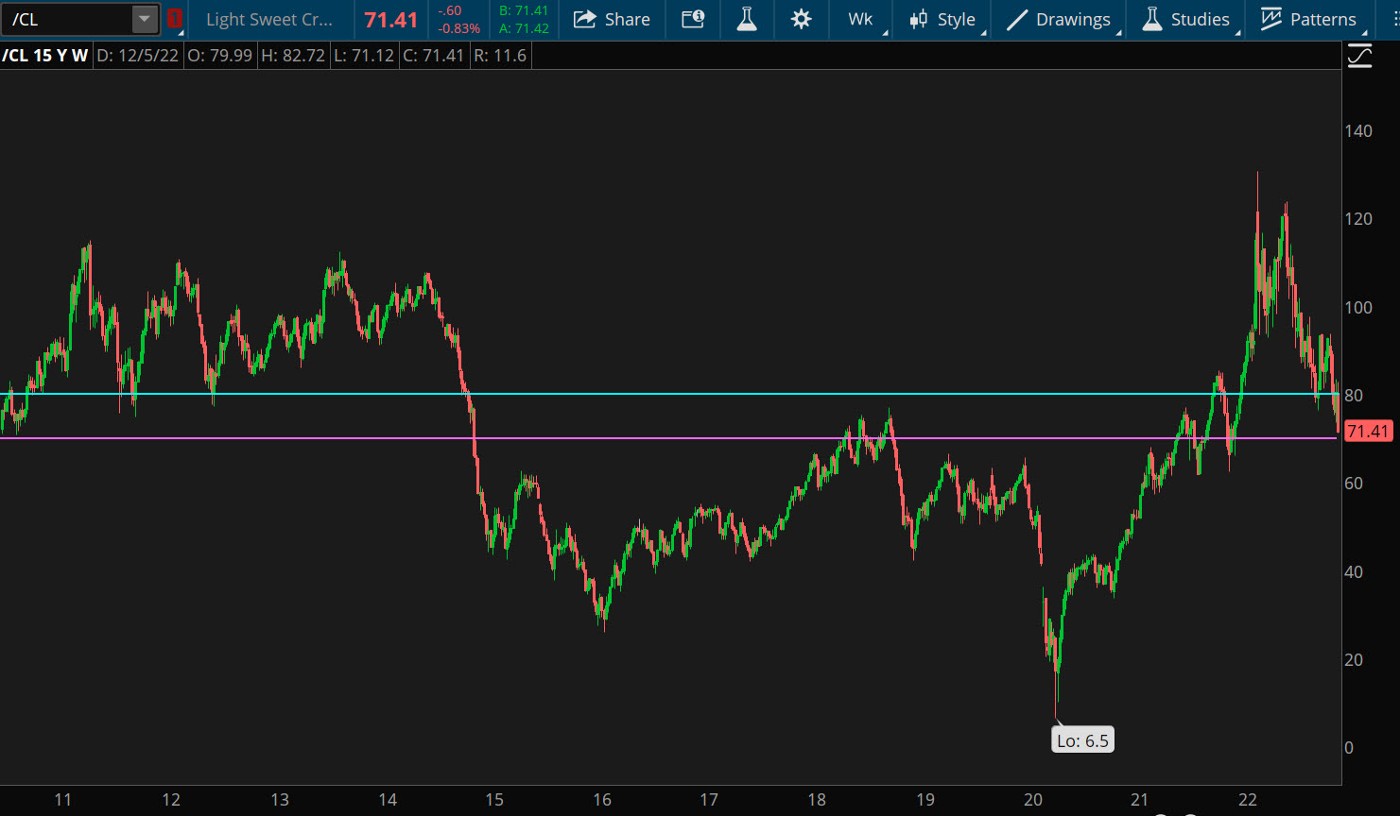
CHART OF THE DAY: $70 – $80 RANGE, WE HARDLY KNEW YE. After spending most of 2022 in historically high territory, Crude Oil (/CL – candlestick) pushed through $80 per barrel, and so far this week has continued to march into the low $70s, closing Thursday with a $71 handle. That’s not the first time we’ve seen a quick march through the $70s. Looking at the chart, /CL has spent most of the past 15 years either trending and chopping above $80 (blue line) or below $70 (purple line). Data Source: CME. Chart source: The thinkorswim® platform. For illustrative purposes only. Past performance does not guarantee future results.
Three Things to Watch
Silver Lining: Want a sense of the U.S. Dollar Index’s ($DXY) next move? Try following the silver market. These two have traded inversely for the last few weeks, Charles Schwab noted in its Looking to the Futures column, a pattern that continued Thursday. The equity market’s softness might’ve weighed on silver earlier this week. Though gold is often seen as a bellwether, silver has advantages. It draws demand from investors as a precious metal and also sees greater commercial demand for its use in industrial applications. It has several uses, including in solar energy, batteries for personal computers, and electric vehicles. Because silver is priced in dollars, a drop in the $DXY can raise demand for silver. Like gold, it’s considered a safe haven when inflation threatens (although no investment is truly safe).
Cheaper Gas—Who Benefits? Unless your portfolio is packed with energy stocks, you may be happy to learn that the price of gasoline in the United States is less now than a year ago. It’s the first time we can say that in 673 days, according to energy news site oilprice.com. Average prices dropped sharply last week, and some analysts believe the national average price might fall below $3 per gallon by the end of the year. That would be a nice holiday present and might give consumers a sense that they can spend more on stuff they really want like travel, gifts, and leisure.
It also removes some margin pressure from large retailers that rely on fuel to ship products from manufacturing centers to warehouses to stores, such as Amazon (AMZN), Walmart (WMT), Target (TGT), among others. It’s nice too for transports like airlines, trucking firms, and railroads (though most of them buy their fuel far in advance). For the energy sector, there’s been a bit of a divergence lately between crude prices and stock values. Energy shares are down 7% over the last month, and /CL is down 19% over the same time span. This means either energy stocks are primed to go much lower, or investors believe they can weather the storm.
Tech Comeback: Optical networking infrastructure company Ciena (CIEN) led the way for info tech Thursday after impressing with its earnings. Shares rose nearly 20% as investors seemed cheered by signs the company was breaking out of the supply chain struggles that had helped pressure it much of the year. Overall, the info tech and consumer discretionary sectors outpaced all others Thursday, with semiconductors having a nice day, led by 6% gains in Nvidia (NVDA). These happen to be the same two sectors that dominated the rally that lasted most of November. The question is whether this one-day move back toward more risky assets can last.
Notable Calendar Items
Dec. 12: November Treasury budget and expected earnings from Oracle (ORCL)
Dec. 13: November CPI, FOMC meeting begins, and expected earnings from ABM Industries (ABM)
Dec. 14: FOMC rate decision, quarterly projections and dot-plot, November Export and Import Prices, and expected earnings from Lennar (LEN)
Dec. 15: November Retail Sales, December Empire State Manufacturing, and November Industrial Production and Capacity Utilization
Dec. 16: Expected earnings from Accenture (ACN)
Dec. 19: No earnings or data of note
Dec. 20:November Housing Starts and Building Permits and expected earnings from General Mills (GIS) and Nike (NKE)
TD Ameritrade® commentary for educational purposes only. Member SIPC.
Image sourced from Shutterstock
This post contains sponsored advertising content. This content is for informational purposes only and not intended to be investing advice.
Edge Rankings
Price Trend
© 2025 Benzinga.com. Benzinga does not provide investment advice. All rights reserved.
Trade confidently with insights and alerts from analyst ratings, free reports and breaking news that affects the stocks you care about.

