


It’s unclear if a bottom is forming in a number of gold stocks, but a few price chart indicators are providing positive divergence signals. Momentum downward for these equities appears to be declining or to have stopped completely – a positive signal, unseen for a few weeks.
More clarity is required, to be certain, but it’s interesting to see how this trend is developing in these four gold stocks:
Equinox Gold Corp. (NYSEAMERICAN: EQX) is a Canadian gold miner now trading for about half its book value with a price-to-earnings (PE) ratio of 2.88. This year’s earnings-per-share (EPS) are up by 150%, but EQX has no past 5-year EPS record to compare. Its level of long-term debt is exceeded by shareholder equity. Here’s the daily chart:

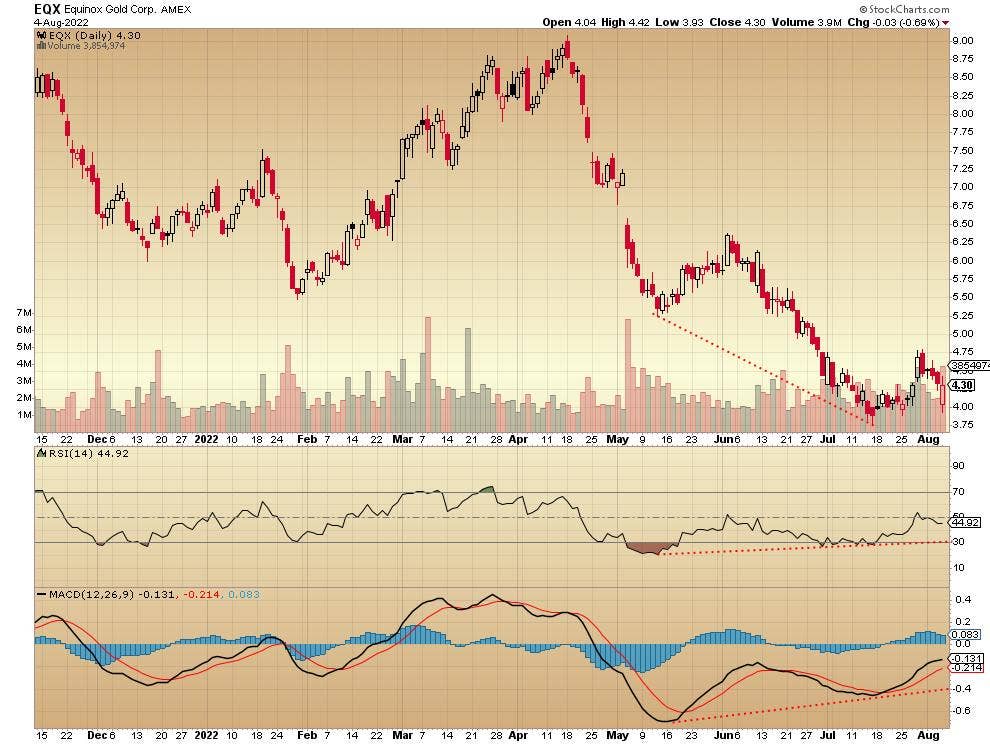
Note how the drop from the mid-May price low to the mid-July price low is accompanied by a higher July reading on the relative strength indicator (RSI). This move is confirmed by the higher low over the same time span on the moving average convergence/divergence chart (MACD). The drop in downward momentum is measurable.
Royal Gold Inc. (NASDAQ:RGLD) is headquartered in Denver, Colorado, with offices in Vancouver, British Columbia, Toronto, Ontario and Luzern, Switzerland. The company trades with a PE ratio of 23 and at 2.56 times book value. EPS is off this year by 54.30%; the past 5-year EPS growth rate is 6.30%. Royal Gold carries no long-term debt.
The daily price chart is here:

The RSI shows how the move downward in price loses momentum from June through July. The MACD confirms the RSI.
Sibanye Stillwater (NYSE:SBSW) is a South African-based gold miner that also produces significant platinum, palladium and other metals. Now trading at 1.46 times book value with a PE ratio of 3.65, the company’s earnings this year are up by 7% and the past 5-year EPS is a positive 39.20%. Sibanye Stillwater is paying a 13.10% dividend right now.
Here’s the daily price chart:
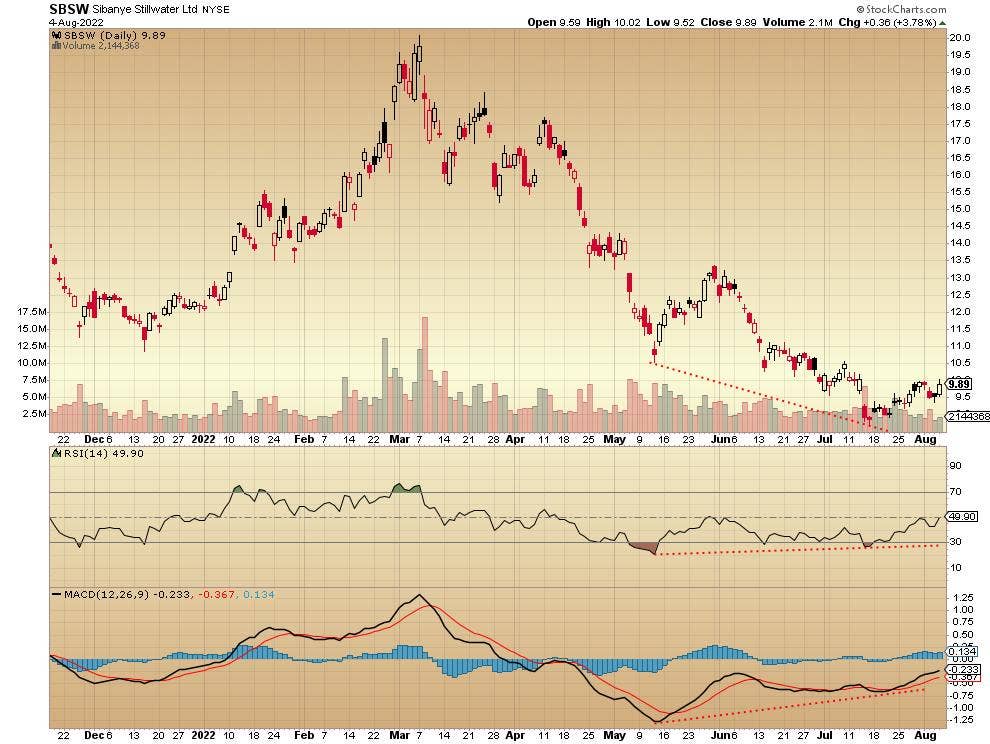
Both the RSI and the MACD indicator agree: downward momentum is slowing considerably.
Yamana Gold Inc. (NYSE:AUY) is headquartered in Toronto, Ontario, with operations in Canada, Brazil, Chile and Argentina. The stock is trading at just above book value (1.08x) with a PE ratio of 31.72. This year’s EPS is a negative 28.40%. The past 5-year EPS comes in at a positive 20.10%. Yamana pays a 2.41% dividend.
The daily price chart looks like this:
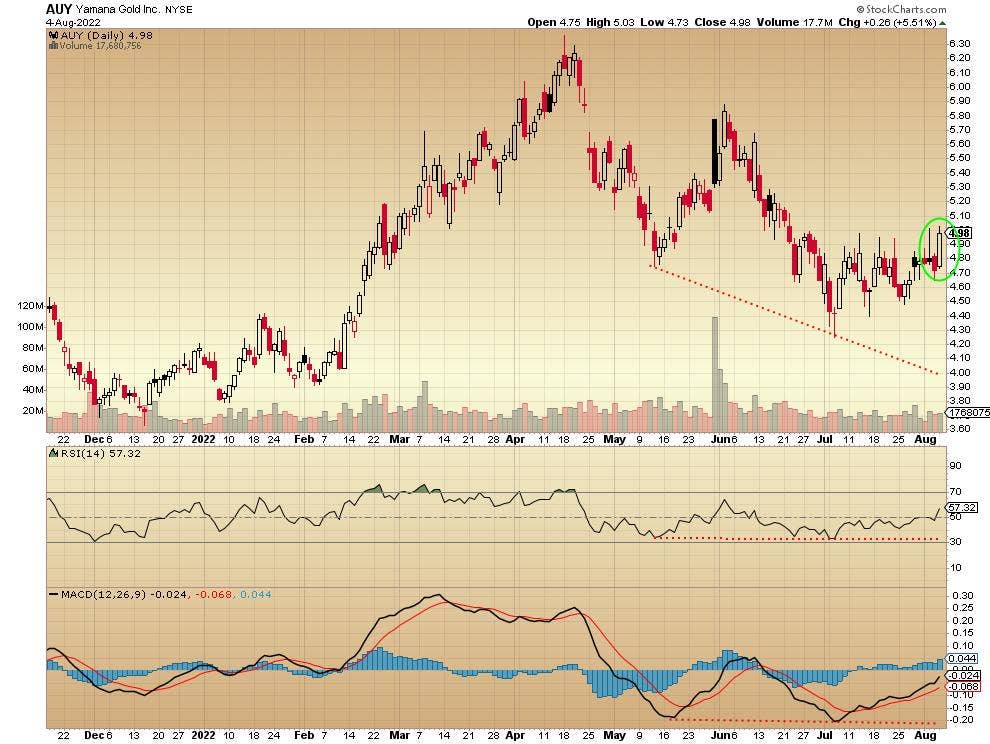
Although there is no confirmation of real momentum loss on the technical indicators – in the way it’s seen on the above three charts – it’s today’s candlestick that seems revealing. That’s a solid move higher, and it seems clear Yamana wants to break back above $5.
These price chart indicators by themselves are not enough to lead to decision making – an investor would want to see a number of other indicators lining up as well. These indicators are a “heads up” about what may be developing for these stocks and maybe for other stocks in the sector.
Looking for ways to boost your returns? Check out Benzinga's coverage of Alternative investments:
- You Can Become Part-Owner Of This Cash-Flowing Multifamily Real Estate Portfolio With an 8% Target Yield
- Fine Wine Continues To Outperform The Stock Market - Burgundy Index Up 24% YTD
- Why Billionaires Like Jeff Bezos Invest Millions In Artwork And How Retail Investors Found A Way To Get In On The Action
Not investment advice. For educational purposes only.
Charts by StockCharts
Image by Christoph Schaarschmidt on Shutterstock
© 2025 Benzinga.com. Benzinga does not provide investment advice. All rights reserved.