
Financial giants have made a conspicuous bearish move on Home Depot. Our analysis of options history for Home Depot HD revealed 18 unusual trades.
Delving into the details, we found 38% of traders were bullish, while 61% showed bearish tendencies. Out of all the trades we spotted, 14 were puts, with a value of $944,668, and 4 were calls, valued at $166,987.
Expected Price Movements
Based on the trading activity, it appears that the significant investors are aiming for a price territory stretching from $300.0 to $375.0 for Home Depot over the recent three months.
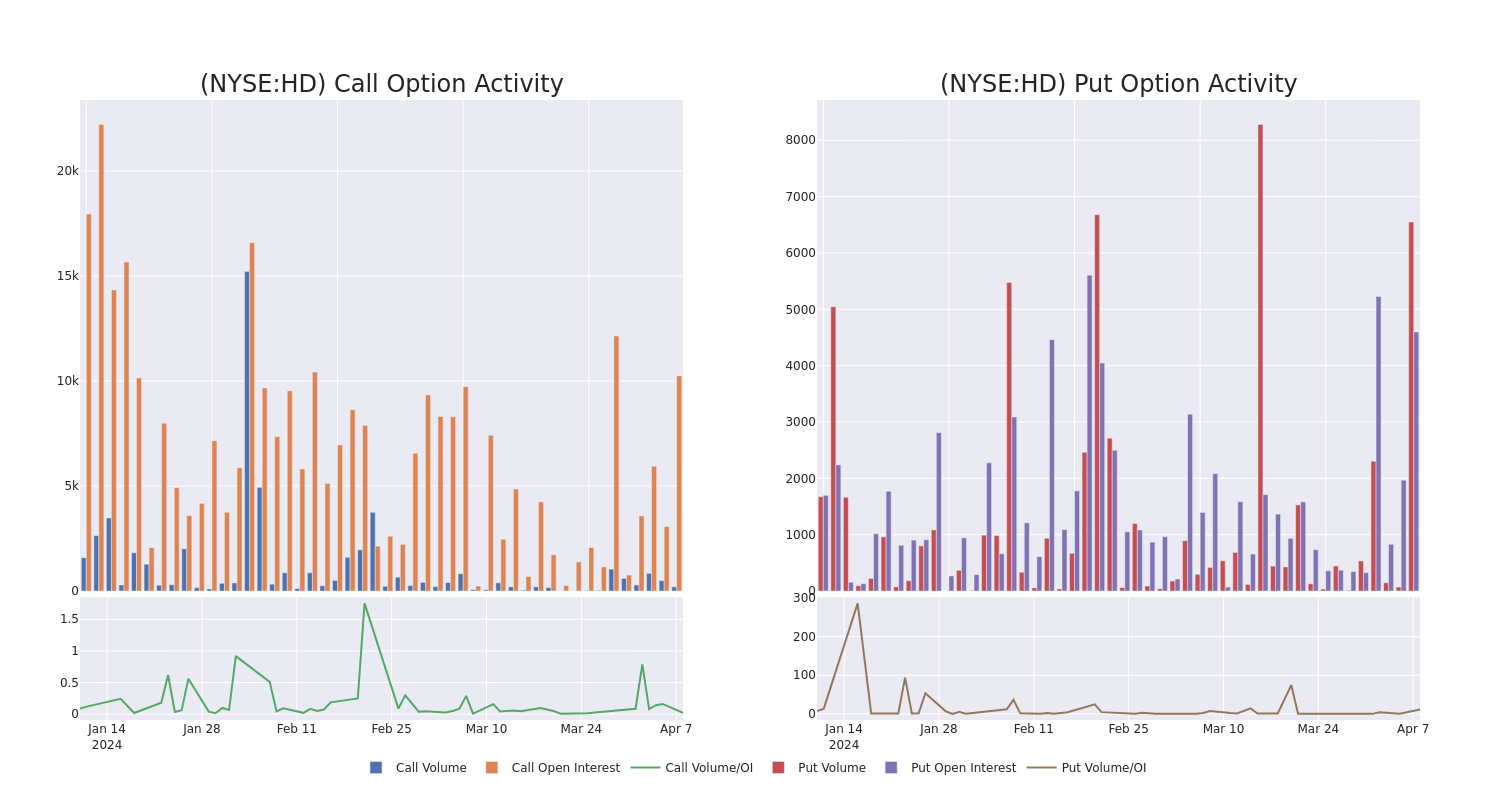
Insights into Volume & Open Interest
Looking at the volume and open interest is a powerful move while trading options. This data can help you track the liquidity and interest for Home Depot's options for a given strike price. Below, we can observe the evolution of the volume and open interest of calls and puts, respectively, for all of Home Depot's whale trades within a strike price range from $300.0 to $375.0 in the last 30 days.
Home Depot Option Activity Analysis: Last 30 Days
Significant Options Trades Detected:
| Symbol | PUT/CALL | Trade Type | Sentiment | Exp. Date | Ask | Bid | Price | Strike Price | Total Trade Price | Open Interest | Volume |
|---|---|---|---|---|---|---|---|---|---|---|---|
| HD | PUT | SWEEP | BEARISH | 05/17/24 | $7.5 | $7.45 | $7.45 | $355.00 | $167.3K | 480 | 1.2K |
| HD | PUT | SWEEP | NEUTRAL | 05/17/24 | $14.9 | $14.85 | $14.85 | $370.00 | $159.5K | 1.3K | 246 |
| HD | PUT | SWEEP | BULLISH | 05/17/24 | $7.6 | $7.55 | $7.55 | $355.00 | $154.3K | 480 | 1.6K |
| HD | PUT | SWEEP | BULLISH | 05/17/24 | $14.75 | $14.55 | $14.55 | $370.00 | $107.4K | 1.3K | 424 |
| HD | CALL | SWEEP | BEARISH | 05/17/24 | $7.8 | $7.6 | $7.65 | $370.00 | $82.4K | 585 | 157 |
About Home Depot
Home Depot is the world's largest home improvement specialty retailer, operating more than 2,300 warehouse-format stores offering more than 30,000 products in store and 1 million products online in the United States, Canada, and Mexico. Its stores offer numerous building materials, home improvement products, lawn and garden products, and decor products and provide various services, including home improvement installation services and tool and equipment rentals. The acquisition of distributor Interline Brands in 2015 allowed Home Depot to enter the maintenance, repair, and operations business, which has been expanded through the tie-up with HD Supply (2020). Moreover, the additions of the Company Store brought textile exposure to the lineup, while Redi Carpet added multifamily flooring.
In light of the recent options history for Home Depot, it's now appropriate to focus on the company itself. We aim to explore its current performance.
Home Depot's Current Market Status
- Trading volume stands at 1,681,426, with HD's price up by 0.4%, positioned at $359.31.
- RSI indicators show the stock to be is currently neutral between overbought and oversold.
- Earnings announcement expected in 36 days.
Options trading presents higher risks and potential rewards. Astute traders manage these risks by continually educating themselves, adapting their strategies, monitoring multiple indicators, and keeping a close eye on market movements. Stay informed about the latest Home Depot options trades with real-time alerts from Benzinga Pro.
© 2024 Benzinga.com. Benzinga does not provide investment advice. All rights reserved.
Comments
Trade confidently with insights and alerts from analyst ratings, free reports and breaking news that affects the stocks you care about.

