
Microvision Inc. MVIS shares traded 3.57% higher Monday, closing at $17.97 with no company news evident to explain the jump.
Here's a look at the stock's technical levels.
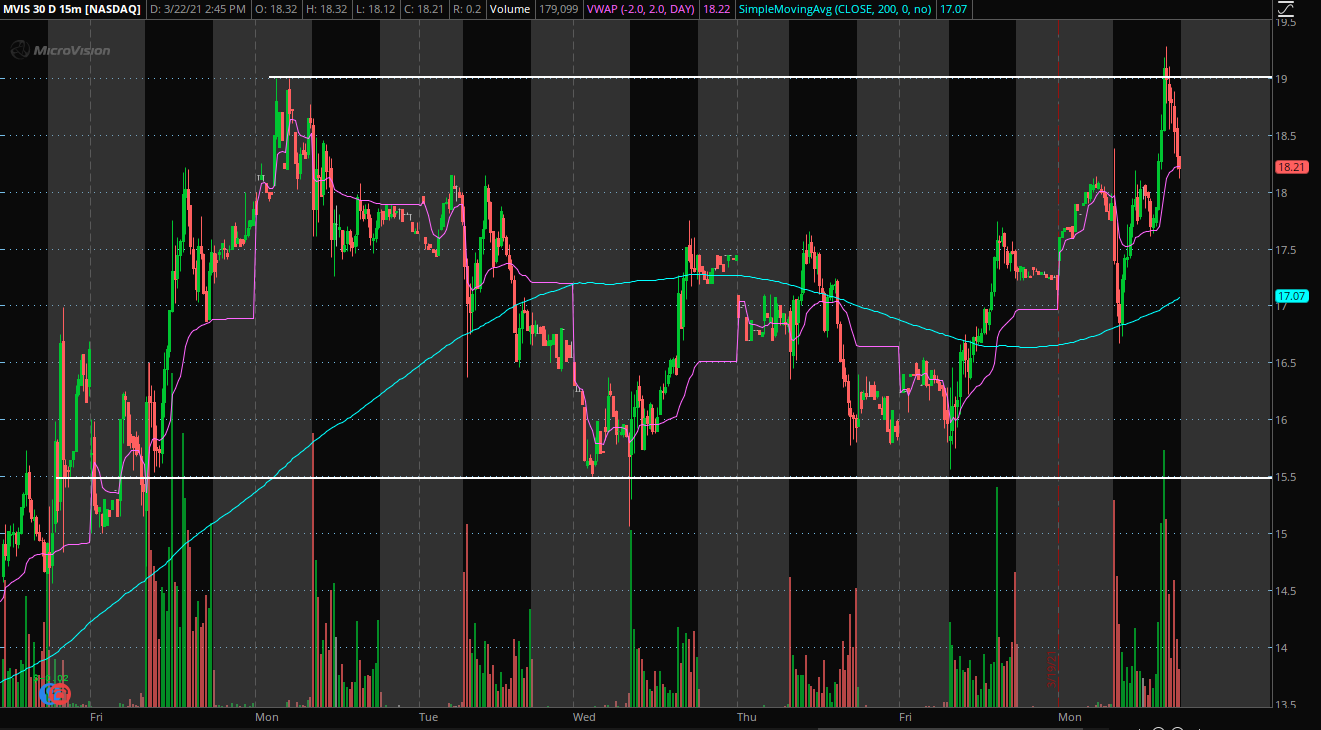
Microvision Short-Term Chart Analysis: The 15-minute chart above shows that Microvision has been trading in a channel between the prices of $15.50 and $19.
The stock has been unable to cross below the $15.50 price level in the short term. This hints that in the future it may hold as a support again.
The chart shows the price has struggled to stay above the $19 level, indicating this is a potential level of resistance in the future.
The stock is trading above both the 200-day moving average (blue) and the volume-weighted average price (pink), indicating the stock has bullish sentiment. These indicators could hold as support in the short term.

Microvision Daily Chart Analysis: The daily chart above shows the stock looks to be forming what technical traders may call an “inverse head and shoulders” pattern.
The pattern shows there is a support level near the $14 mark. If the price were to cross below this level, the stock may not find support until it reaches near $10.
The resistance of the pattern is shown to be near the $19 level. This is where bulls would like to see a strong close above to confirm the pattern. A strong close above the $20 level may be more ideal for the bulls to confirm the pattern.
Bears would like to see the stock cross below the support level of $14 before falling to the $10 support. If the $10 support were to break, bears may see a strong downward move following.
© 2024 Benzinga.com. Benzinga does not provide investment advice. All rights reserved.
Comments
Trade confidently with insights and alerts from analyst ratings, free reports and breaking news that affects the stocks you care about.

