


Zinger Key Points
- The SPY is trading in a long-term rising channel pattern and on Wednesday was bouncing up from the lower trend line.
- The pattern is considered to be bullish unless a stock or ETF breaks down from the channel on high volume.
- Today's manic market swings are creating the perfect setup for Matt’s next volatility trade. Get his next trade alert for free, right here.
The SPDR S&P 500 SPY was rising about 0.3% Wednesday amid persistent optimism that the Federal Reserve will cut interest rates this year.
Bullish economic indicators in the last quarter of 2023 and the first quarter of 2024 caused the SPY to surge 10% during the first three months of this year.
Whether or not the run higher across major equities will continue during the second quarter remains to be seen but for at least the short term, from a technical analysis perspective, the market ETF is respecting the upper and lower ascending trend lines of a rising channel. On Tuesday and Wednesday, the SPY tested the lower trend line of the pattern and bounced up from the area.
Read Next: Crude Prices Could Hit $95 This Summer: 'Oil Is Fighting The Fed, Again' - SPDR Select Sector Fund
More experienced traders who wish to play the SPY either bullishly or bearishly may choose to do so through one of two Direxion ETFs. Bullish traders can enter a short-term position in Direxion Daily S&P 500 Bull 3X Shares SPXL and bearish traders can trade the inverse ETF, Direxion Daily S&P 500 Bear 3X Shares SPXS.
The ETFs: SPXL and SPXS are triple leveraged funds that track the movement of the SPY, seeking a return of 300% or –300% on the return of the benchmark index over a single day.
It should be noted that leveraged ETFs are meant to be used as a trading vehicle as opposed to long-term investments
Want direct analysis? Find me in the BZ Pro lounge! Click here for a free trial.
The SPY Chart: The SPY has been trading in a steep uptrend since Oct. 27, making a fairly consistent series of higher highs and higher lows on the daily chart. Over the last few trading days, the SPY has been trading in a short downtrend but on Tuesday and Wednesday, looked to be bouncing up from the lower trend line of the channel, which could eventually negate the downtrend.
- A rising channel is considered to be bullish until a stock or index breaks down from the lower trend line of the pattern on higher-than-average volume. When that eventually happens, it could signal a longer-term retracement is on the horizon.
- If the SPY closes Wednesday’s trading session near its high-of-day, it will form a bullish Marubozu candlestick, which could indicate higher prices will come again on Thursday. If the SPY continues to rebound, the ETF may find resistance at the median line of the channel.
- Bearish traders want to see big bearish volume enter to break the SPY down through the bottom of the channel. If that happens, the ETF is likely to find at least temporary support at the 50-day simple moving average.
- The SPY has resistance above at the all-time high of $524.61 and at the psychologically important $525 mark. The ETF has support below at $517.29 and at $510.13.

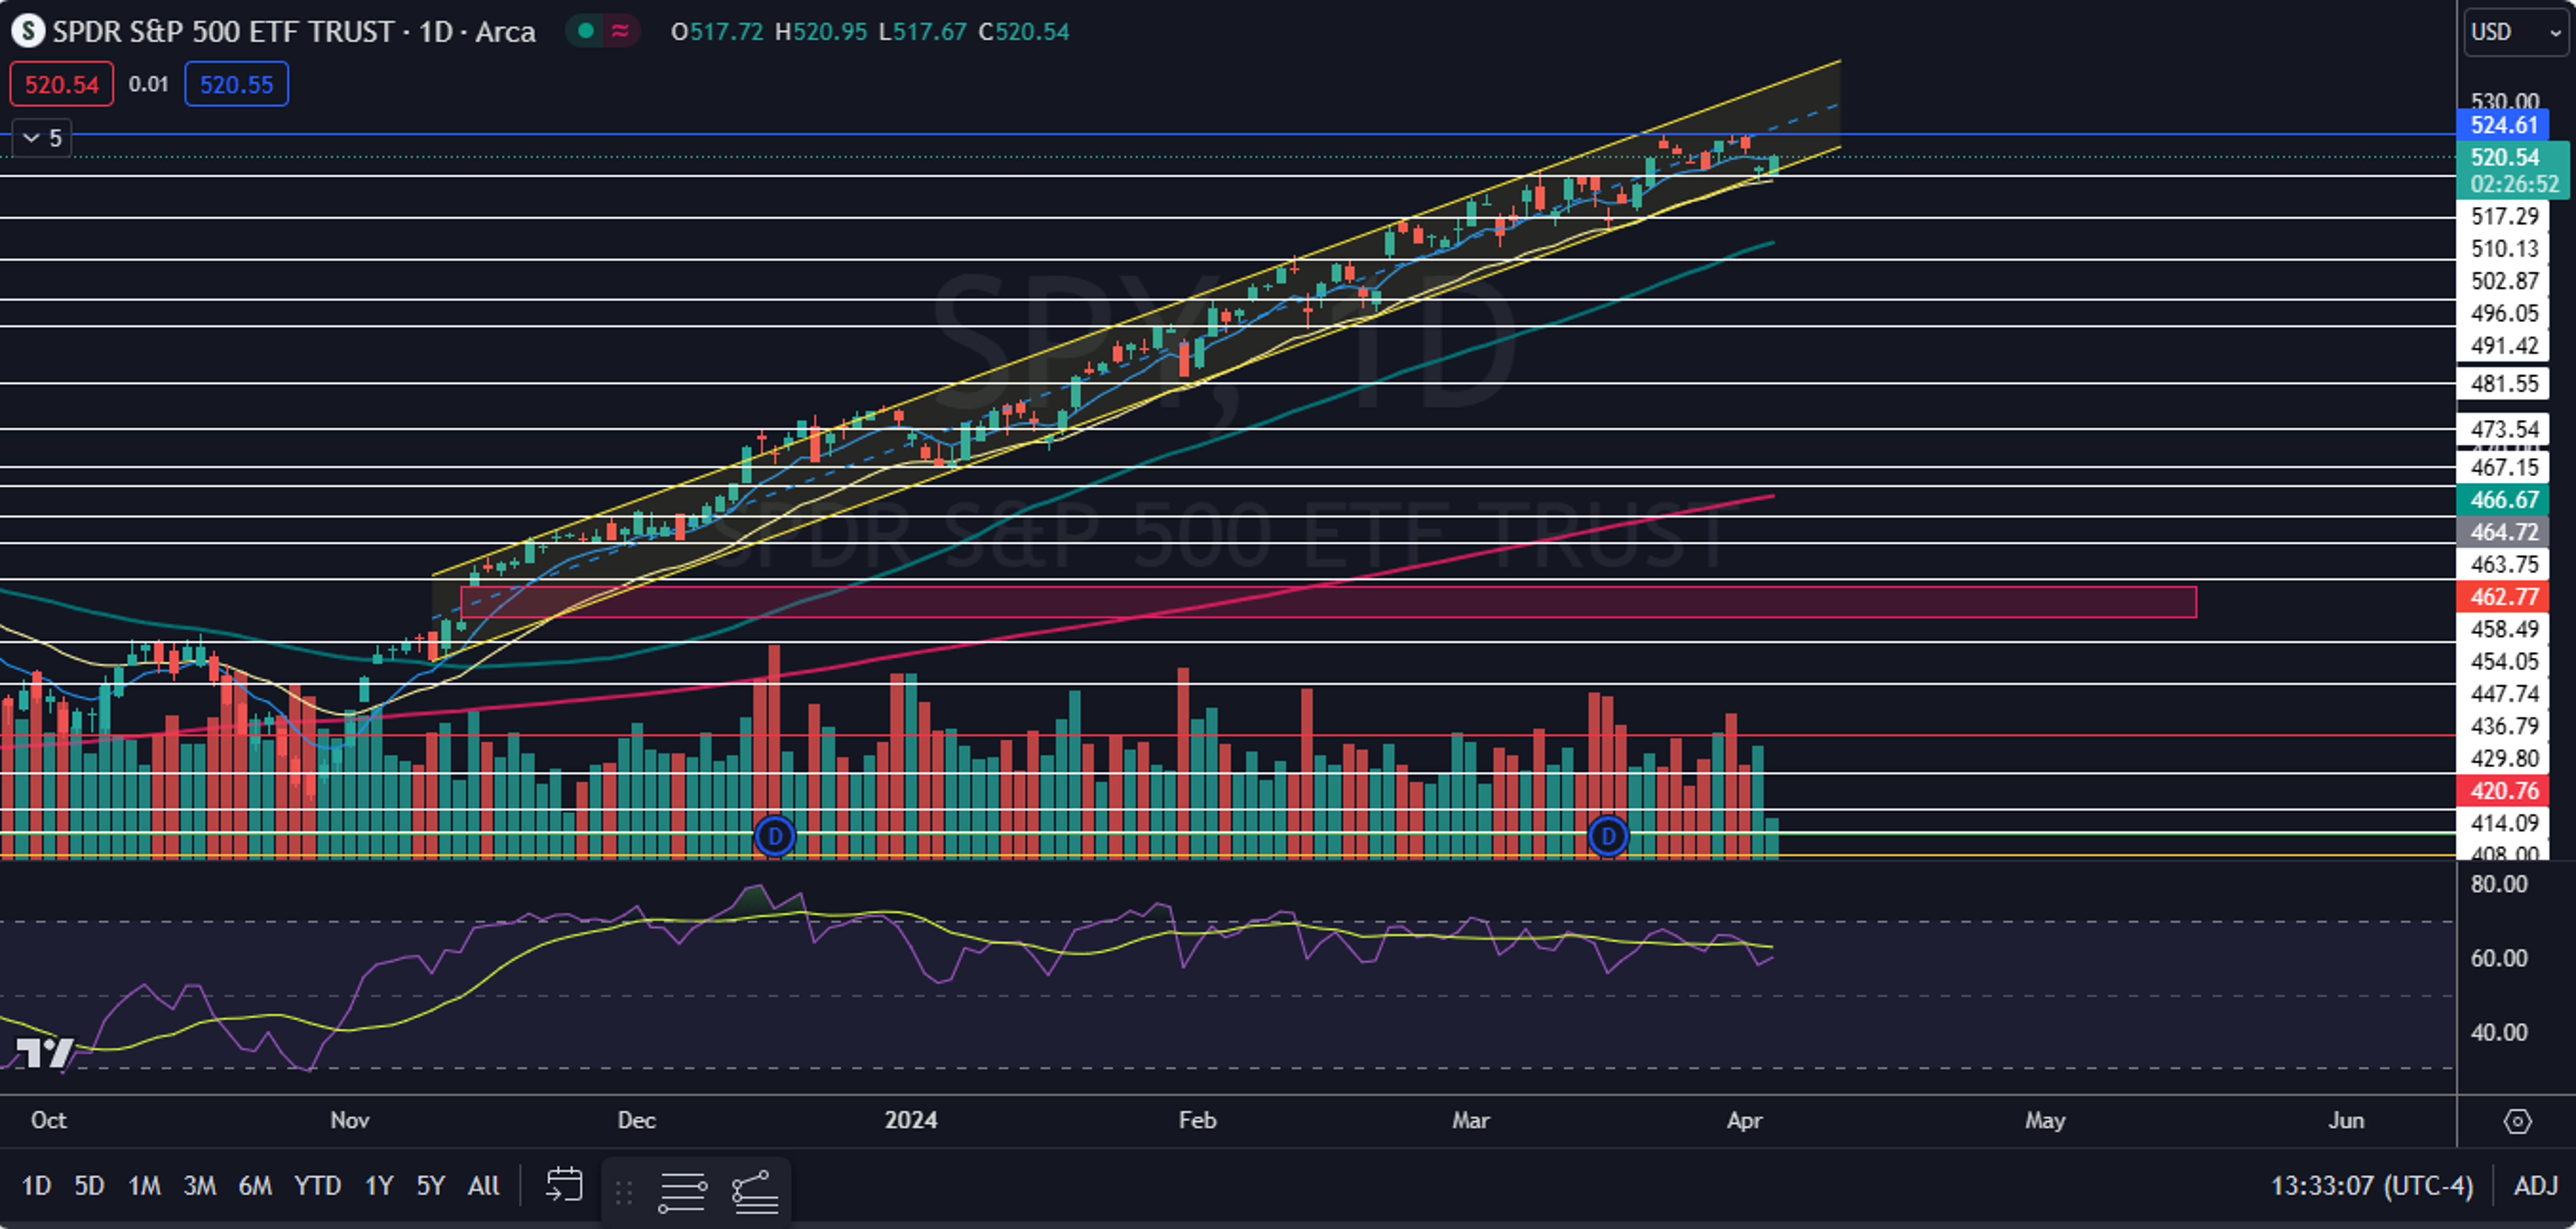
Image sourced from Shutterstock
Edge Rankings
Price Trend
© 2025 Benzinga.com. Benzinga does not provide investment advice. All rights reserved.
Trade confidently with insights and alerts from analyst ratings, free reports and breaking news that affects the stocks you care about.

