That was fun wasn’t it? S&Ps lost a cool 13% since the last week of 2015. You think that’s a lot? Emerging Markets lost 16% during that period. The Russell 2000 Small-cap Index lost over 17%. Micro-caps lost over 18%. 13 is nothing. And get used to it, because I think there is a lot more selling coming.
Today, we’re going to focus on what the S&P 500 (INDEXSP:.INX) looks like because that is what all of you keep asking me about. I like to look at stock markets from a more global perspective, taking into account what other asset classes are doing like commodities, currencies and interest rates. Remember, I’m in the weight-of-the-evidence business. I believe that in order to navigate through what is a constantly evolving global marketplace, taking the weight-of-the-evidence is the best approach. But today, we’ll take a deep dive look at S&Ps on their own.
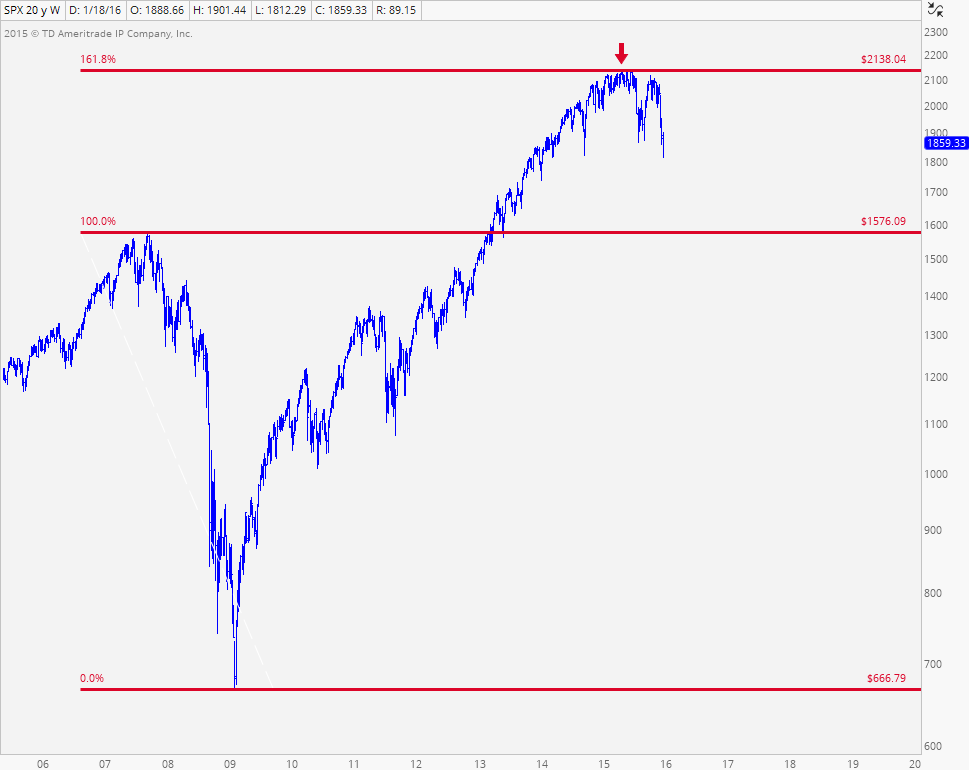
The first chart is one that I’ve shown you guys, I don’t know, about 1000 times over the past year. It shows S&Ps running into the 161.8% Fibonacci extension of the entire 2007-2009 decline. This has suggested to us since last May that there was no reason to be long the U.S. Stock Market from any kind of long-term horizon:
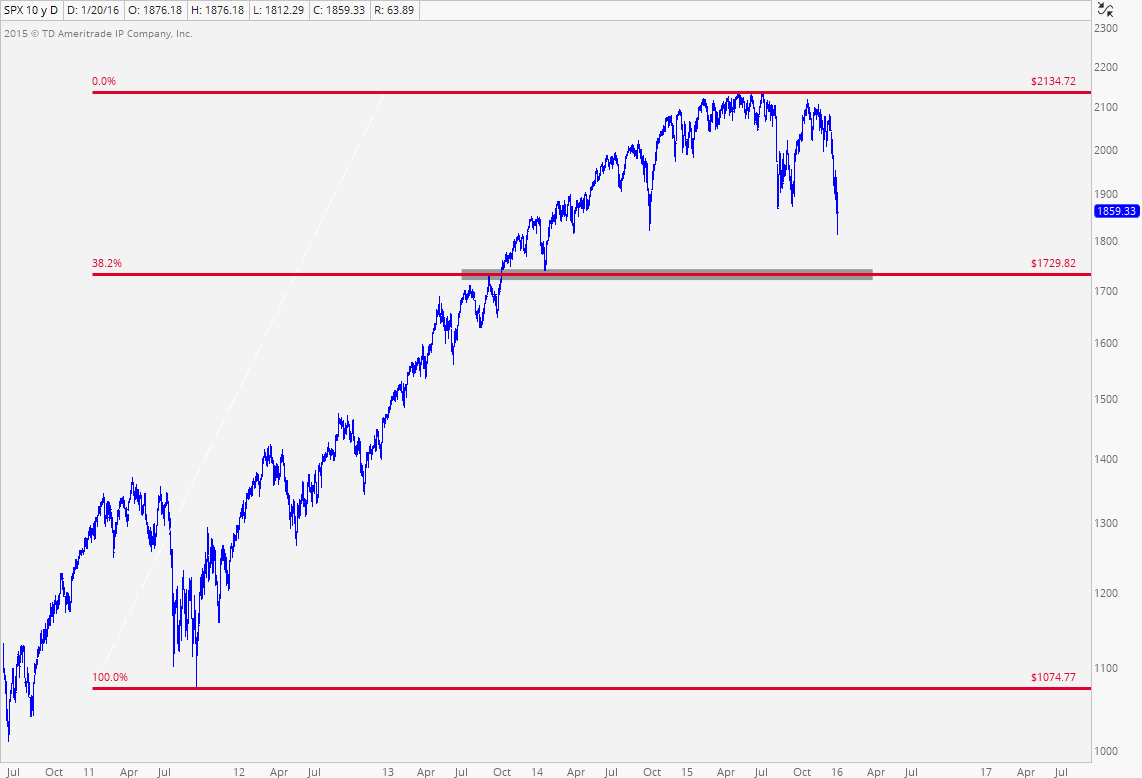
Looking at things from a more intermediate-term perspective, remember at All Star Charts we like to look out weeks and months for execution purposes, we are looking at that 1730-1740 level as a big target. This represents former resistance levels in September of 2013 that turned into support during the early 2014 correction. In addition, this is also the 38.2% Fibonacci retracement of the 2011-2015 rally:
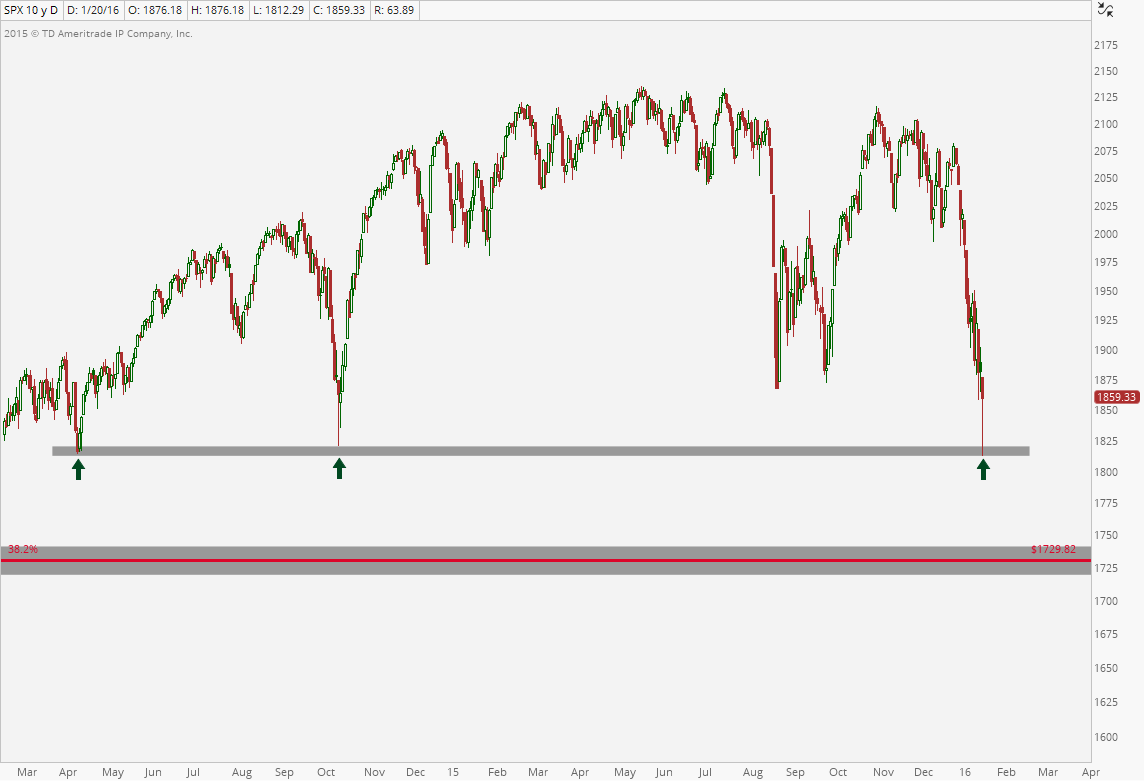
We have been very happy to see the selling to start the new year, but moving forward risk management is priority number 1, always will be. Prices this week hit the lows from April and October of 2014. We had a nice bounce from that price, which is a logical area for a bounce to commence:
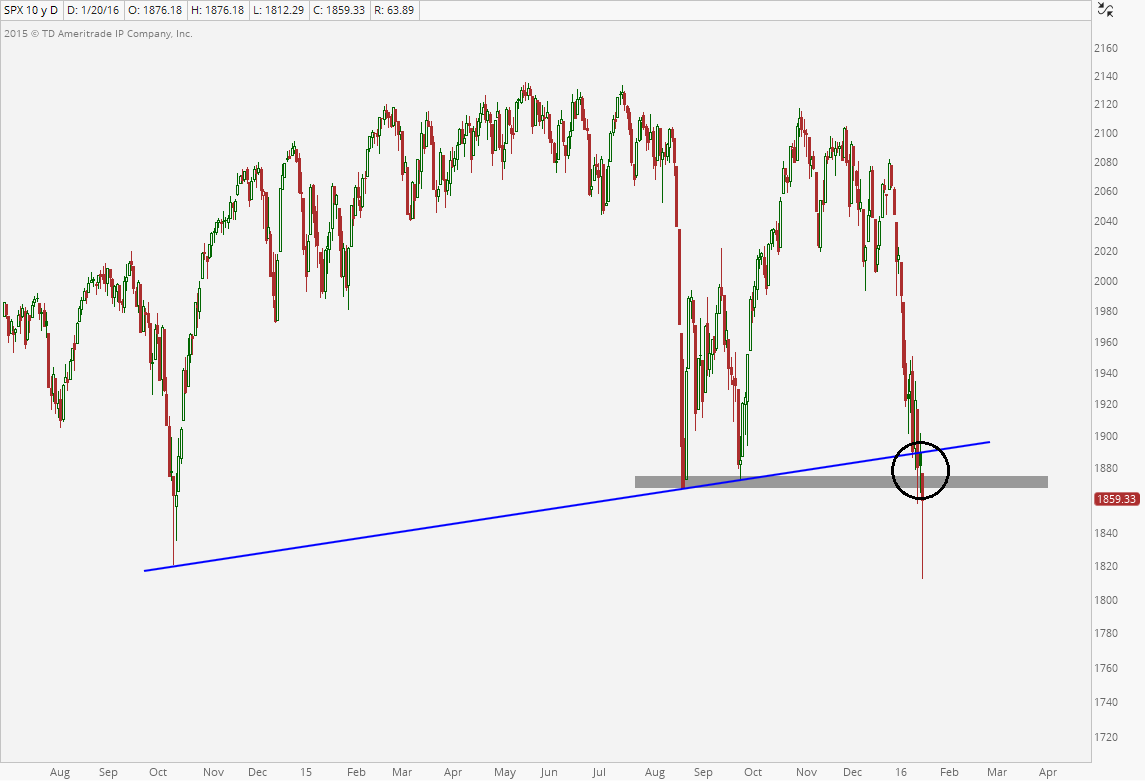
Now, moving forward we want to be watching the 1870-1890 level very closely for risk management purposes. This area was support in August/September last year and also represents, what is now, the broken uptrend line from the October 2014 lows. I would not be short the U.S. Stock Market if prices are above those levels:
That is a more tactical perspective, just looking at things short-term. Bigger picture, the weight-of-the-evidence is suggesting that we are heading a lot lower. An expansion in new 52-week lows on the NYSE this week (compared to August sell-off), a structural completion of a major top in Small-caps vs Large-caps, a rollover in the multi-year bull market in Growth vs Value stocks, all of the major U.S. Stock Averages below downward sloping 200 day simple moving averages, relative leadership out of defensive sectors, and continued underperformance from global equities are just some of the factors contributing to this conclusion.
Momentum is a huge factor. A 14-day RSI is our momentum oscillator of choice, and we want to see it make a higher low, while prices put in lower lows. That is what we call a bullish divergence and what we are waiting for before getting aggressively long this market for a counter-trend rally. So far we are still seeing lower lows in momentum confirming the new 52-week lows in price, both on an intraday and closing basis.
Again, I do not see any reason to be short S&Ps if we’re above 1890. A rally there can lead to a squeeze towards 1980, which was support in late 2014 & early 2015, and the resistance this September. I don’t want to get ahead of myself, because we are still making new lows below 1890, but something to keep in mind.
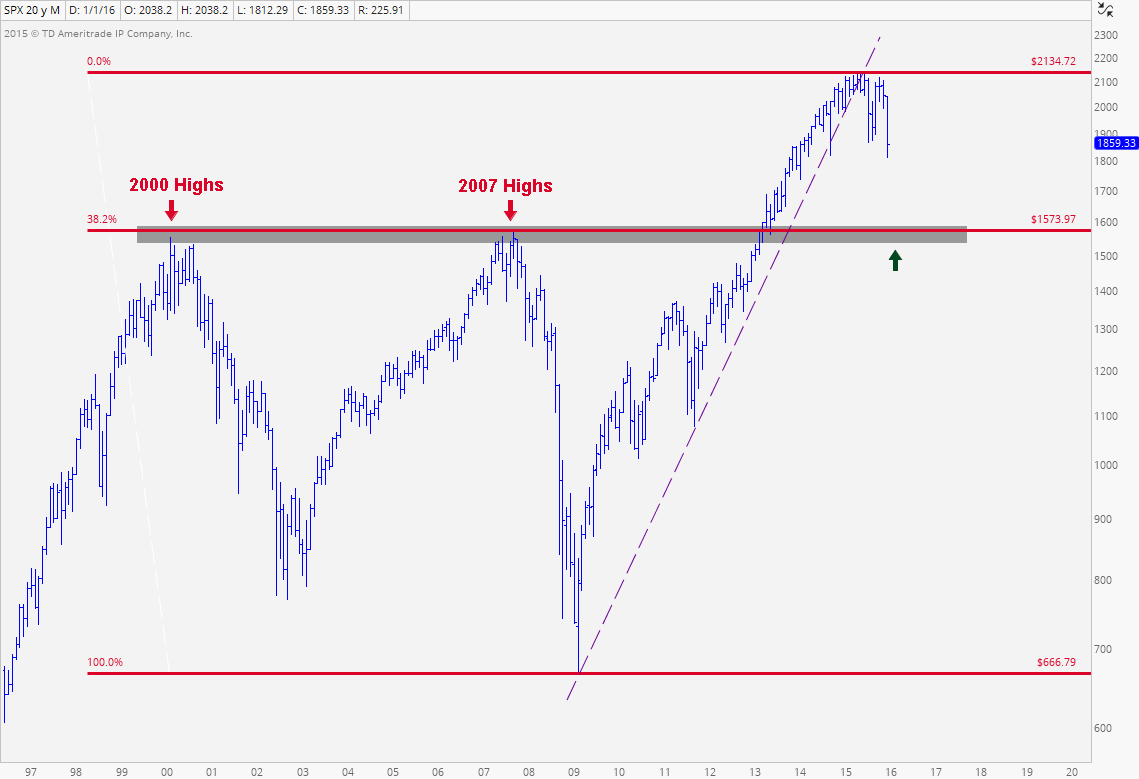
Bigger picture, when all is said and done, I still think S&Ps see a 15 handle and fall below 1600. This represents the former highs from 2000 and 2007 as well the 38.2% Fibonacci retracement of the entire 2009-2015 rally. This represents a 25% from top to bottom and a perfectly normal correction after a 220% rally in 6 years:
To me, it’s really that simple.
What are you guys seeing? Did I miss anything?
This was originally shared at All Star Charts
© 2024 Benzinga.com. Benzinga does not provide investment advice. All rights reserved.
Comments
Trade confidently with insights and alerts from analyst ratings, free reports and breaking news that affects the stocks you care about.

