

Zinger Key Points
- Broadcom's AI Infrastructure Day has been fueling its recent stock surge, highlighting its AI-driven growth trajectory.
- Technical analysis shows strong bullish momentum, with key levels indicating potential further upside for Broadcom investors.
- Get access to the leaderboards pointing to tomorrow’s biggest stock movers.
Broadcom Inc. AVGO has been in the spotlight recently, with its stock gaining further momentum following its Enabling AI Infrastructure Day on March 20. The company expects to generate $10 billion in artificial intelligence (AI) chip sales this year, highlighting its commitment to AI infrastructure innovations.
The stock gained 10% in the week immediately following the event. On a year-to-date basis, Broadcom stock has returned over 19% to investors already. The past year has seen Broadcom stride by a whopping 113.47%.
The chipmaker’s announcement of a new customer in the AI consumer space and positive analyst ratings and upgrades following the event, have further fueled investor interest. As investors assess the stock’s potential, technical analysis sheds light on key levels to watch.
Broadcom Stock Analyst Ratings
Wall Street analysts reacted positively to Broadcom’s recent announcements. Analyst ratings released from Benchmark, JPMorgan, and Rosenblatt on March 21, imply an average price target of $1640 for Broadcom stock. This implies an average upside of 19.60% from current price levels.
Let’s look at technical signals for validation.

Technical Analysis
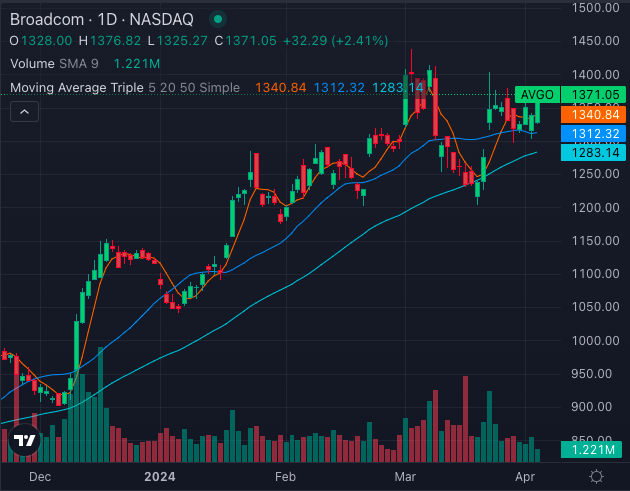
- Since forming a golden cross in December last year, Broadcom’s stock price has trended sharply higher, with occasional retracements to the 50-day moving average.
- The recent pullback to the indicator saw buyers stepping in, indicating bullish momentum.
- The current trend is strongly bullish, supported by buying pressure and the stock’s position above its 5, 20, and 50-day moving averages.
Related: Broadcom Stock Hits All-Time High: Golden Cross Hints At Further Upside
Key Levels to Watch
- Investors should closely monitor how the stock responds to its all-time high of $1,438.17 set on March 4. A breakout above this level backed by strong volume could signal further upside.
- Conversely, a reversal at the all-time high could trigger profit-taking and a potential pullback.
Other Technical Analysis Insights
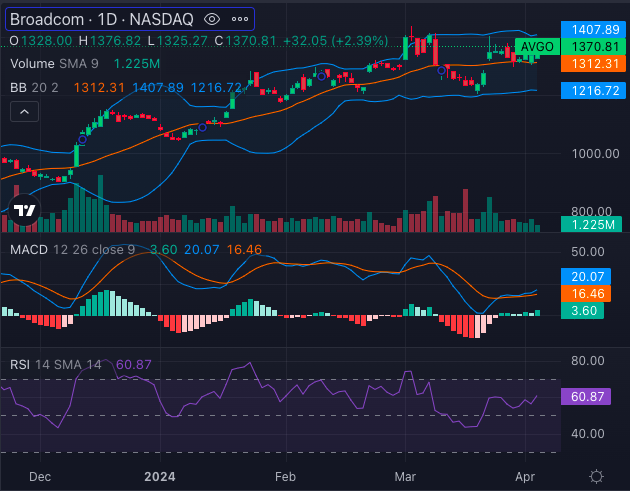
- The Moving Average Convergence Divergence (MACD) indicator suggests a bullish signal, with a value of 20.07.
- Broadcom’s Relative Strength Index (RSI) is 60.87, indicating the stock is overbought but still showing strength.
- The Bollinger Bands suggest a bullish signal, with the stock’s current price well within the upper band.
With positive momentum and key levels in focus, investors eagerly anticipate Broadcom’s next moves in the dynamic AI landscape.
Image: Dennis Diatel, Shutterstock
Edge Rankings
Price Trend
© 2025 Benzinga.com. Benzinga does not provide investment advice. All rights reserved.
date | ticker | name | Price Target | Upside/Downside | Recommendation | Firm |
|---|
Trade confidently with insights and alerts from analyst ratings, free reports and breaking news that affects the stocks you care about.

