Commodities – Energy
Crude Oil Chart Setup Calls for Losses
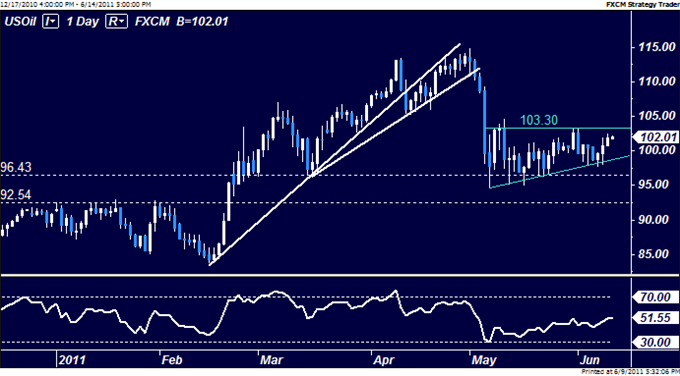
WTI Crude Oil (NY Close): $101.93 // +1.19 // +1.18%
As we suspected, crude prices re-coupled with the overall trends in investors' risk appetite and followed the S&P 500 higher on Thursday. Notably, the move higher remained within the context of the larger bearish setup we have monitored for several weeks. Indeed, so long as a daily close above $103.30 does not materialize, the current setup presents a continuation triangle chart formation that argues for a resumption of the down move initiated on May 2nd following a period of consolidation. A break through support at the triangle bottom initially exposes supports at $96.43 and $92.54.
Commodities – Metals
Gold, Silver Standstill Continues
Spot Gold (NY Close): $1544.10 // +6.45 // +0.42%
Broadly speaking, gold prices remain at a standstill between$1533.12 and $1549.91, the 61.8% and 76.4% Fibonacci retracements of the drop from the May 2 high, respectively. As we discussed in our weekly forecast, this apparent indecision reflects lingering uncertainty about gold's place in today's bipolar marketplace, where most assets are clearly established on the “risky” or “safe-haven” side of the spectrum.
Ultimately, as we noted yesterday: “the key question at this point is whether the bearish cues now apparent in S&P 500 positioning owe to the unwinding of Dollar-funded positions as QE2 expires (a gold-negative scenario) or to a dour outlook on US economic growth (a gold-positive scenario).” Interestingly, once gold invariably chooses a directional bias, this is likely to inform our understanding of how the market gauging the key drivers of risk appetite, yielding welcome insights into the behavior of a multitude of asset classes.

Spot Silver (NY Close): $37.56 // +0.73 // +1.98%
As with gold, silver is finding it difficult to find its place in the current market environment. Technically speaking, a triangle continuation pattern is taking shape below the 38.2% Fibonacci retracement of the drop the late April high at $38.88, with the preceding decline arguing for renewed selling ahead. Initial support lines up at $36.37, the 23.6% Fib, followed by the triangle's lower boundary as well as the minor 14.6% retracement level at $34.83. A daily close below the latter boundary exposes the May 12 low at $32.32.

For real time news and analysis, please visit http://www.dailyfx.com/real_time_news
To receive future articles by email, please contact Ilya at ispivak@dailyfx.com
© 2024 Benzinga.com. Benzinga does not provide investment advice. All rights reserved.
Comments
Trade confidently with insights and alerts from analyst ratings, free reports and breaking news that affects the stocks you care about.

