Zinger Key Points
- Nvidia shares drop 12.88% over three days, reflecting profit-taking after a strong year-to-date performance.
- Despite the decline, Nvidia's Q1 2024 earnings and forward guidance remain strong, indicating solid demand.
- Live on Wednesday June 18: 3 Summer "Power Patterns" Are About to Trigger (One With 90% Win Rate). See Them Here.
Shares of Nvidia Corp NVDA have taken a significant hit, dropping 12.8% in just three trading days.
The stock closed at $135.58 on June 18, only to fall to $118.11 by June 24. This sharp decline has raised eyebrows among investors, especially given the broader market’s relatively stable performance, with the S&P 500 index-tracking SPDR S&P 500 ETF SPY closing at $548.49 and $542.74, respectively, on those dates. That’s a drop of just 1.048% over the three trading days.
Nvidia Down Over 12% On Profit Taking
Despite the pullback, Nvidia’s fundamentals remain strong. The company’s Q1 2024 earnings exceeded Wall Street’s expectations, driven by strong performance in its data center and automotive segments. Nvidia’s forward revenue guidance remains robust, indicating sustained demand for its AI solutions even amid broader market headwinds.
Given no fundamental or news-related cause for the stock’s recent slide, Wall Street watchers are suggesting it could be profit taking by Nvidia stock investors, given Nvidia recently became the most valuable public company.
Related: Microsoft, Apple Step Aside: Nvidia Is Now The Most Valuable Public Company In The World
Hence, the significant price drop could be seen as a buying opportunity for a high-quality stock like Nvidia.
Let’s delve into the technical indicators to understand the current trend and potential future movements of Nvidia stock.
Nvidia Stock Chart – Near-Term Weakness, Solid Long-Term Strength
- Current Trend: Moderately bearish, with Nvidia stock experiencing selling pressure, indicating a risk of further bearish movement.

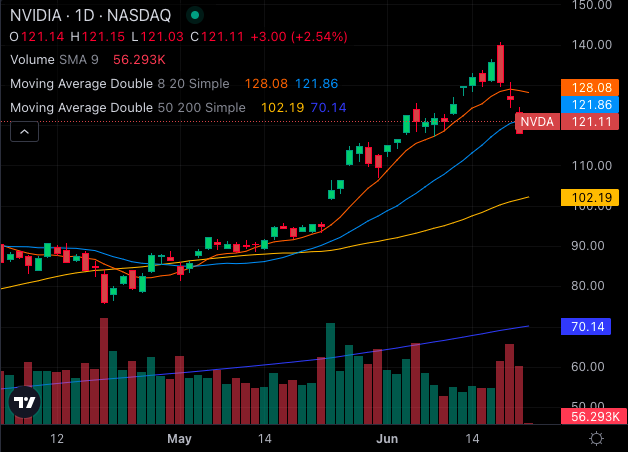
- 8-Day Simple Moving Average (SMA): NVDA is at $121.11, below its 8-day SMA of $128.08, signaling a bearish trend.
- 20-Day SMA: The stock is at $121.11, just below the 20-day SMA of $121.86, also a bearish indicator.
- 50-Day SMA: NVDA at $121.11 is above its 50-day SMA of $102.19, suggesting a bullish outlook in the medium term.
- 200-Day SMA: NVDA is significantly above its 200-day SMA of $70.14, creating a bullish signal in the long term.
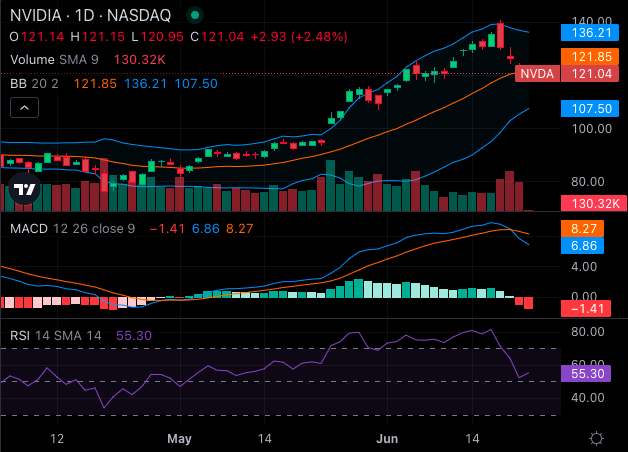
- MACD Indicator: At 6.86, the MACD suggests bullish momentum.
- Relative Strength Index (RSI): At 55.41, NVDA is neither overbought nor oversold.
- Bollinger Bands (20): The bands range from $107.50 to $136.21, indicating that NVDA is within a bollinger bands’ range and trading in the upper bullish band.
While the recent downtrend and technical indicators suggest caution in the short term, Nvidia’s strong fundamentals and long-term bullish signals present a compelling case for investors considering buying the dip.
Will the slide continue, or is this a prime buying opportunity? Only time will tell, but Nvidia’s robust position in the market and its impressive track record suggest it remains a stock to watch closely.
Read Next:
Photo: Shutterstock
Edge Rankings
Price Trend
© 2025 Benzinga.com. Benzinga does not provide investment advice. All rights reserved.
Trade confidently with insights and alerts from analyst ratings, free reports and breaking news that affects the stocks you care about.