Digital World Acquisition Corp DWAC, the SPAC merging with Trump Media & Technology Group, was trading slightly higher on Thursday in a strong uptrend. An uptrend occurs when a stock consistently makes a series of higher highs and higher lows on the chart.
The higher highs indicate the bulls are in control while the intermittent higher lows indicate consolidation periods. Traders can use moving averages to help identify an uptrend with rising lower timeframe moving averages (such as the eight-day or 21-day exponential moving averages) indicating the stock is in a steep shorter-term uptrend and rising longer-term moving averages (such as the 200-day simple moving average) indicating a long-term uptrend.
A stock often signals when the higher high is in by printing a reversal candlestick such as a doji, bearish engulfing or hanging man candlestick. Likewise, the higher low could be signaled when a doji, morning star or hammer candlestick is printed. Moreover, the higher highs and higher lows often take place at resistance and support levels.
In an uptrend the "trend is your friend" until it’s not and in an uptrend there are ways for both bullish and bearish traders to participate in the stock:
- Bullish traders who are already holding a position in a stock can feel confident the uptrend will continue unless the stock makes a lower low. Traders looking to take a position in a stock trading in an uptrend can usually find the safest entry on the higher low.
- Bearish traders can enter the trade on the higher high and exit on the pullback. These traders can also enter when the uptrend breaks and the stock makes a lower low indicating a reversal into a downtrend may be in the cards.
See Also: See How This Trader Used Benzinga Pro For Winning Trades On Phunware And Camber Energy
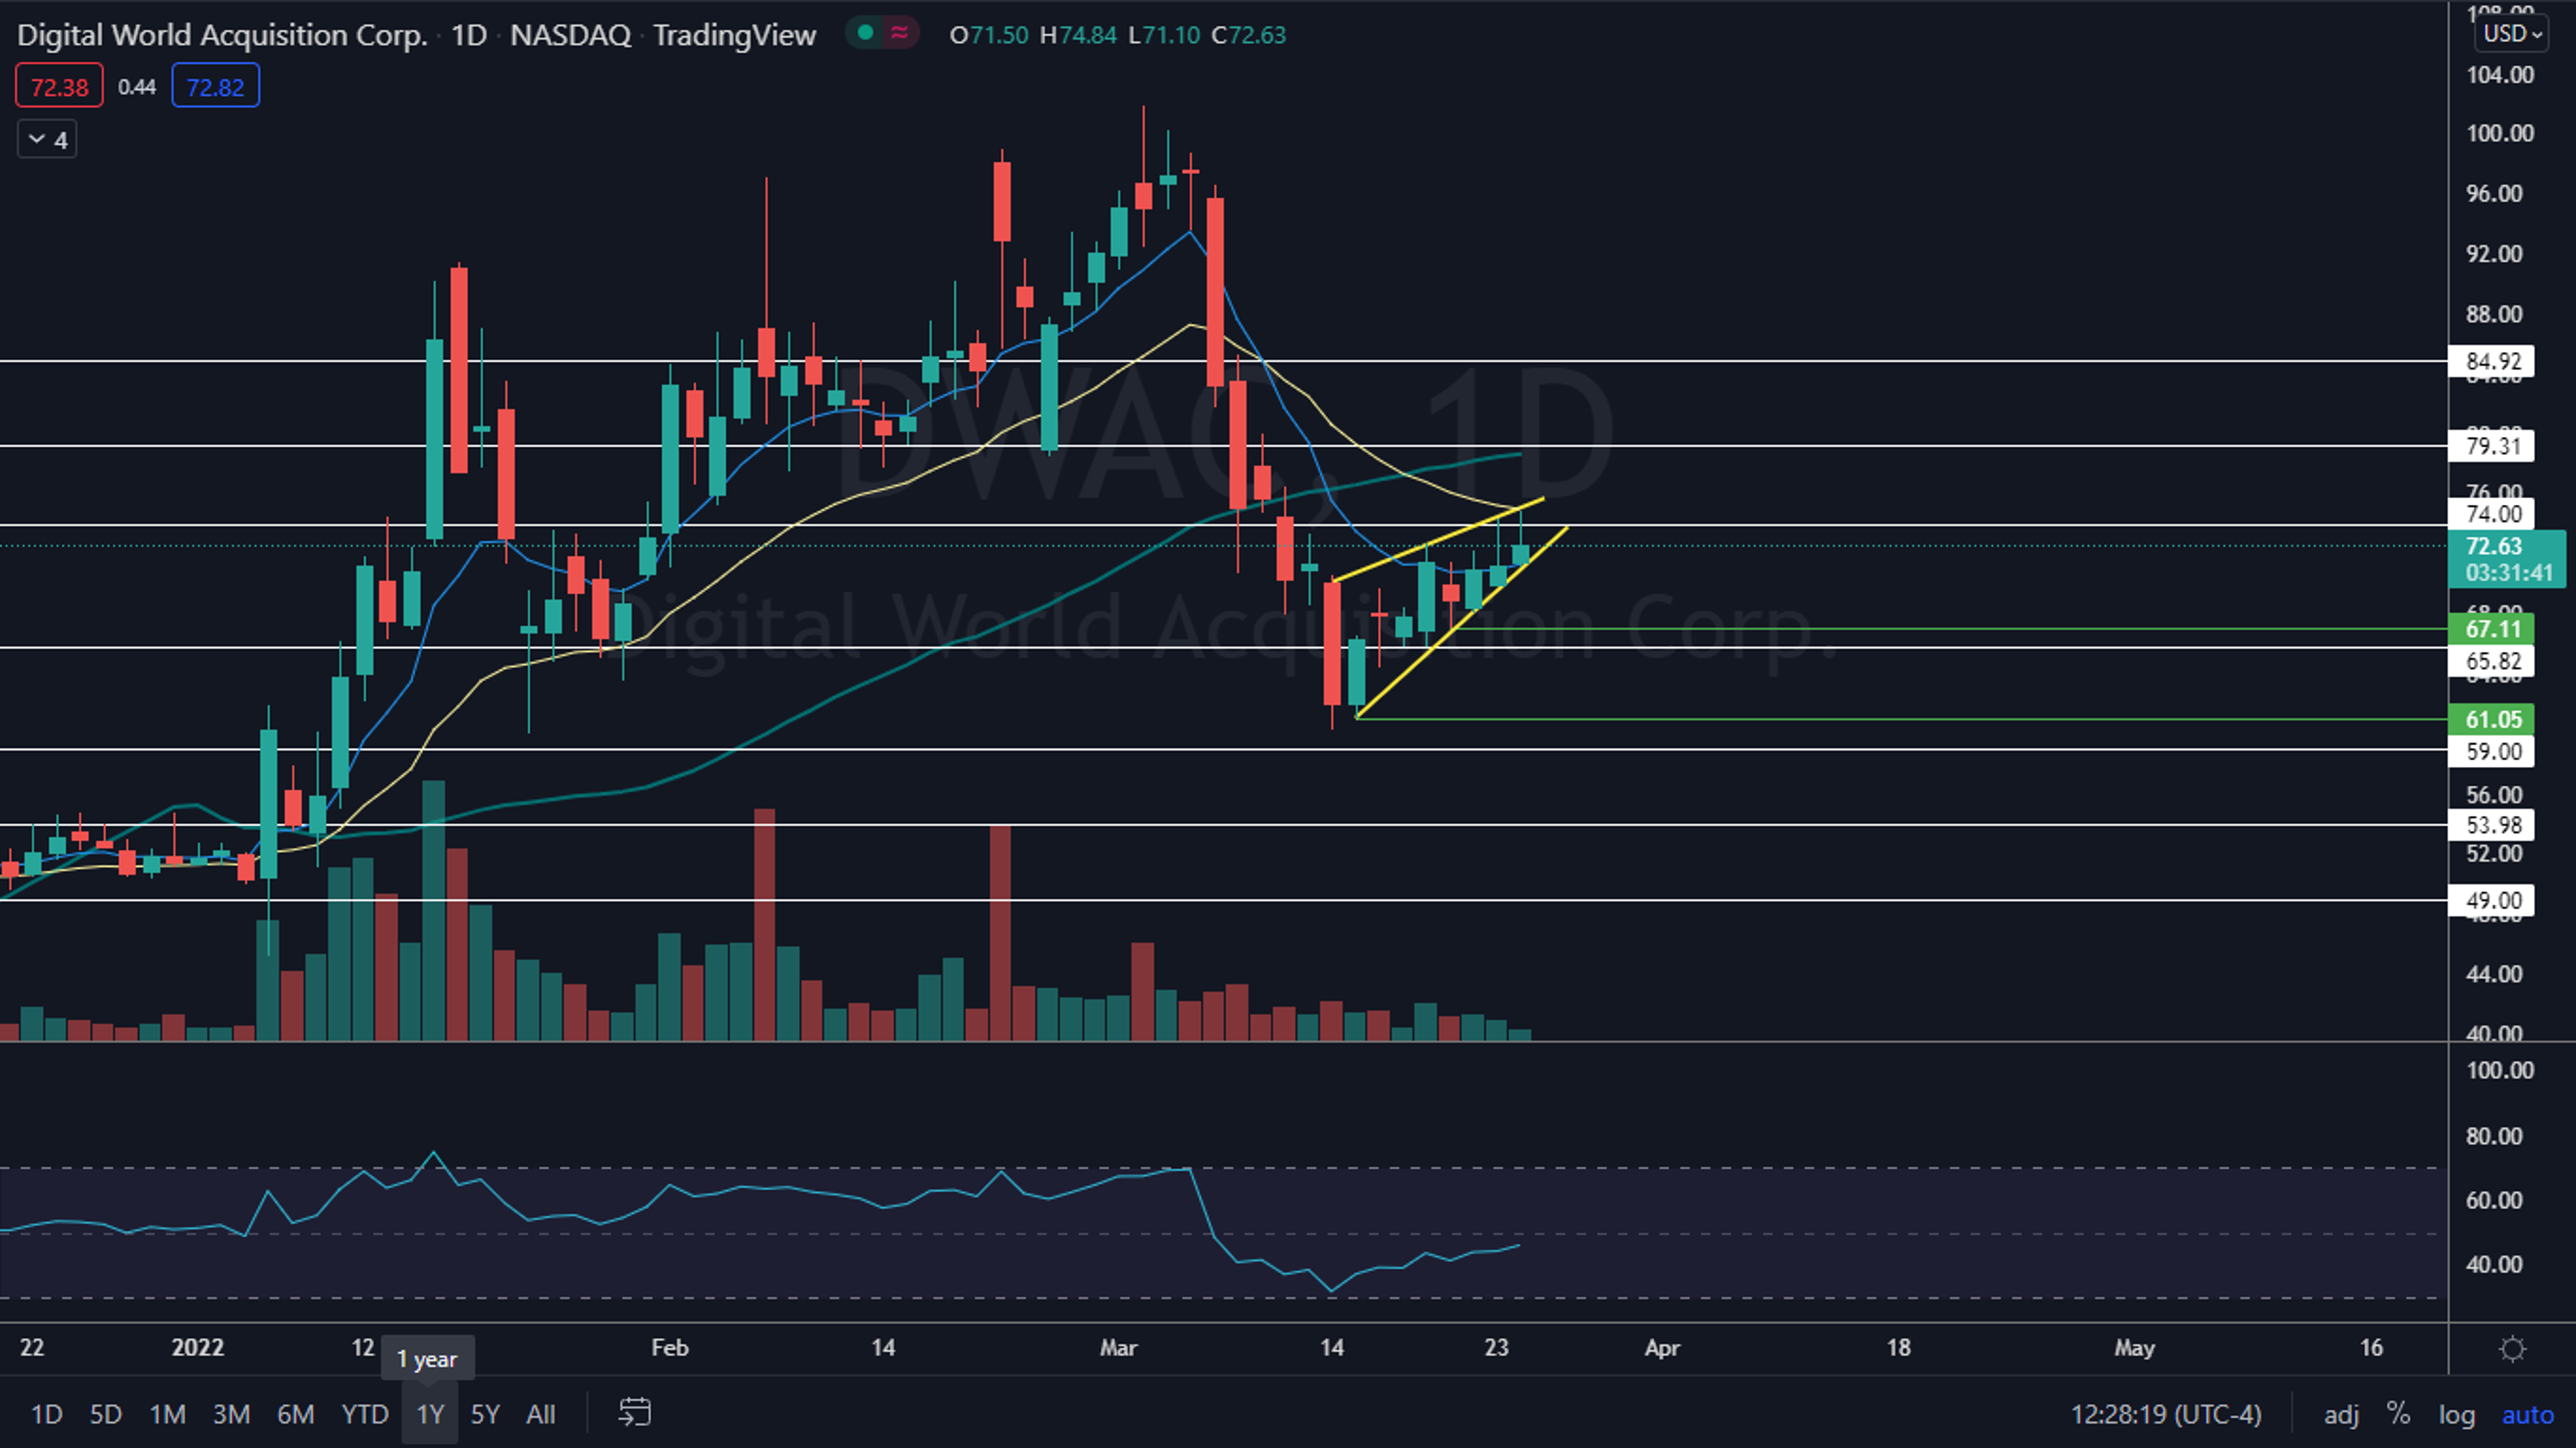
The Digital World Chart: Digital World reversed into an uptrend on March 15 just above the $61 level and has since made a consistent series of higher highs and higher lows, with the most recent higher high printed on Thursday at $74.84 and the most recent higher low created at the $67.11 mark on March 21.
- On Thursday, Digital World attempted to regain support at the 21-day exponential moving average (EMA) but rejected and wicked from the level. The stock then found support at the eight-day EMA.
- Bullish traders want to see Digital World regain support at the 21-day EMA and trade above the level for a period of time, which will cause the eight-day EMA to cross above the 21-day and would be bullish.
- The stock has also settled itself into an ascending wedge and traders and investors can watch for a break up or down from the pattern to gauge future direction. The wedge leans bearish because the two most recent candlesticks have long upper wicks.
- Due to the eight-day EMA holding as support, Digital World looks to have avoided a bear flag pattern on the daily chart, but on the weekly chart a bear flag is potentially being formed. If the stock breaks down from the ascending trendline of the wedge on higher-than-average bearish volume, the bear flag has been recognized and the stock could fall about 40%, which is the measured move of a break from the pattern.
- Digital World has resistance above at $74 and $79.31 and support below at $65.82 and $59.
Want direct analysis? Find me in the BZ Pro lounge! Click here for a free trial.

© 2025 Benzinga.com. Benzinga does not provide investment advice. All rights reserved.
Trade confidently with insights and alerts from analyst ratings, free reports and breaking news that affects the stocks you care about.

