


Snap, Inc SNAP was trading higher on Thursday morning in tandem with the SPDR S&P 500 SPY, which was reversing course to the upside after a bearish reaction to the Federal Reserve’s comments on Wednesday caused the ETF to lose its intraday gains.
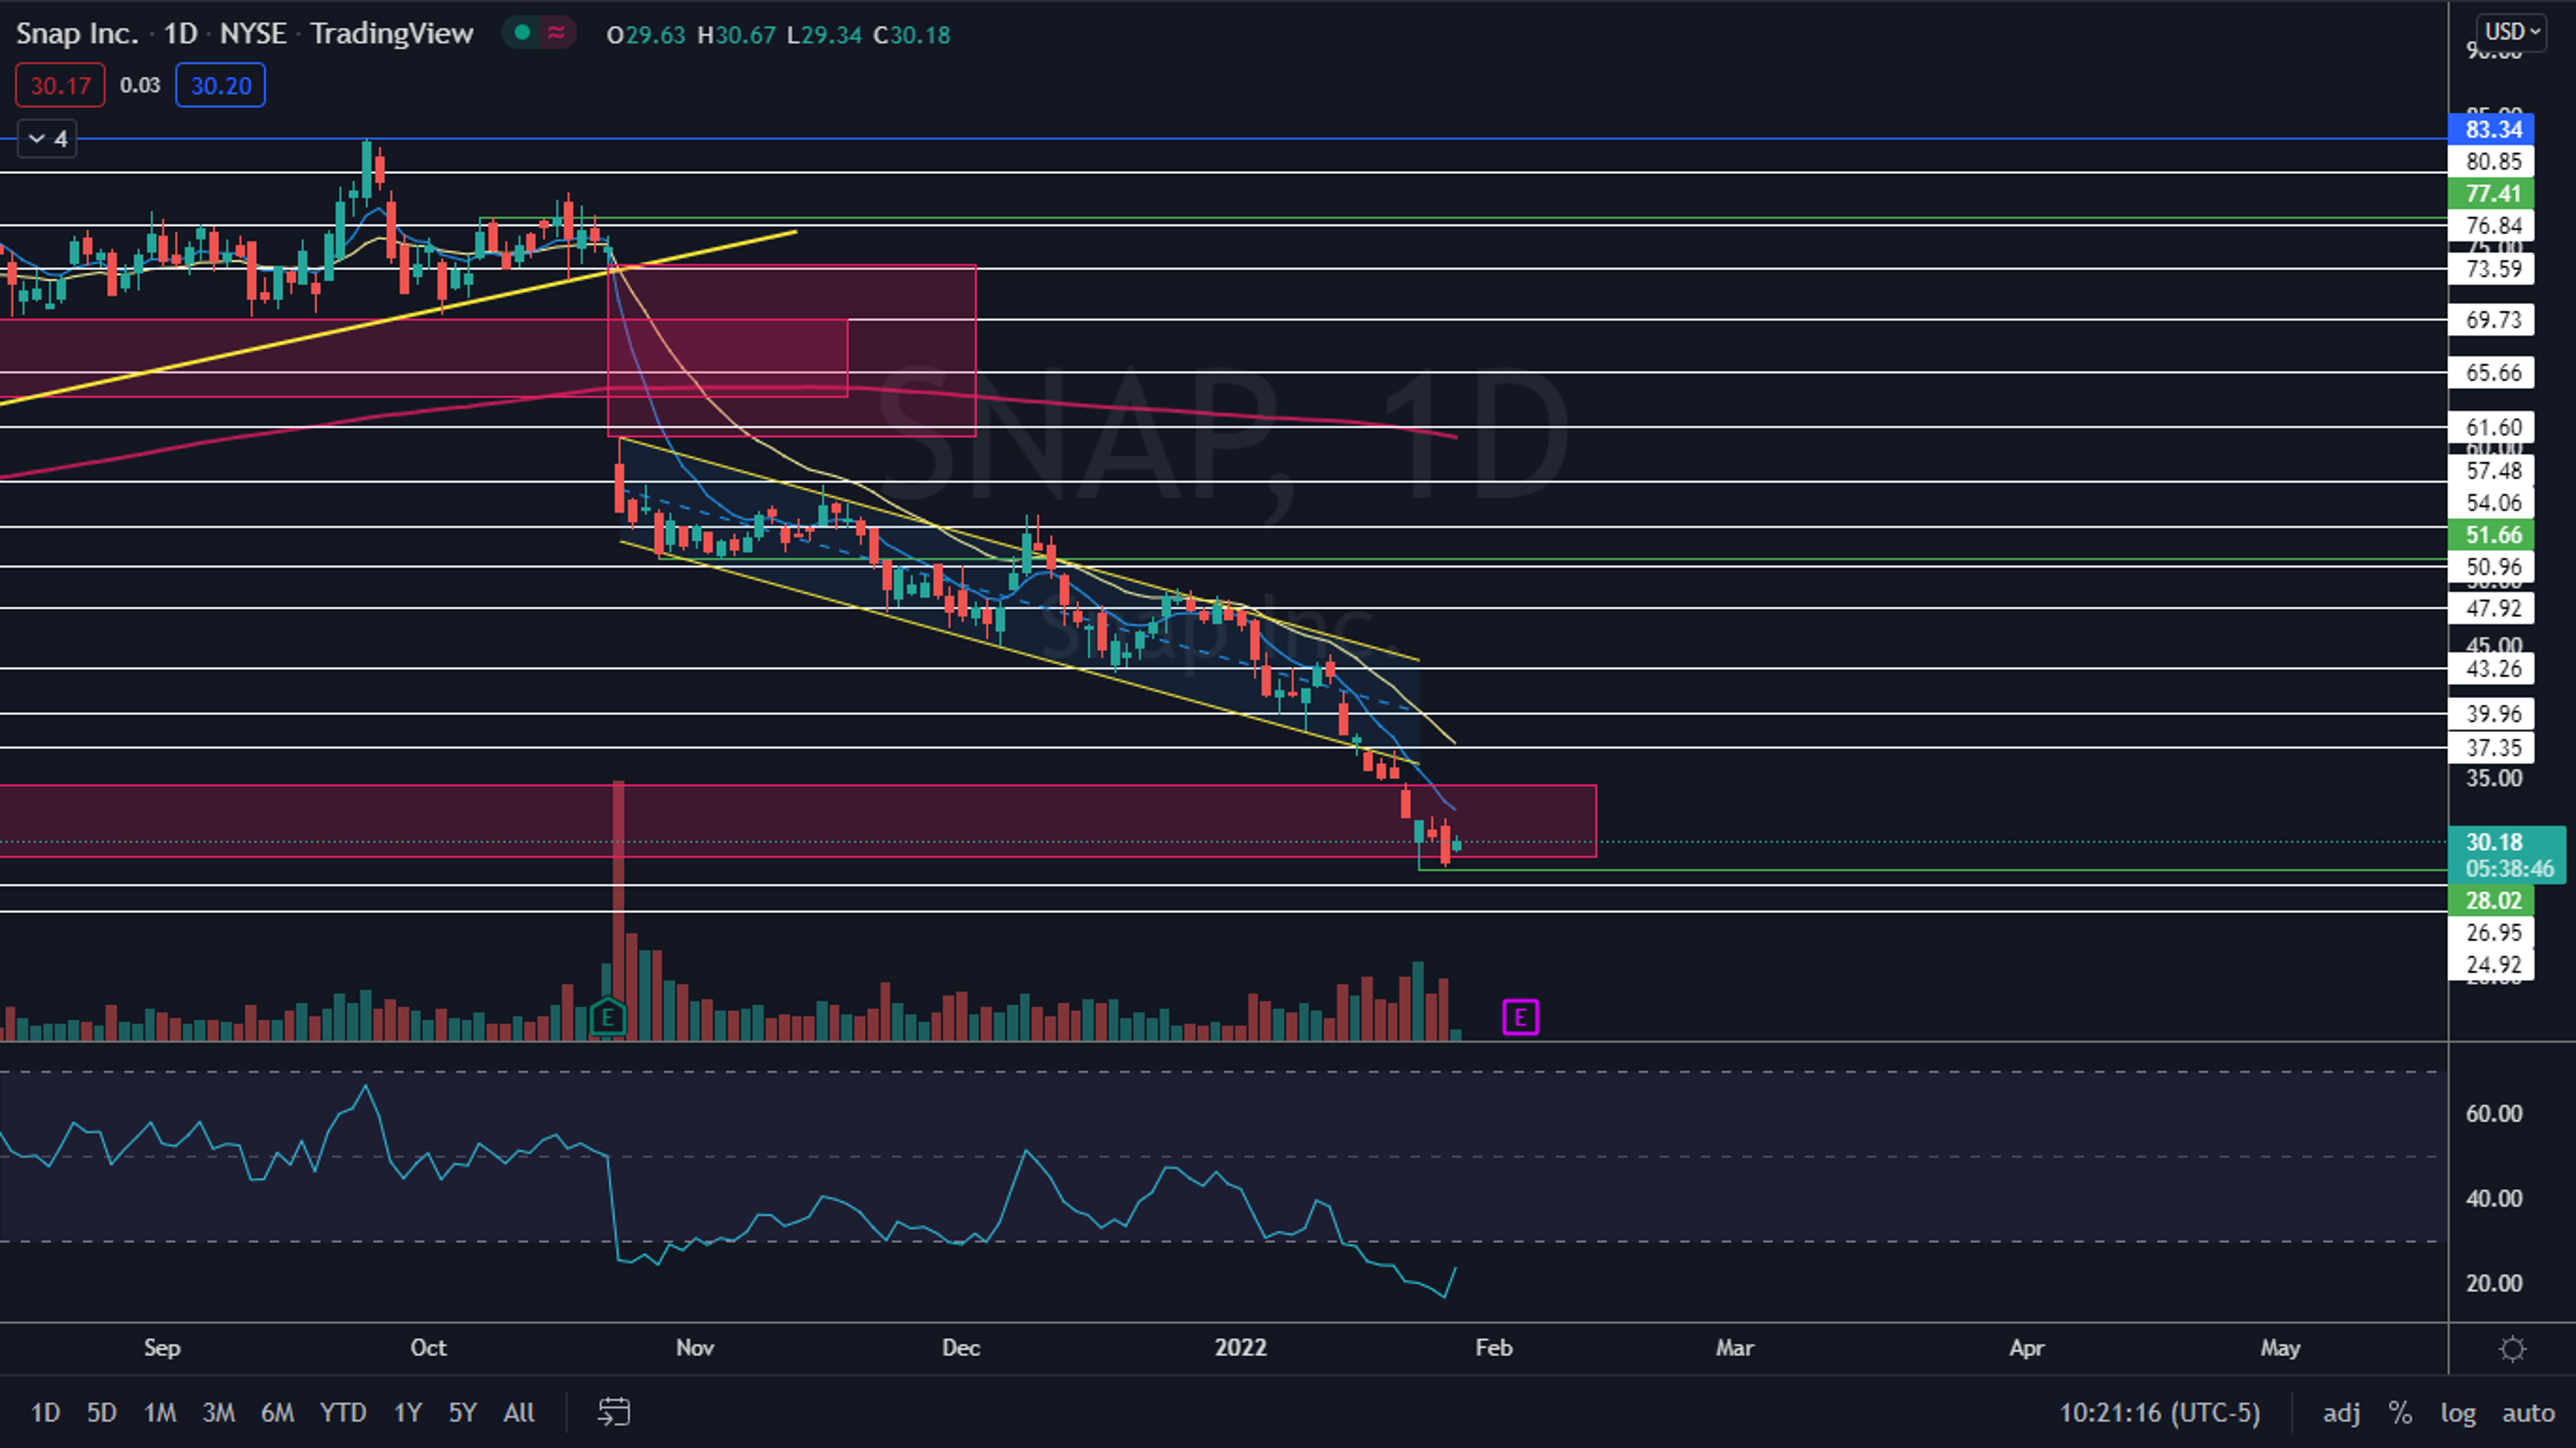
Snap has been trading in a steep downtrend, losing 63% of its value since Sept. 24, when the social media stock hit an all-time high of $83.34.
On Feb. 3 after the market closes, Snap is expected to print its fourth-quarter and full fiscal year 2021 earnings results. After Snap printed its third-quarter results on Oct. 21, the stock gapped down over 15% the following day despite beating analyst estimates.
On Jan. 24, Wedbush analyst Ygal Arounian downgraded Snap shares from Outperform to Neutral and reduced the price target from $56 to $36 due to a number of growth risks the firm sees for the social media company as well as increasing competition from apps such as Tik Tok.
For bulls wanting to take a long-term position in Snap, it may be best to wait and see how the stock reacts to its earnings print first. Holding a position of a stock over earnings can be akin to gambling because stocks can rise following an earnings miss and fall in response to an earnings beat.
See Also: Fentanyl Deaths: Snapchat To Crack Down On Trafficking On The Platform, Seeking To Protect Minors
The Snap Chart: Snap has shown signs it may have found a bottom. On Monday and Wednesday, the stock bounced up from near the $28 level, which created a bullish double bottom pattern on the daily chart.
This week, the stock also filled a lower gap that was left behind on Oct. 21, 2020, which may give bulls more confidence going forward because gaps fill about 90% of the time.
There are two overlapping gaps above on Snap’s chart, which are also likely to fill at some point in the future. The gaps fall between the $60.78 and $73.89 range, and if Snap were to rise up to fill the gap completely, it would represent a 145% increase from the current share price.
On Wednesday, Snap was trading in an inside bar pattern, which in this case is neutral because the stock has been trading sideways. Both bulls and bears can watch for a break of the inside bar pattern on higher-than-average volume to gauge future direction.
Snap’s relative strength index (RSI) has been measuring in between 16% and 25% since Jan. 18. When a stock’s RSI falls below the 30% level it becomes oversold, which can be a buy signal for technical traders — although it should be noted the indicator can stay extended for long periods of time.
Snap is trading below the eight-day and 21-day exponential moving averages (EMAs), with the eight-day EMA trending below the 21-day, both of which are bearish indicators. The stock is also trading well below the 200-day simple moving average, which indicates long-term sentiment is bearish.
Snap is currently trading in a range with no price history and may need to trade sideways in order to create areas of support and resistance in the zone. The closest areas of resistance are at $37.35 and $39.96 and the closest support levels are at $26.95 and $24.92.

Edge Rankings
Price Trend
© 2025 Benzinga.com. Benzinga does not provide investment advice. All rights reserved.
Trade confidently with insights and alerts from analyst ratings, free reports and breaking news that affects the stocks you care about.

