


Zinger Key Points
- The SPY was attempting to break higher Friday despite economic data putting into question whether the Fed will drop rates.
- SPXL is a triple leveraged fund, which tracks movement in the S&P 500 Index.
- Get access to the leaderboards pointing to tomorrow’s biggest stock movers.
The SPDR S&P 500 SPY popped up about 0.5% higher at one point Friday, despite U.S. Bureau of Labor Statistics data showing non-farm payrolls came in higher-than-expected, which brought into question whether the Federal Reserve will follow through with a rate cut campaign next year.
While the news caused the SPY to open slightly lower, bulls came in and bought the dip, causing the market ETF to break above Thursday’s high-of-day.
Whether or not the market will continue higher imminently or continue to trade sideways remains to be seen, but the SPY’s uptrend is intact and the ETF is holding above the eight-day exponential moving average (EMA) on the daily chart.
More experienced traders who wish to play the SPY either bullishly or bearishly may choose to do so through one of two Direxion ETFs. Bullish traders can enter a short-term position in Direxion Daily S&P 500 Bull 3X Shares SPXL and bearish traders can trade the inverse ETF, Direxion Daily S&P 500 Bear 3X Shares SPXS.
The ETFs: SPXL and SPXS are triple leveraged funds that track the movement of the SPY, seeking a return of 300% or –300% on the return of the benchmark index over a single day.
It should be noted that leveraged ETFs are meant to be used as a trading vehicle as opposed to long-term investments.
Want direct analysis? Find me in the BZ Pro lounge! Click here for a free trial.
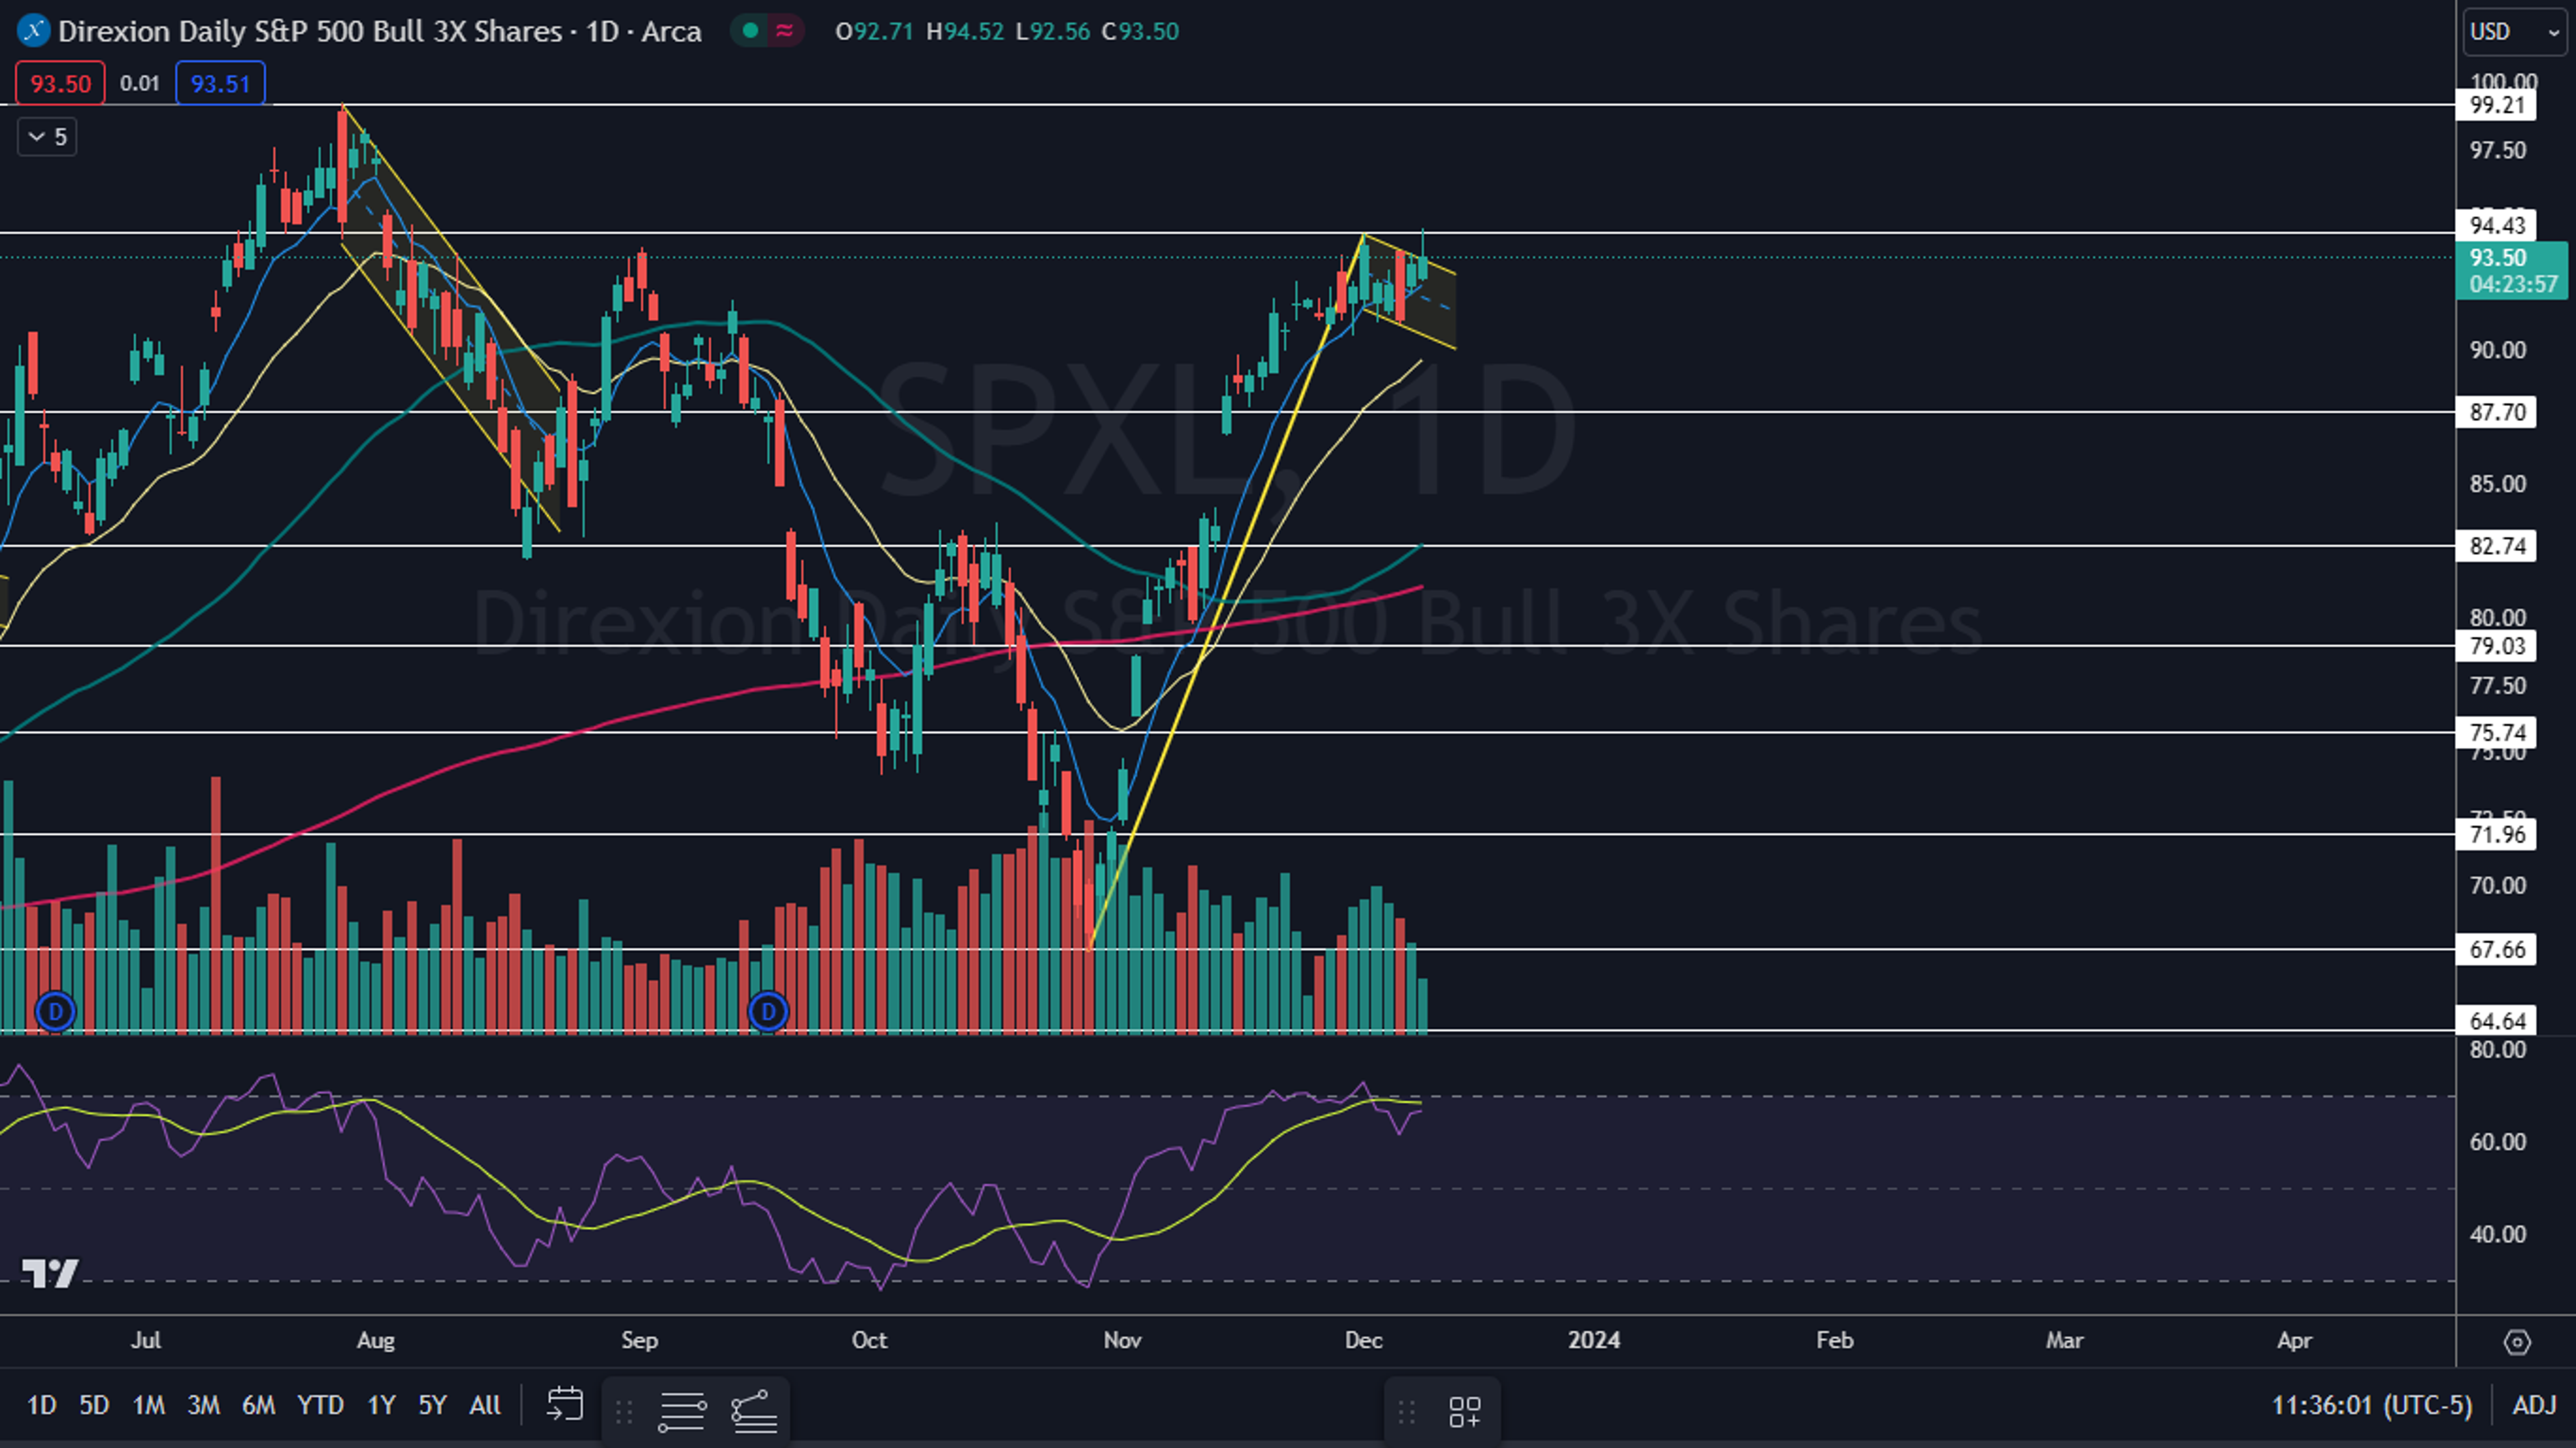
The SPXL Chart: Between Oct. 27 and Friday, SPXL has formed a massive bull flag pattern on the daily chart, with a measured move of a whopping 39.5%. If the pattern is recognized and the SPY breaks up from its own bull flag on higher-than-average volume, SPXL could be headed toward the $126 mark.
- On Friday, SPXL confirmed its uptrend remains intact. The most recent higher low was formed on Wednesday at $90.96 and the most recent confirmed higher high was printed at the $94.31 mark on Dec. 1. If the ETF retraces on Monday and continues to trade within the flag for a longer period, Friday’s high-of-day will serve as the next higher high within the uptrend.
- Continued consolidation within the flag would help to drop SPXL’s relative strength index (RSI) further down below the 70% level, which the bulls would like to see. When a stock’s or ETF’s RSI nears or exceeds the 70% mark it becomes overbought, which can be a sell signal for technical traders.
- Bearish traders want to see the ETF drop under the eight-day EMA, which could suggest the uptrend will be negated for a period of time, which could accelerate downside pressure.
- SPXL has resistance above at $94.43 and at $99.21 and support below at $87.70 and at $82.74.

Edge Rankings
Price Trend
© 2025 Benzinga.com. Benzinga does not provide investment advice. All rights reserved.
Trade confidently with insights and alerts from analyst ratings, free reports and breaking news that affects the stocks you care about.

