

- Tesla is trading in a downtrend but may have found a local bottom near the 50-day SMA.
- Bullish traders want to see the stock regain $262 to avoid the eight-day EMA crossing under the 21-day EMA.
- Get ahead of Wall Street reactions—Benzinga Pro delivers signals, squawk, and news fast. Now 60% off this 4th of July.
Tesla, Inc TSLA was falling slightly on Friday, testing the 50-day simple moving average (SMA) as support after Cathie Wood’s ARK Invest disposed of $15.94 million worth of the stock.
The EV-giant's move lower confirmed the stock’s downtrend remains intact, with the formation of another lower low. The local bottom may be in, because Tesla was working to print a hammer candlestick on the daily chart.
A hammer candlestick pattern forms when a red or green candlestick prints, with a long lower wick and a short upper body, which resembles a hammer.
A hammer candlestick, when found in a downtrend, can indicate a reversal to the upside on the horizon. It is a lagging indicator because the next candle on the timeframe being studied must print before the pattern can be validated.
A hammer candlestick doesn’t necessarily mean a new uptrend will occur, only that a bounce higher is likely imminent.
Candlestick patterns can be used to indicate the future price direction of a stock. Candlestick patterns are especially useful for technical traders when they are combined with other indicators such as larger patterns, trading volume, relative strength index (RSI) and divergences between RSI and price action.
Want direct analysis? Find me in the BZ Pro lounge! Click here for a free trial.
The Tesla Chart: Tesla entered a downtrend on Sept. 15 after forming a bearish double top pattern at the $278.91 mark, when paired with similar price action on Sept. 12. The stock’s most recent lower high within the downtrend was formed on Wednesday at $273.93 and the most recent confirmed lower low was printed at the $261.20 mark the day prior.
- On Friday, Tesla looked to be forming its next lower low within the pattern but holding above support at the 50-day SMA and forming a hammer candlestick. If the candlestick is recognized, Tesla is likely to bounce on Monday, at least to print another lower high.
- While the eight-day exponential moving average (EMA) is currently trending above the 21-day EMA, the former will cross below the latter if Tesla doesn’t regain both indicators over the next day or two. Bullish traders want to see big bullish volume come in and drive Tesla up $262 to avoid the eight-day crossing under the 21-day.
- Bearish traders want to see Tesla reject the 21-day EMA on the next bounce, which could accelerate downside pressure and drop the stock under the 50-day SMA.
- Tesla has resistance above at $254.98 and at $271.71 and support below at $234.35 and at $225.03.

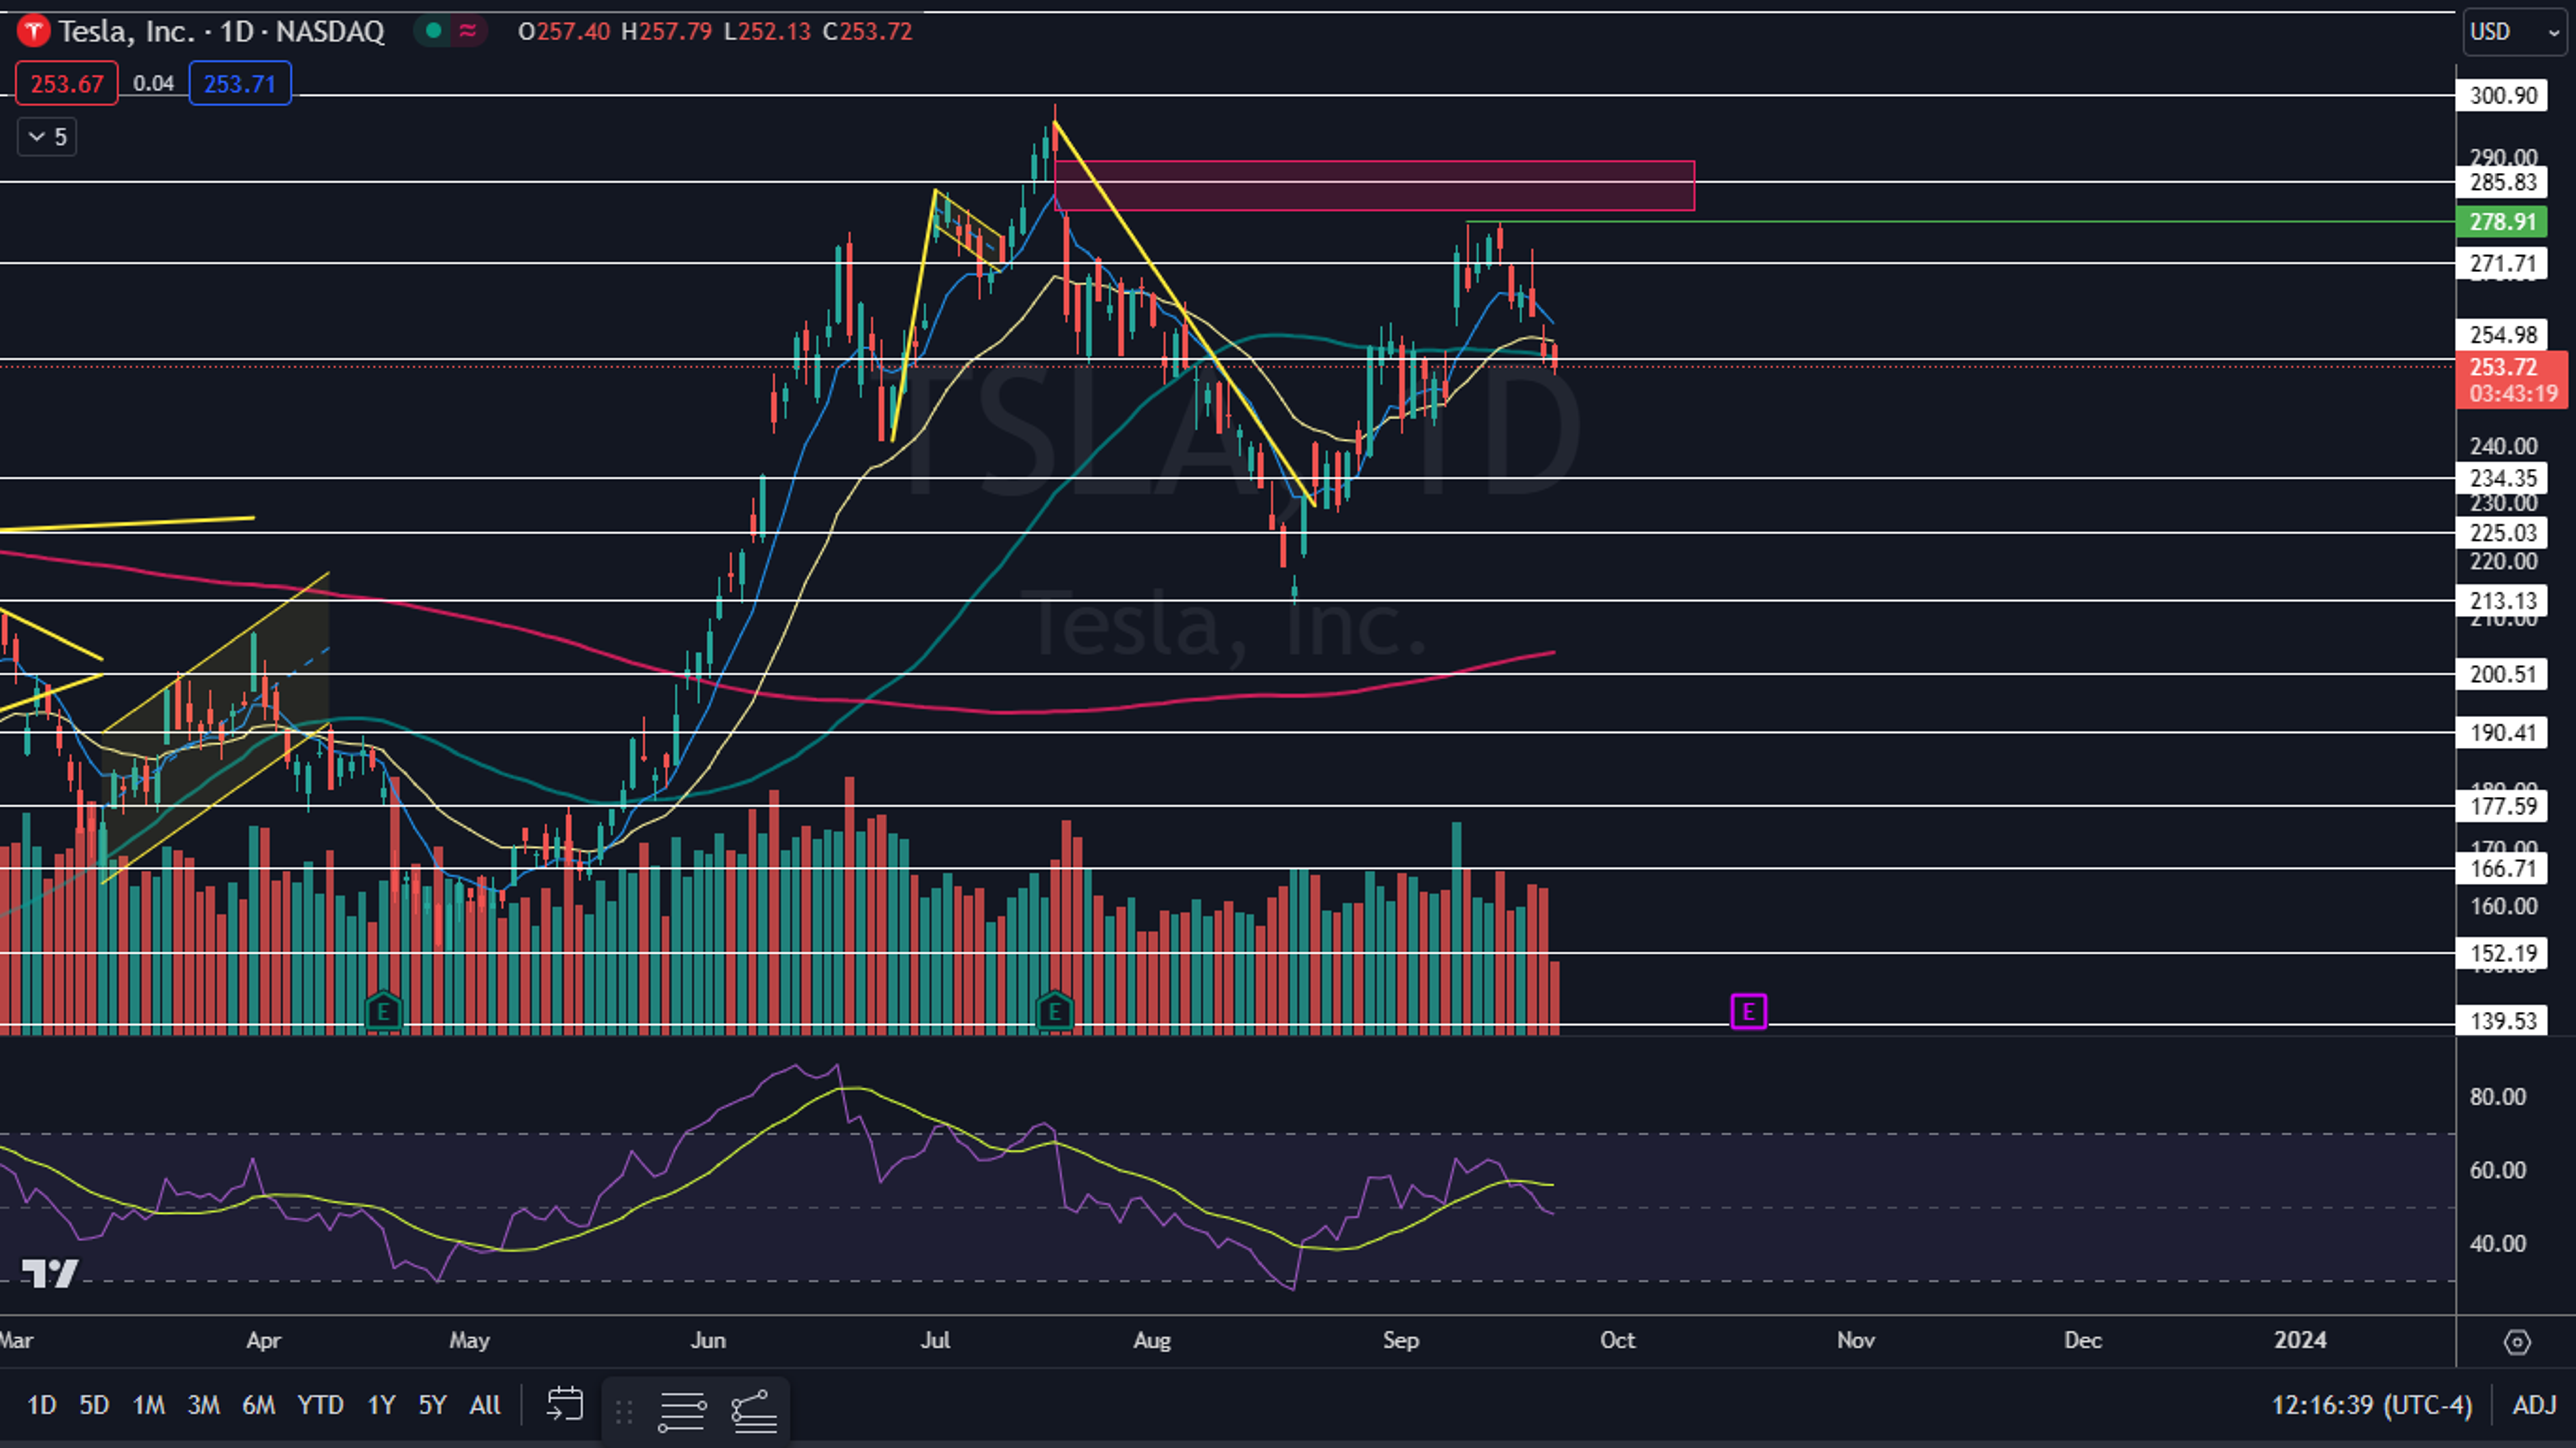
Photo: Shutterstock
Edge Rankings
Price Trend
© 2025 Benzinga.com. Benzinga does not provide investment advice. All rights reserved.
Trade confidently with insights and alerts from analyst ratings, free reports and breaking news that affects the stocks you care about.

