
Zinger Key Points
- Tesla is forming a possible bull flag pattern with a measured move of about 18%.
- If the bull flag plays out, Tesla will also confirm a new uptrend.
- Get our list of 10 overlooked stocks—including one paying a 9% dividend—before Wall Street catches on.
Tesla, Inc TSLA was trading flat on Friday, continuing to consolidate on below-average-volume as the stock settles into a possible bull flag pattern on the daily chart.
The bull flag pattern is created with a sharp rise higher forming the pole, which is then followed by a consolidation pattern that brings the stock lower between a channel with parallel lines or into a tightening triangle pattern.
For bearish traders, the "trend is your friend" (until it's not) and the stock may continue downwards within the following channel for a short period of time. Aggressive traders may decide to short the stock at the upper trendline and exit the trade at the lower trendline.
Traders with a bullish outlook should look for a surge beyond the top descending trendline of the flag pattern, accompanied by high trading volume, as a signal for entry. When a stock breaks up from a bull flag pattern, the measured move higher is equal to the length of the pole and should be added to the lowest price within the flag.
A bull flag is negated when a stock closes a trading day below the lower trendline of the flag pattern, or if the flag falls more than 50% down the length of the pole.
Want direct analysis? Find me in the BZ Pro lounge! Click here for a free trial.
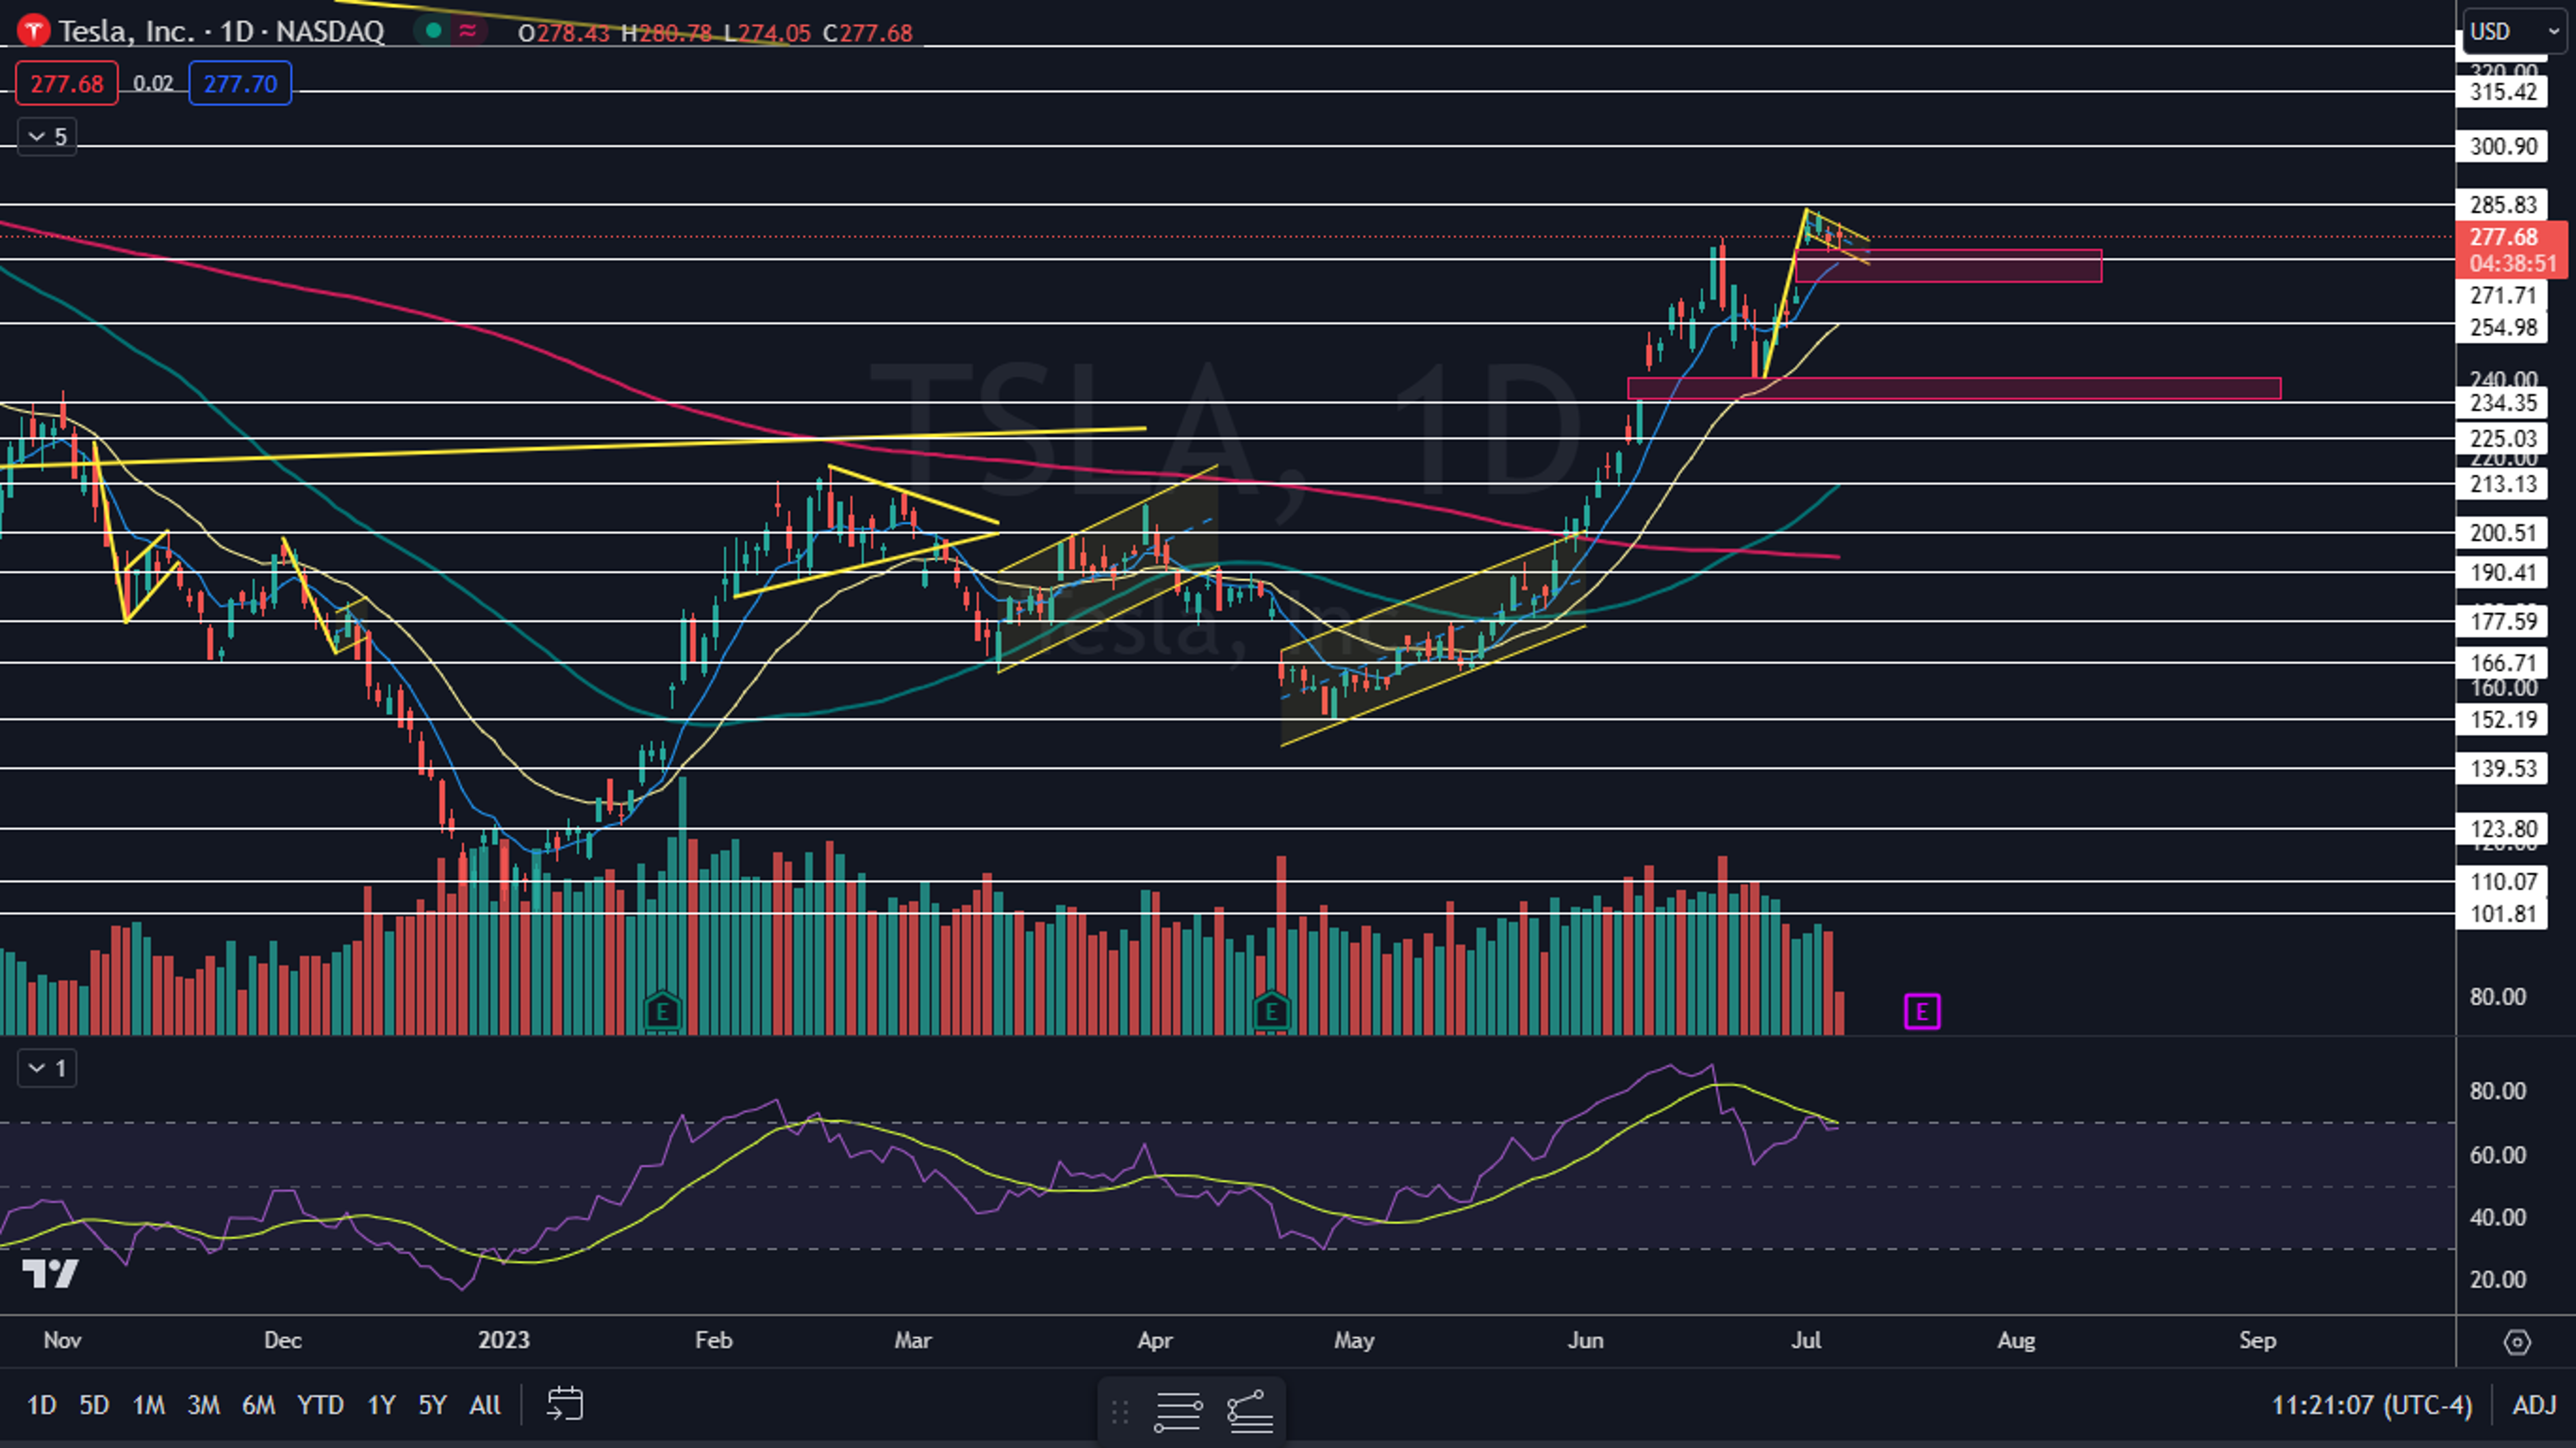
The Tesla Chart: Tesla has created a possible bull flag pattern between June 27 and Friday, with the pole formed over the first five trading days of that timeframe and the flag formed since. The measured move of the bull flag is about 18%, which suggests Tesla could rise toward $322.
- Bullish traders want to see substantial bullish volume pushing Tesla beyond the upper descending trendline of the flag pattern, thus confirming the pattern's recognition. If that happens, the stock will also form a higher high, which will confirm a new uptrend is in the cards.
- Bearish traders want to see big bullish volume come in and break Tesla down under the eight-day exponential moving average, which would negate the bull flag and confirm a short-term downtrend. If that happens, a gap that exists between $265.63 and $274.05 is likely to fill.
- Tesla has resistance above at $285.83 and $300.90 and support below at $271.71 and $254.98.

Read Next: Tesla, Amazon And 2 Other Stocks Insiders Are Selling
Edge Rankings
Price Trend
© 2025 Benzinga.com. Benzinga does not provide investment advice. All rights reserved.
Trade confidently with insights and alerts from analyst ratings, free reports and breaking news that affects the stocks you care about.

