

- Amazon has been trading in a rising channel pattern since May 31.
- The channel is considered bullish in the short term but can be bearish down the road.
- Get access to the leaderboards pointing to tomorrow’s biggest stock movers.
Amazon.com, Inc AMZN was down about 2% on Thursday morning, at the lower trend line of a rising channel pattern.
The pattern is bullish for the short term, but can be bearish down the road.
For bullish traders, the "trend is your friend" (until it's not) and the stock is likely to continue upwards. Aggressive traders may decide to buy the stock at the lower trend line and exit the trade at the upper trend line.
Bearish traders will want to watch for a downward break from the lower ascending trend line, on high volume, for an entry. When a stock breaks down from a rising channel, it's a powerful reversal signal and indicates a downturn is likely in the cards.
It should be noted that during market bull cycles, stocks can break up bullishly from rising channels.
If Amazon eventually breaks down from the pattern, volatility in the stock market could increase due to the stock being heavily weighted within the SPDR S&P 500.
Traders wishing to play the potential volatility in the stock market can use MIAX’s SPIKES Volatility products. The products, which are traded on SPIKES Volatility Index SPIKE, track expected volatility in the SPY over the next 30 days.
Want direct analysis? Find me in the BZ Pro lounge! Click here for a free trial.
The Amazon Chart: Amazon has been trading in the pattern since May 31, but since June 23, the stock has found resistance near $131 and had been trading mostly sideways within the channel. The sideways consolidation took place on decreasing volume, which suggested a larger move could be on the horizon.
- Bullish traders want to see big bullish volume come in and break Amazon up through $131, which would likely bring the stock to at least the upper trend line of the channel. If that happens, bullish traders want to see continued bullish momentum cause Amazon to break through the channel.
- Bearish traders want to see big bearish volume come in and knock Amazon down under the lower ascending trend line of the channel, and then for bearish momentum to come in and cause Amazon to lose support at the 21-day exponential moving average.
- Amazon has resistance above at $131 and $136.83 and support below at $125.93 and $117.16.

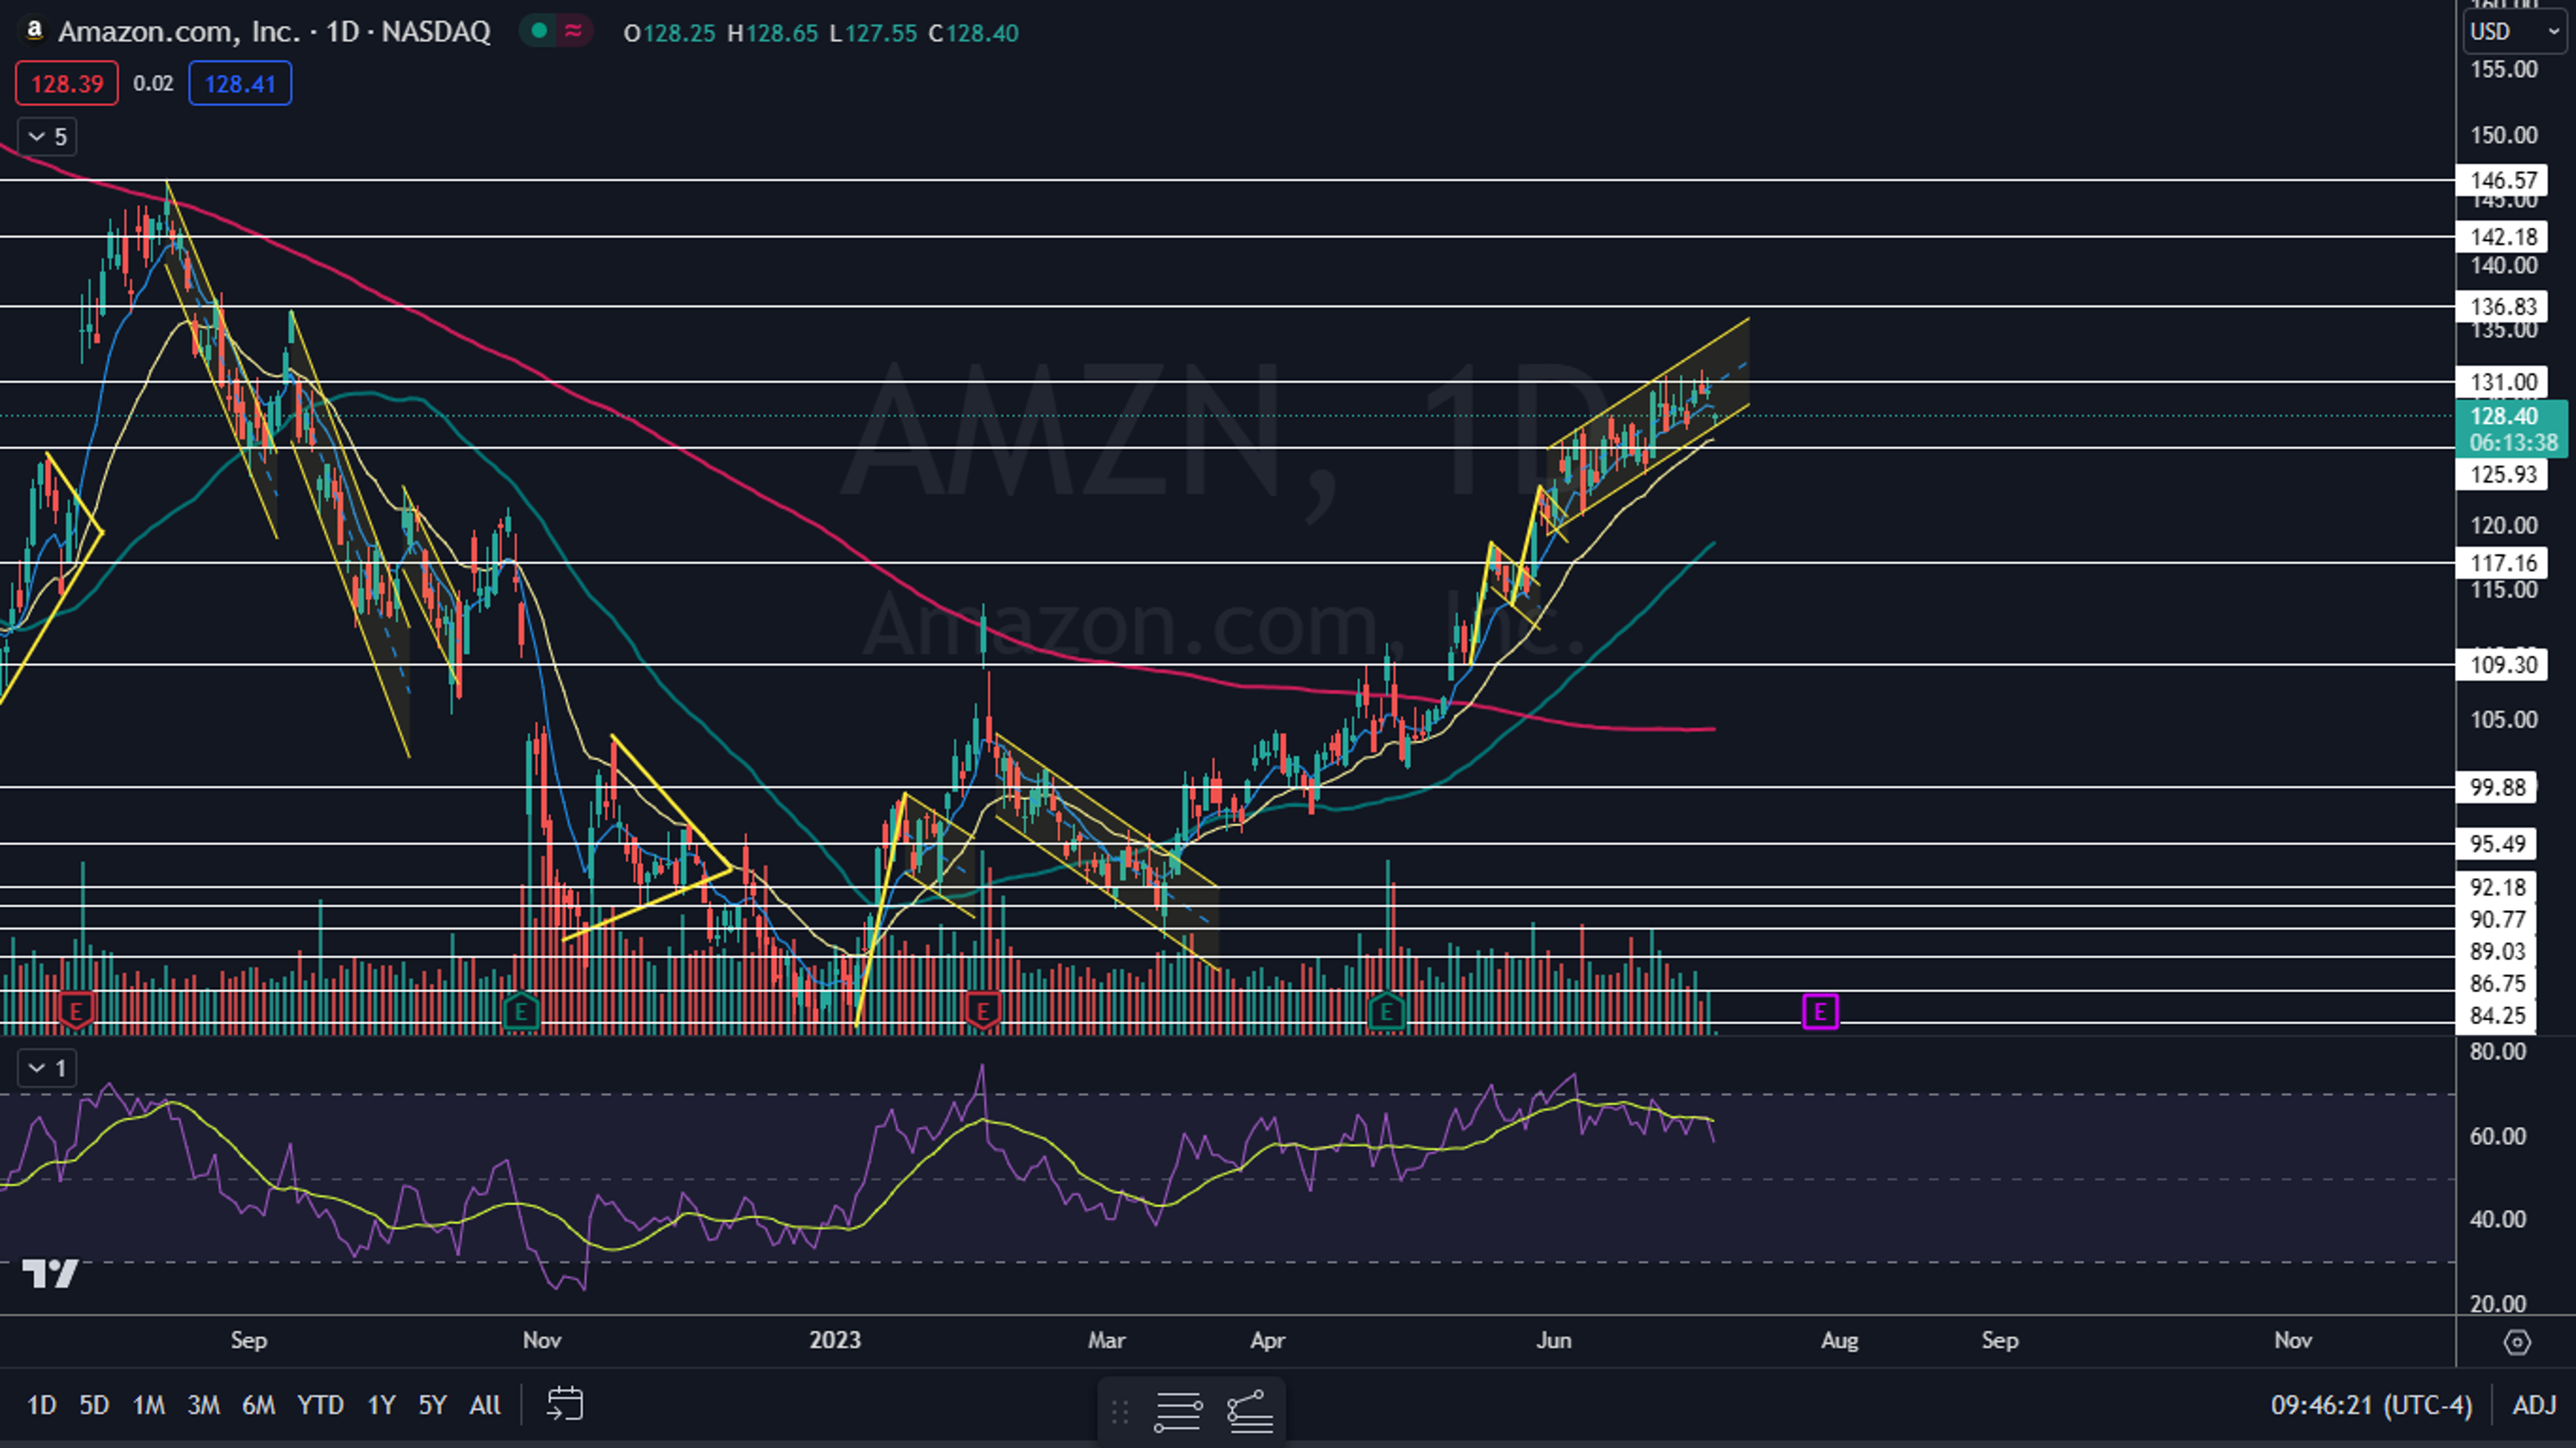
Photo: Shutterstock
Edge Rankings
Price Trend
© 2025 Benzinga.com. Benzinga does not provide investment advice. All rights reserved.
Trade confidently with insights and alerts from analyst ratings, free reports and breaking news that affects the stocks you care about.

