


Zinger Key Points
- Nvidia may be forming a bull flag pattern while consolidating its all-time high run.
- Bullish traders want to see the stock break bullishly from the pattern on higher-than-average volume.
- Feel unsure about the market’s next move? Copy trade alerts from Matt Maley—a Wall Street veteran who consistently finds profits in volatile markets. Claim your 7-day free trial now.
NVIDIA Corporation NVDA was dropping about 1.8% lower Tuesday but on lower-than-average volume, which suggests consolidation rather than the bears being in control.
The stock has been trading mostly sideways between $375 and the new all-time high of $419.38, which was reached three trading days after Nvidia printed better-than-expected first-quarter earnings.
Following the earnings print, Nvidia skyrocketed about 37% between May 24 and May 30, creating a lower gap. Regardless of the gap, the surge caused Nvidia to print a possible bull flag pattern.
The bull flag pattern is created with a sharp rise higher forming the pole, which is then followed by a consolidation pattern that brings the stock lower between a channel with parallel lines or into a tightening triangle pattern.
For bearish traders, the "trend is your friend" (until it's not), and the stock may continue downward within the following channel for a short period of time. Aggressive traders may decide to short the stock at the upper trendline and exit the trade at the lower trendline.
Bullish traders will want to watch for a break up from the upper descending trendline of the flag formation, on high volume, for an entry. When a stock breaks up from a bull flag pattern, the measured move higher is equal to the length of the pole and should be added to the lowest price within the flag.
Want direct analysis? Find me in the BZ Pro lounge! Click here for a free trial.
The Nvidia Chart: Bullish traders want to see big bullish volume come in and break Nvidia up from the upper descending trend line of the flag formation. If that occurs, the measured move suggests the stock could spike up toward the $520 level.
- Bearish traders want to see big bearish volume come in and break Nvidia down from the lower ascending trend line of the flag, which would cause the stock to lose support at the eight-day exponential moving average. If that takes place, Nvidia is likely to close the gap below, which exists between $306.07 and $366.35.
- On Tuesday, Nvidia was working to print a doji candlestick on the daily chart, which suggests indecision. The stock will meet the apex of the flag on Thursday, and traders and investors can watch for volume to come in and break the stock up or down from the pattern on or before Thursday.
- Nvidia has resistance above at $419.38 and support below at $383.40 and $346.47.

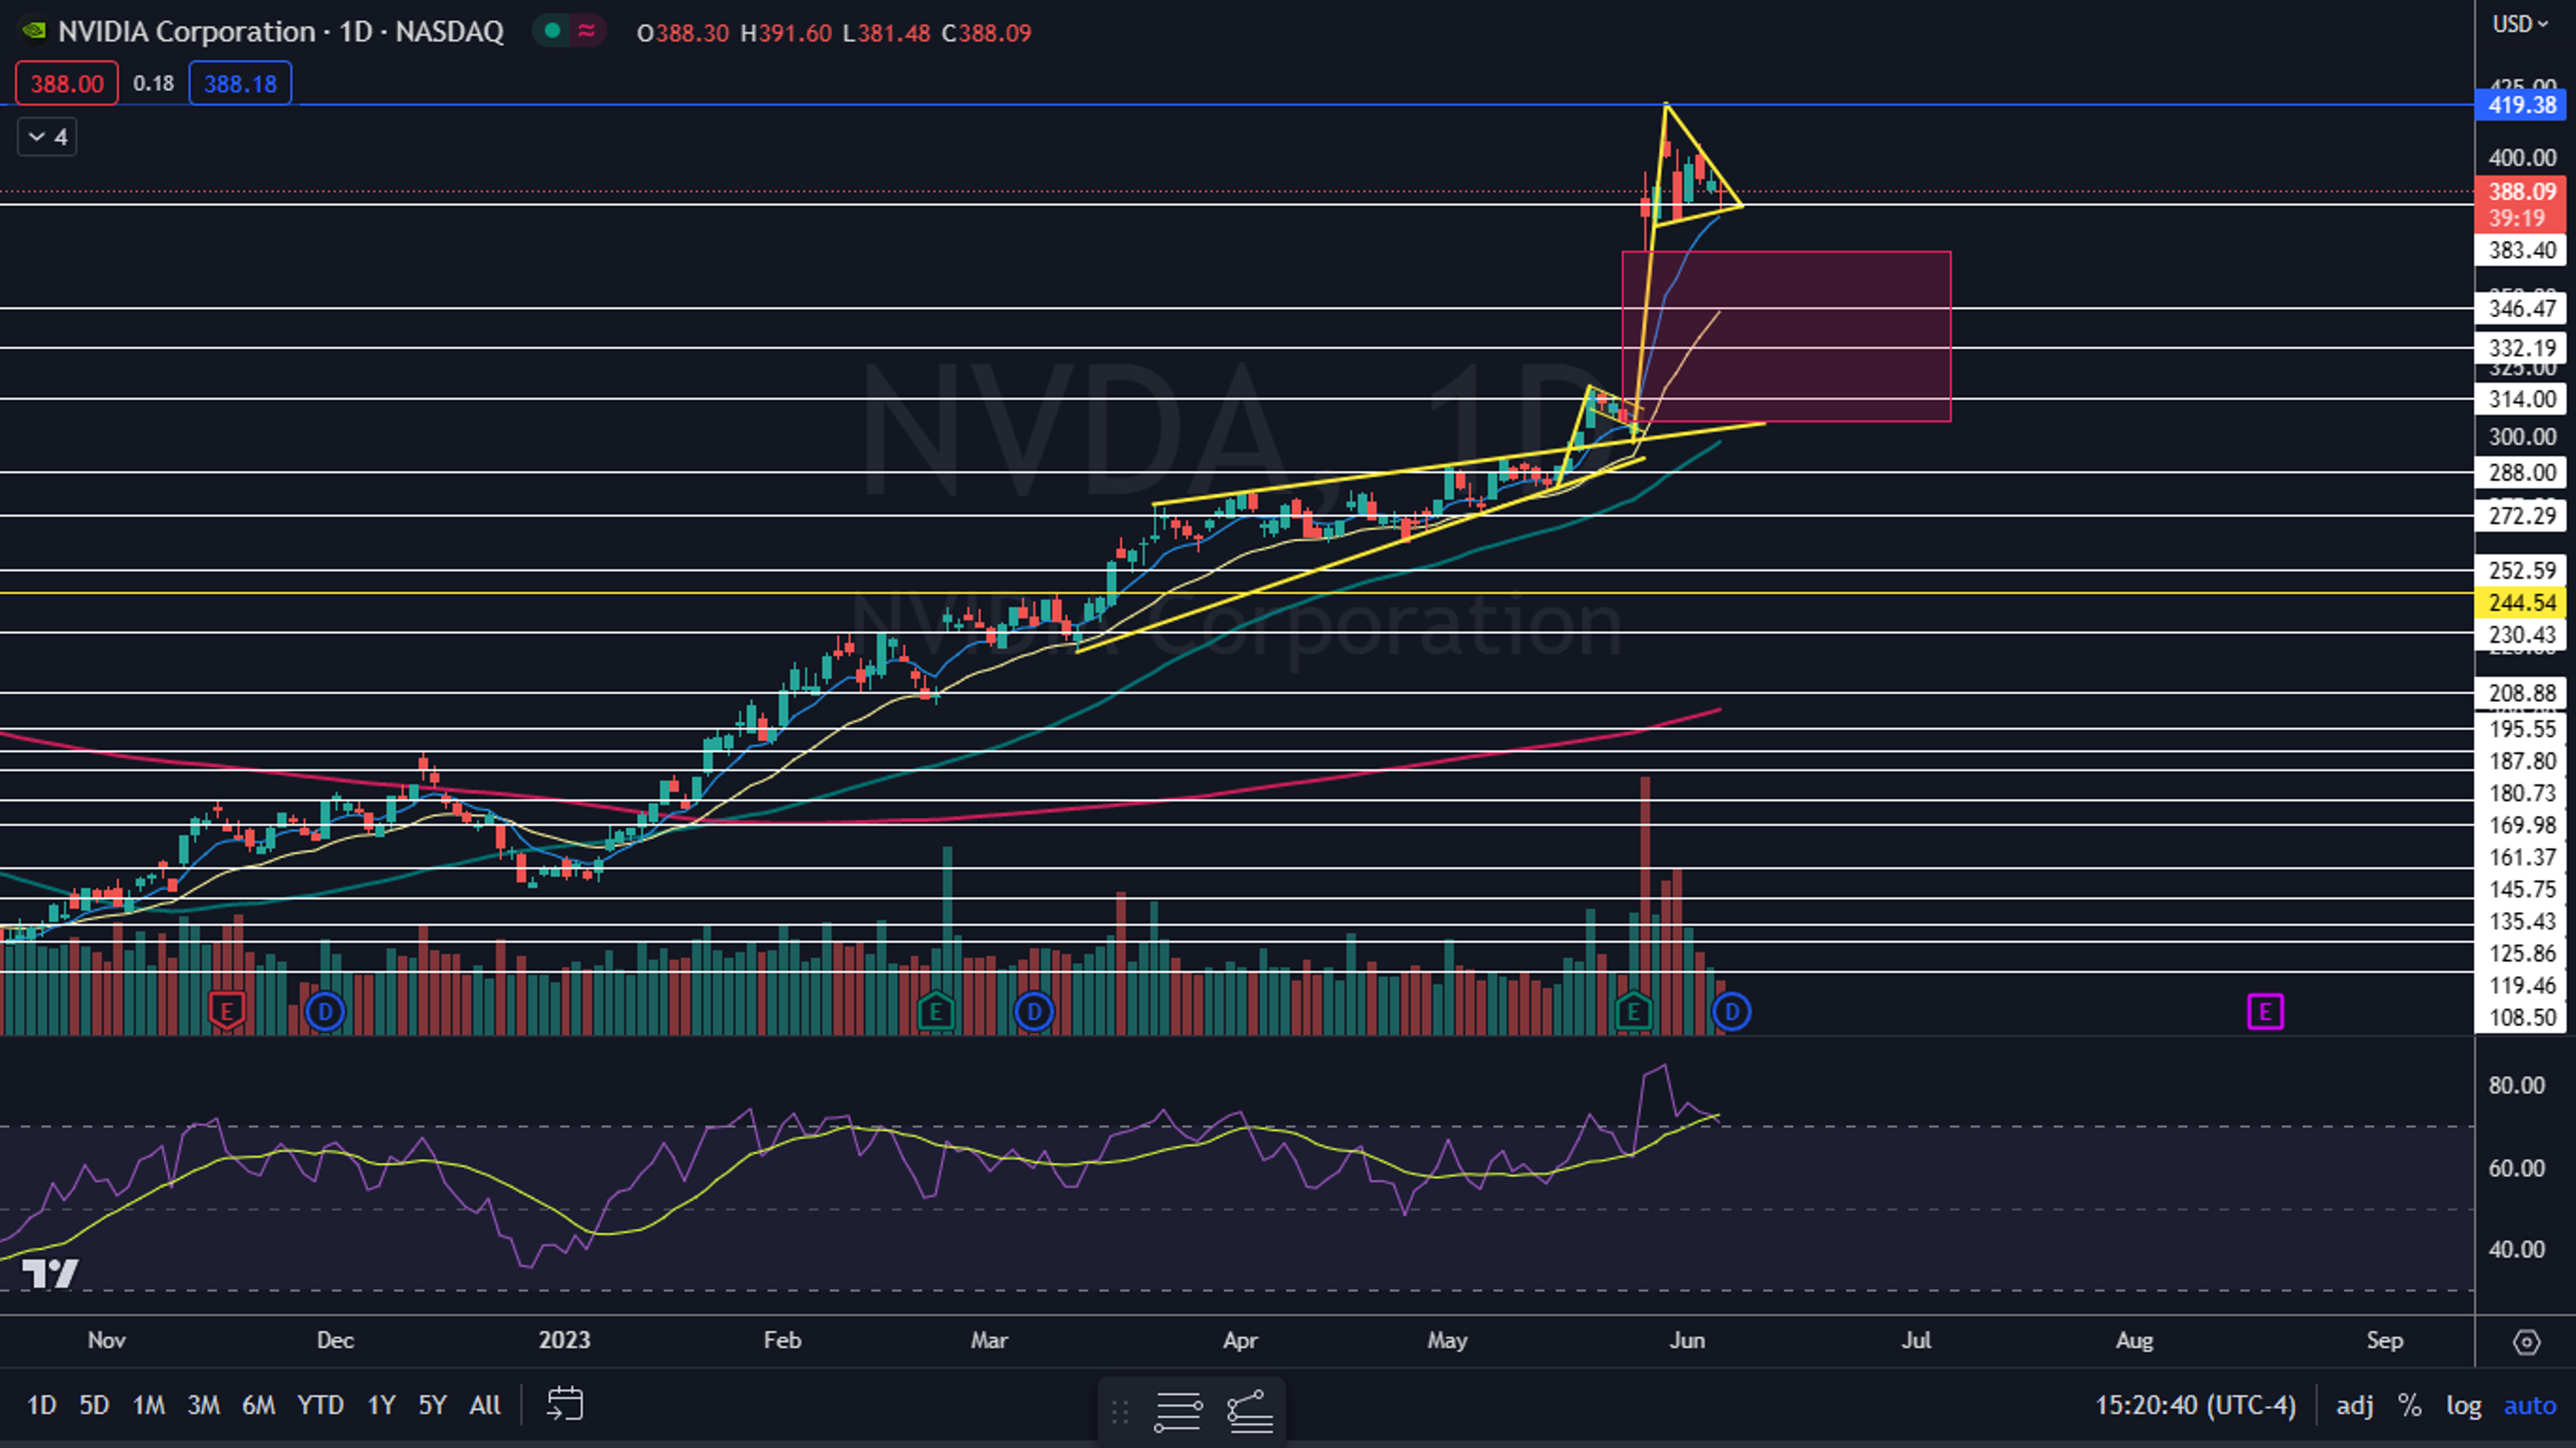
Photo courtesy of Nvidia.
Edge Rankings
Price Trend
© 2025 Benzinga.com. Benzinga does not provide investment advice. All rights reserved.
Trade confidently with insights and alerts from analyst ratings, free reports and breaking news that affects the stocks you care about.

