

Zinger Key Points
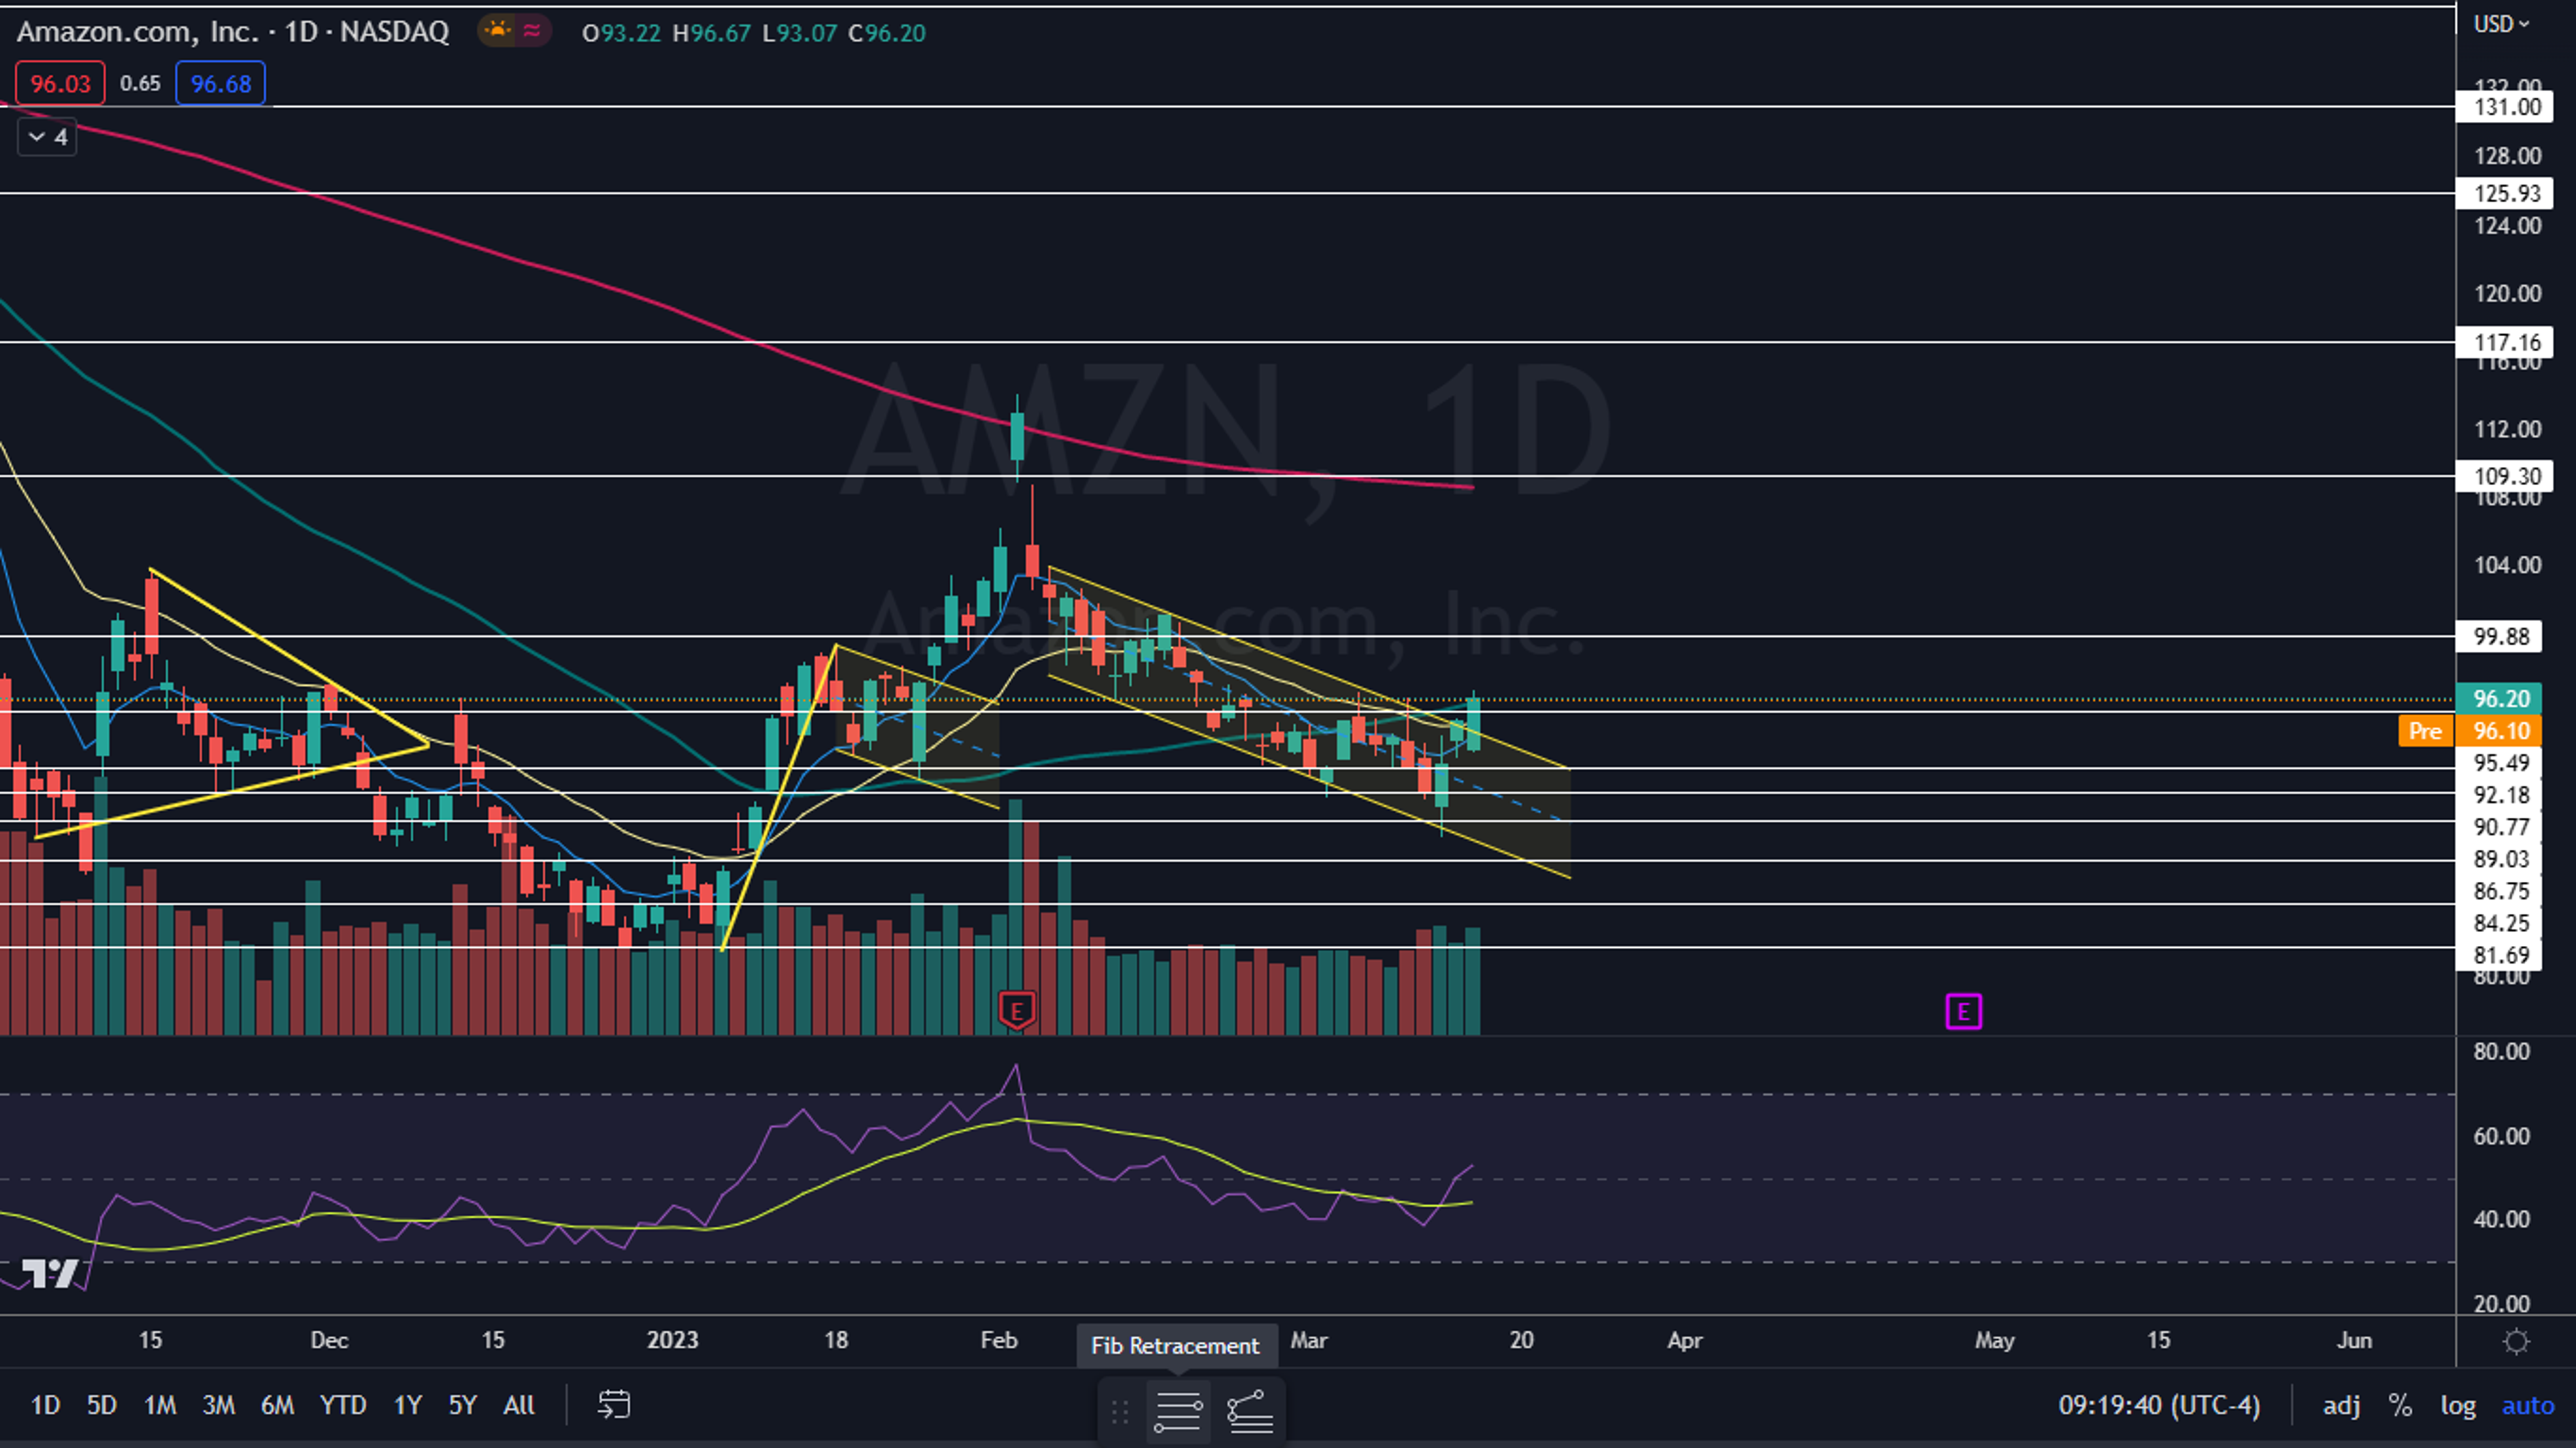
- Amazon broke up bullishly from a falling channel pattern on Wednesday.
- Because Amazon closed Wednesday's session near the high-of-day, higher prices may come on Thursday.
- Get access to the leaderboards pointing to tomorrow’s biggest stock movers.
Amazon.com, Inc AMZN was trading flat in the premarket on Thursday after a bullish day on Wednesday, saw the stock rise 1.39%.
The rise higher allowed Amazon to break up from a falling channel pattern, where the stock had been making lower lows and lower highs between two parallel trendlines.
The pattern is bearish for the short term but can be bullish down the road.
Want direct analysis? Find me in the BZ Pro lounge! Click here for a free trial.
For bearish traders, the "trend is your friend" (until it's not) and the stock is likely to continue downwards. Aggressive traders may decide to short the stock at the upper trendline and exit the trade at the lower trendline.
Bullish traders will want to watch for a break up from the upper descending trendline, on high volume, for an entry. When a stock breaks up from a descending channel, it's a powerful reversal signal and indicates a rally is likely in the cards.
The Amazon Chart: Amazon’s break up from the falling channel came on higher-than-average volume, which indicates that the pattern was recognized. On Wednesday, the Seattle-based company’s trading volume measured in at over 70 million shares, comapred to the 10-day average of 58.73 million.
- On Wednesday, Amazon closed the trading session near its high-of-day price, which caused the strock to print a bullish engulfing candlestick. The candlestick indicates Amazon is likely to trade higher on Thursday.
- The next most likely scenario is that Amazon will print an inside bar pattern, which would lean bullish for continuation. If Amazon trades lower on Wednesday, the stock may find support at the upper descending trendline of the channel pattern.
- If Amazon falls back under the ascending trendline and into the falling channel pattern, the downtrend the stock had been trading in before breaking up from the pattern is likely to continue. If that happens, Wednesday’s bullish price action will serve as a bull trap.
- Amazon has resistance above at $99.88 and $109.30 and support below at $95.49 and $92.18.

Edge Rankings
Price Trend
© 2025 Benzinga.com. Benzinga does not provide investment advice. All rights reserved.
Trade confidently with insights and alerts from analyst ratings, free reports and breaking news that affects the stocks you care about.

