
Zinger Key Points
- Ford has completed the measured move of its bull flag break out.
- The stock is in need of consolidation on the daily chart.
- Get 5 ‘Hidden Gem’ stock picks and daily rankings—now 60% off for Memorial Day.
Ford Motor Co. F rallied 4.64% higher on Monday in continued momentum. Over the last four trading days the stock has skyrocketed over 20%.
The surge began on July 27, when Ford began to run up into its earnings print, which took place that day after the market close. Ford printed a big earnings beat, reporting EPS of 68 cents on sales of $37.9 billion compared to the consensus estimate of EPS of 45 cents on sales of $34.32 billion.
The momentum to the upside could also be due to the break up from a bull flag pattern on the daily chart, which also occurred heading into Ford’s earnings event.
The bull flag pattern is created with a sharp rise higher forming the pole, which is then followed by a consolidation pattern that brings the stock lower between a channel with parallel lines or into a tightening triangle pattern.
- For bearish traders, the "trend is your friend" (until it's not) and the stock may continue downwards within the following channel for a short period of time. Aggressive traders may decide to short the stock at the upper trendline and exit the trade at the lower trendline.
- Bullish traders will want to watch for a break up from the upper descending trendline of the flag formation, on high volume, for an entry. When a stock breaks up from a bull flag pattern, the measured move higher is equal to the length of the pole and should be added to the lowest price within the flag.
A bull flag is negated when a stock closes a trading day below the lower trendline of the flag pattern or if the flag falls more than 50% down the length of the pole.
Want direct analysis? Find me in the BZ Pro lounge! Click here for a free trial.
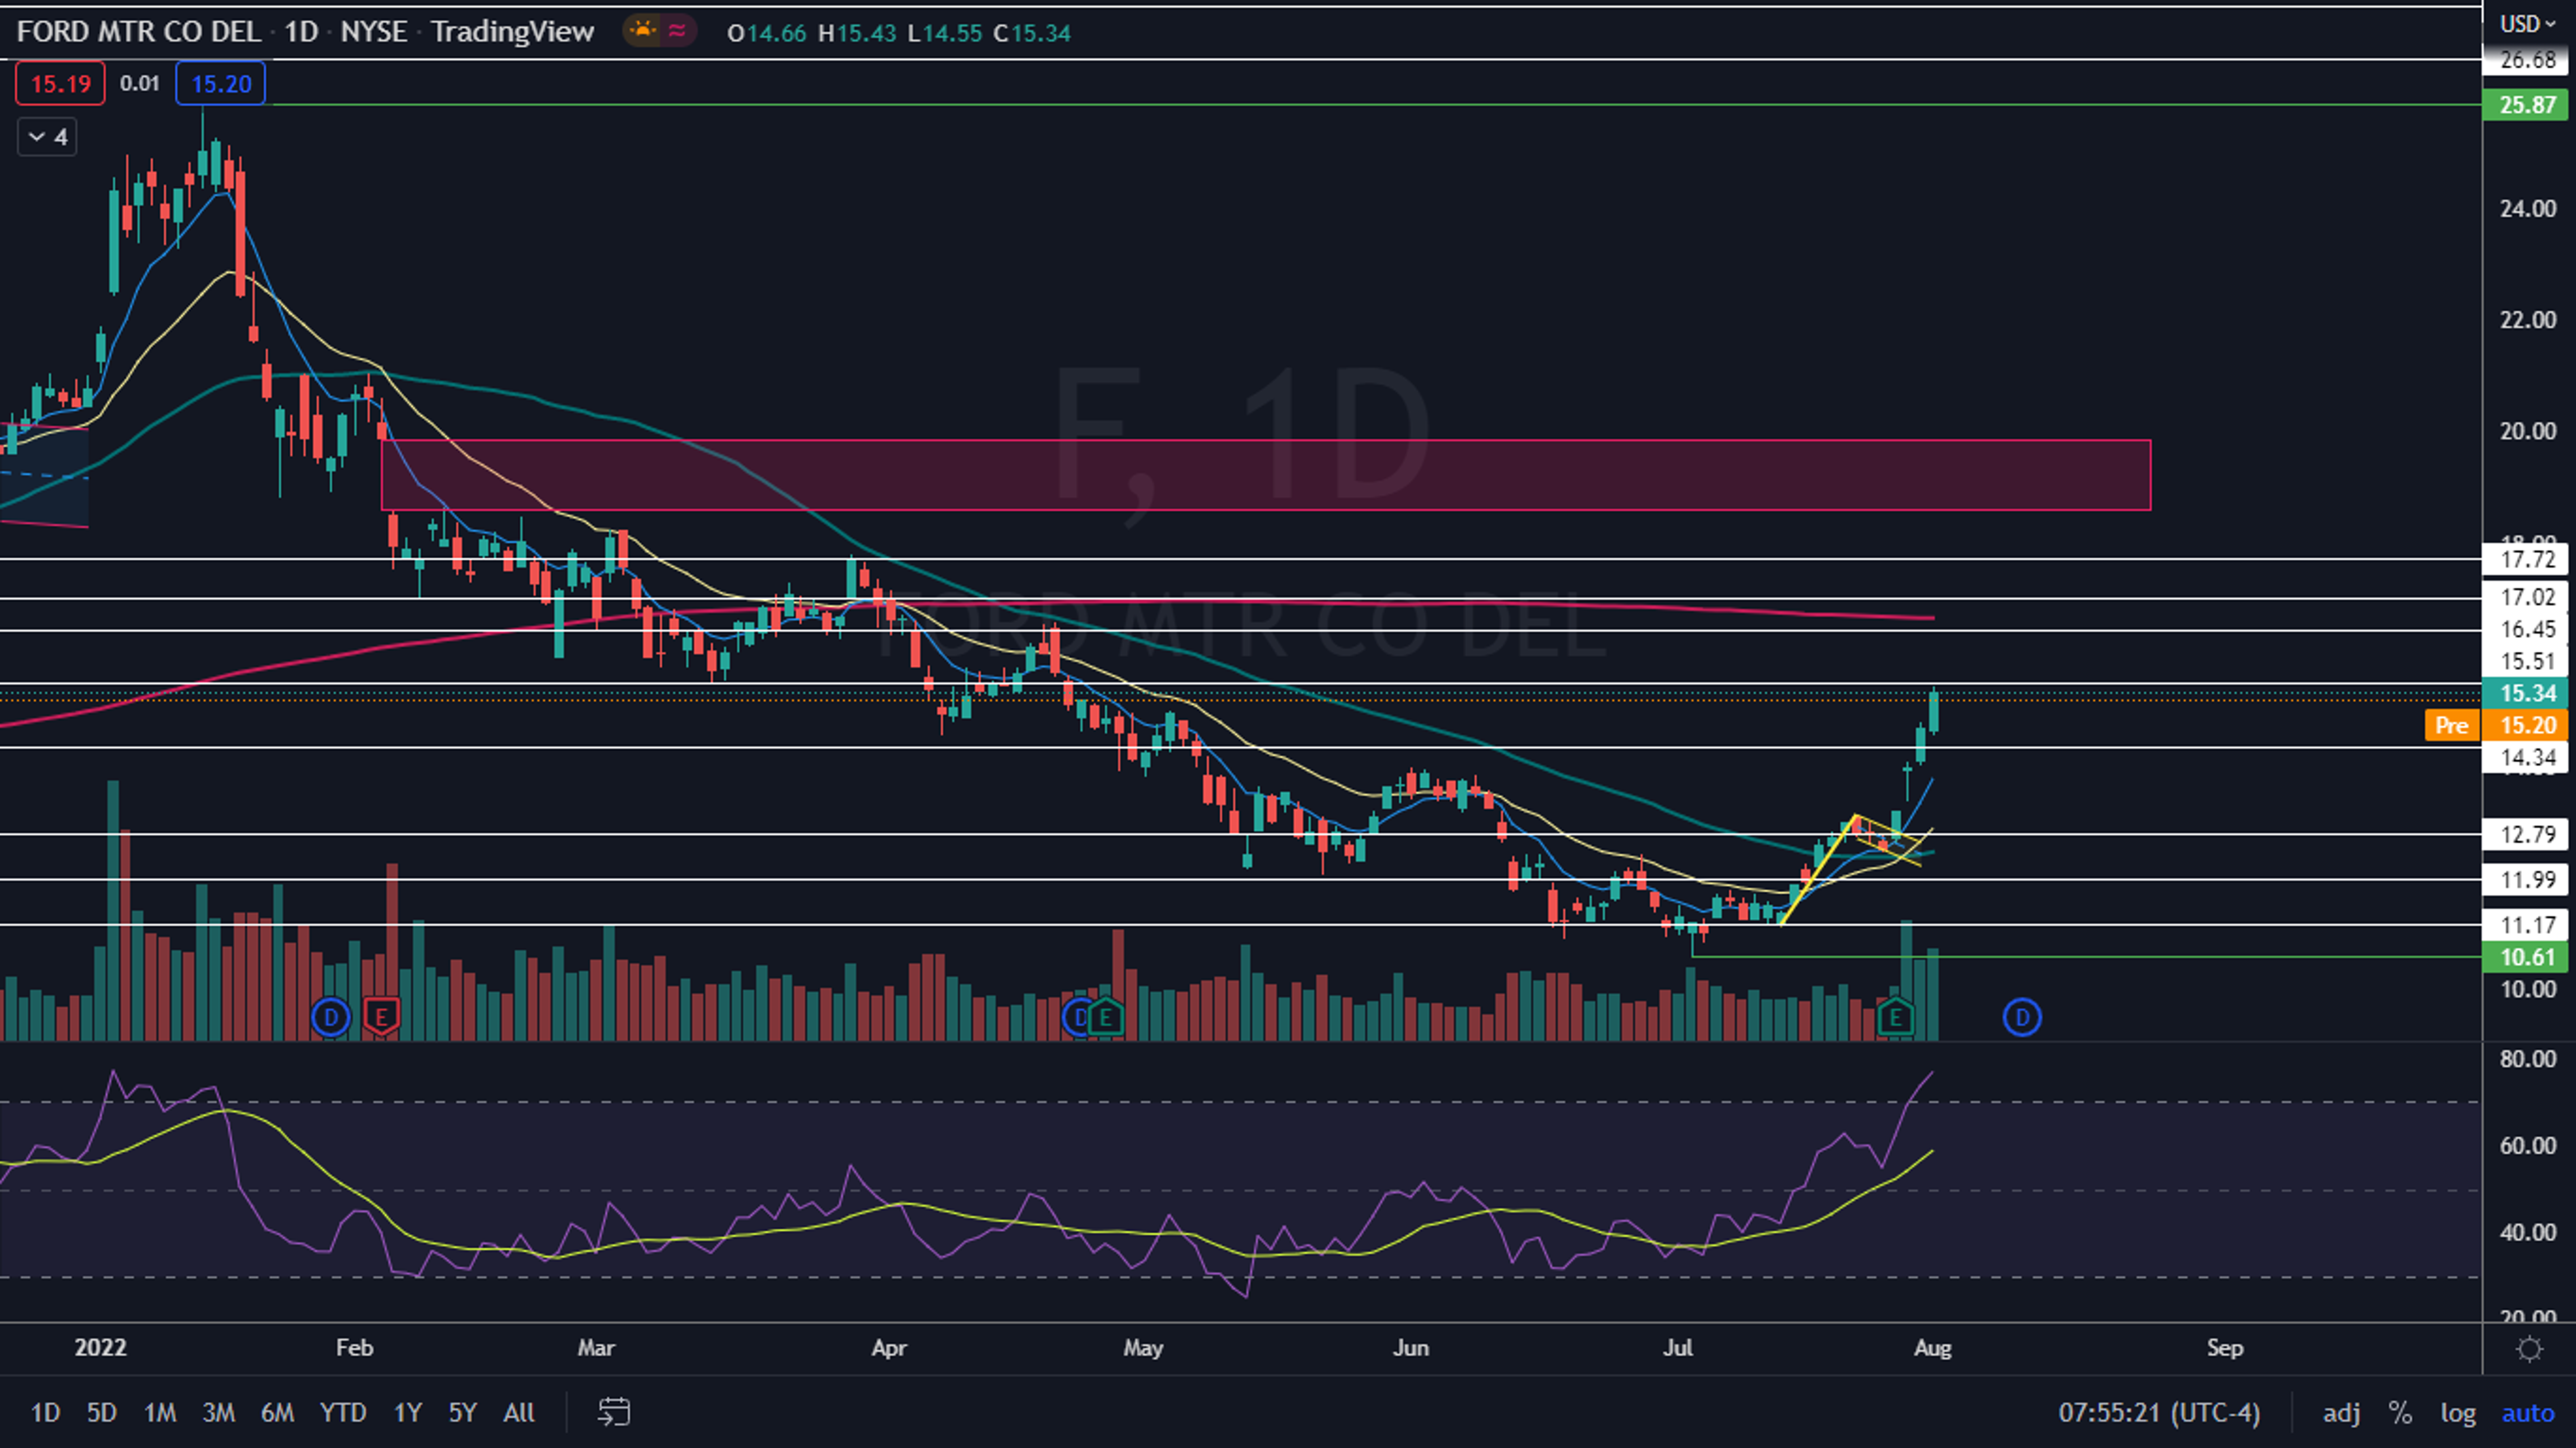
The Ford Chart: Ford’s bull flag was formed between July 14 and July 26, with the pole formed over the first six days of that time frame and the flag over the three days that followed. The measured move of a break of the bull flag was about 18%, which indicates Ford the surge has been completed.
- Ford is trading in a confirmed uptrend, with the most recent higher low formed at the $12.46 level on July 26 and the most recent confirmed higher high printed on July 22 at $13.14. Each of the last four trading days, Ford has printed another consecutive higher high but hasn’t yet indicated the temporary top is in by printing a reversal candlestick.
- Consolidation, to form another higher low, is likely to come on Tuesday or Wednesday because Ford’s relative strength index (RSI) is measuring in at about 77%. When a stock’s RSI reaches or exceeds the 70% level it becomes overbought, which can be a sell signal for technical traders.
- An inside bar pattern, or even double inside bar patter, could also take place over the next couple of days to help cool Ford’s RSI. If the pattern occurs, it will lean bullish because Ford was trading higher going in to the pattern.
- Ford has resistance above at $15.51 and $16.45 and support below at $14.34 and $12.79.

Edge Rankings
Price Trend
© 2025 Benzinga.com. Benzinga does not provide investment advice. All rights reserved.
Trade confidently with insights and alerts from analyst ratings, free reports and breaking news that affects the stocks you care about.

