


Nio, Inc NIO gapped up about 4% higher Thursday morning after Goldman Sachs upgraded the stock from Neutral to Buy with a price target of $56. China-based stocks, in general, were also boosted by a positive comment regarding a recent meeting between U.S. and China officials.
Nio’s stock has suffered from a steep downtrend since reaching a July 1 high of $55.13. That may be set to change, however, because this week Nio has created a bullish pattern on the daily chart.
See Also: 3 Catalysts That May Be Driving Tesla, Nio, XPeng, Li Auto Higher Thursday
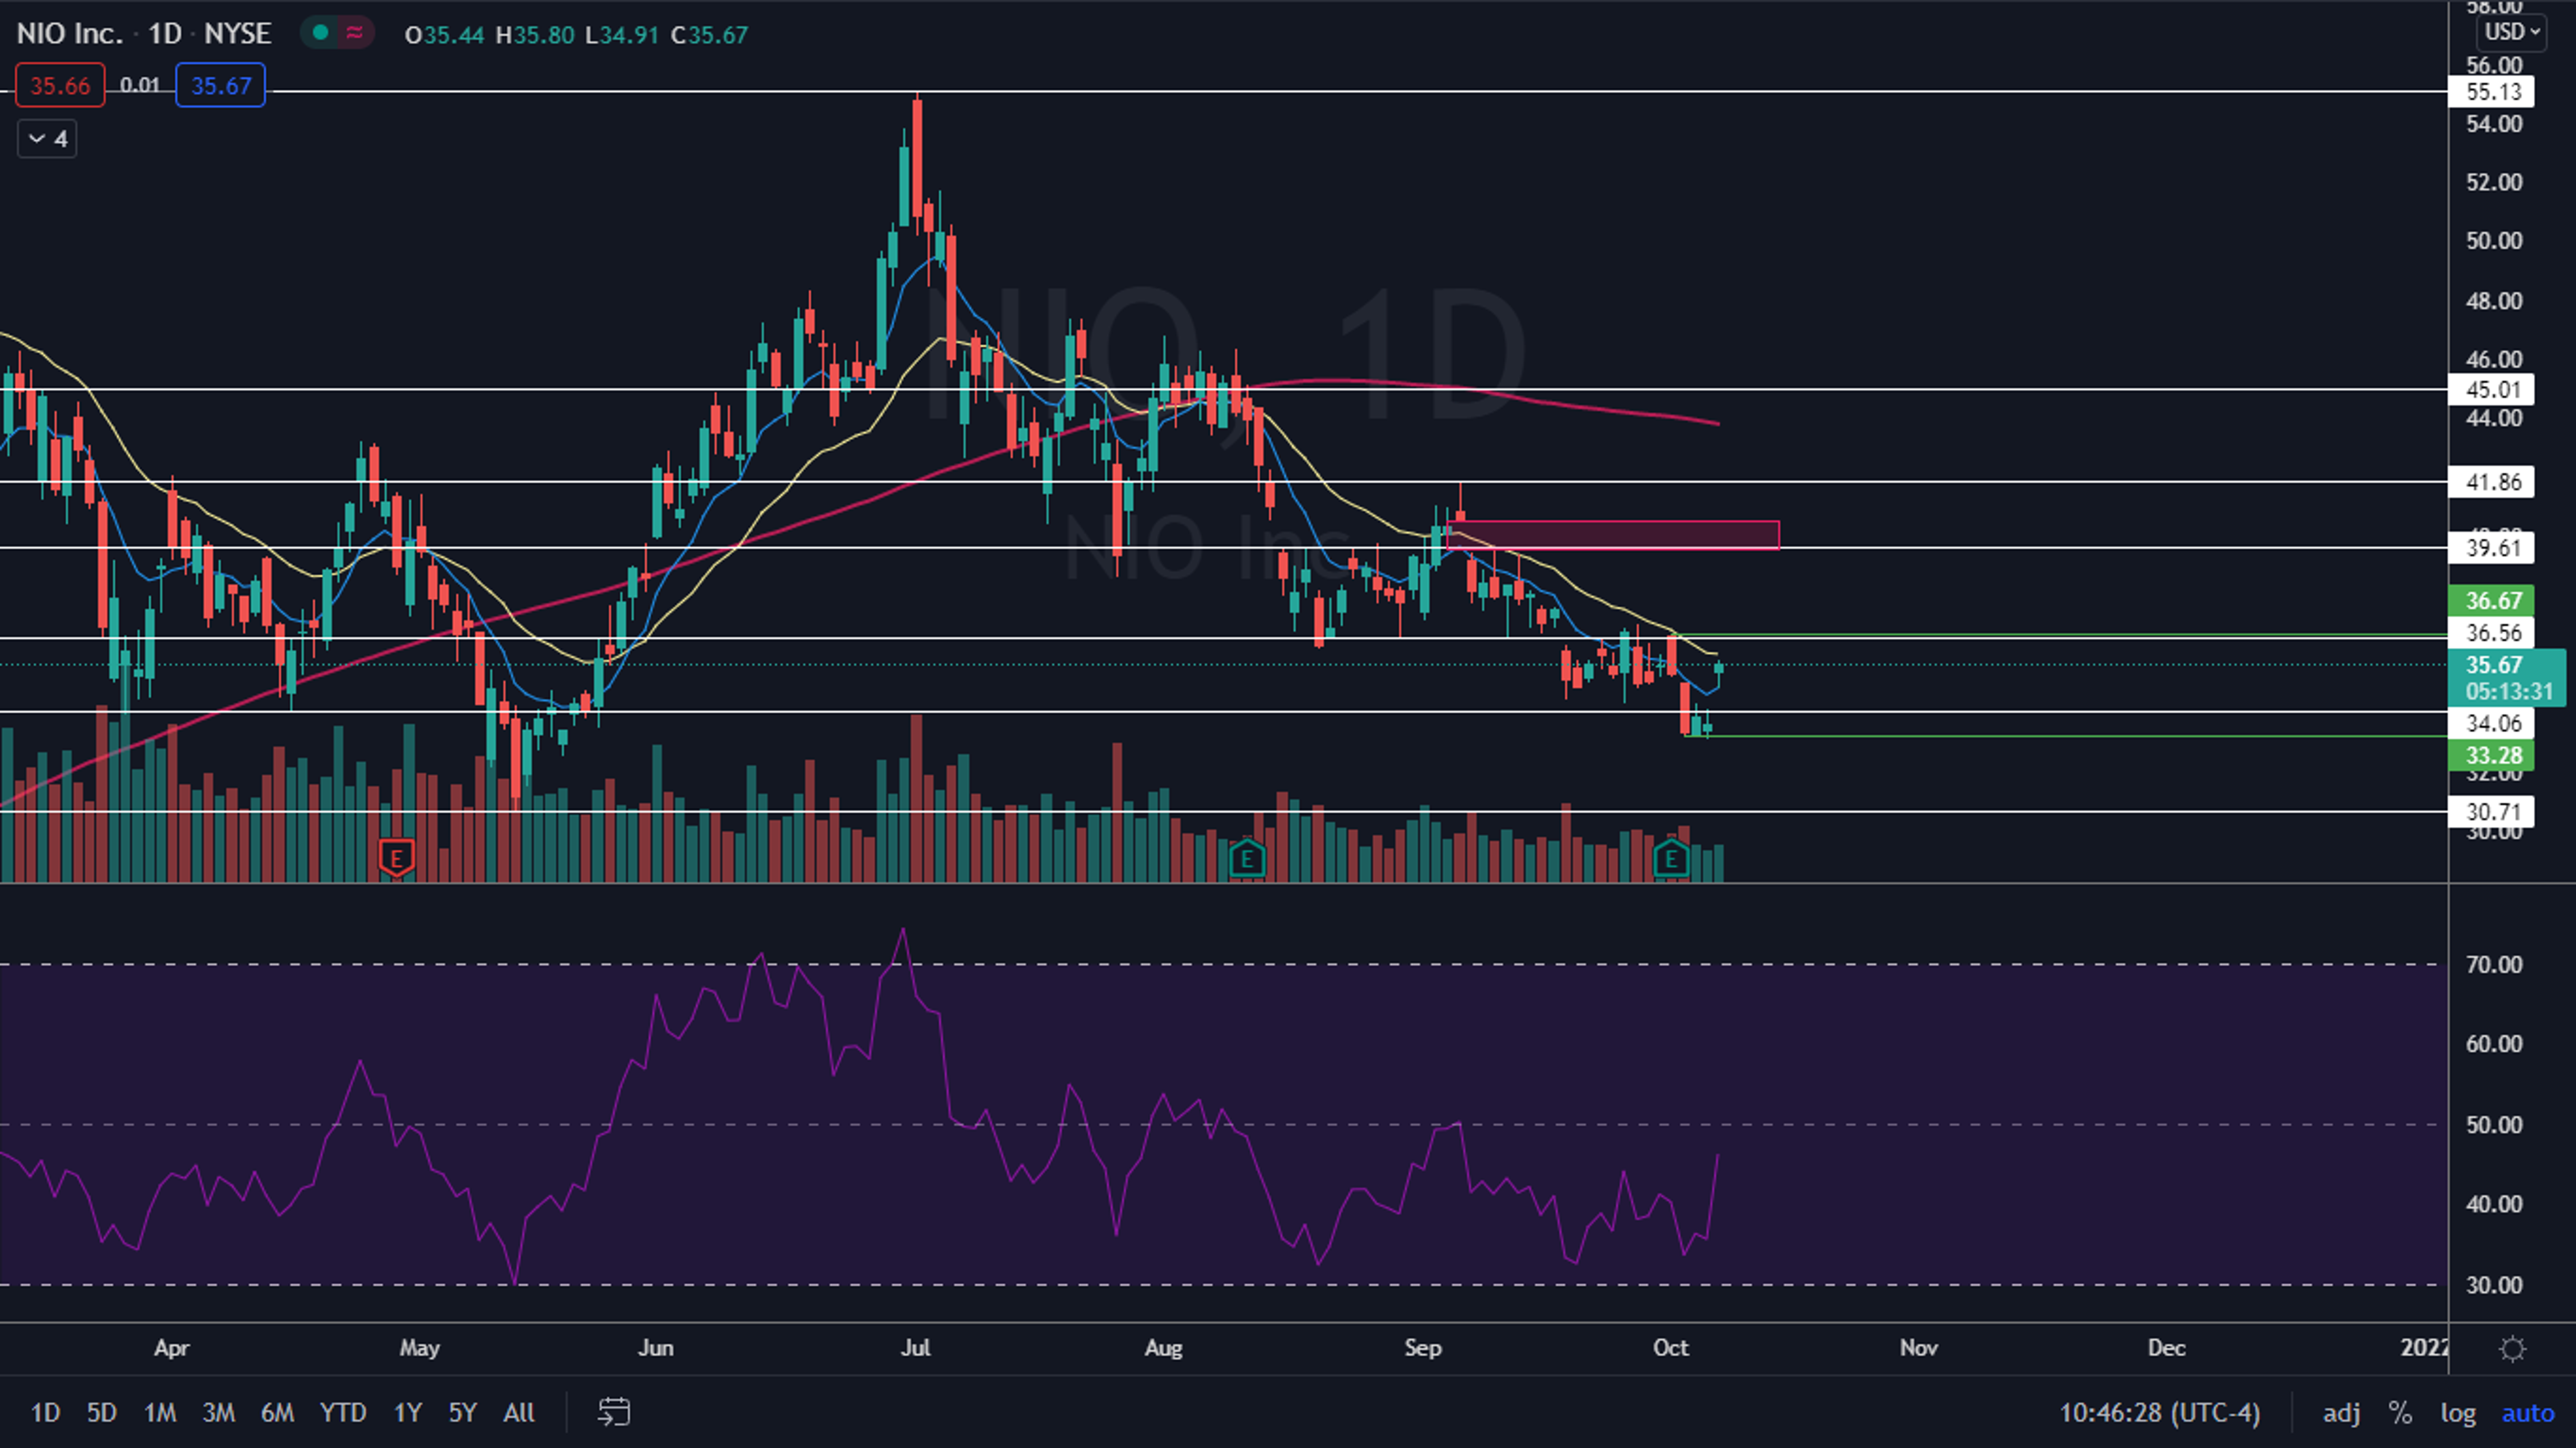
The Nio Chart: On Monday Nio fell through a support level near the $34 mark but didn’t get any bearish follow-through on the move and bottomed out at $33.28. The stock backtested the level again on Tuesday and Wednesday and held above it, which created a bullish triple bottom pattern.
On Thursday, Nio popped back up over the $34 resistance, fell slightly lower when profit takers came in and then bulls bought the dip and the stock began heading toward a higher resistance level at $36.56. Nio opened the trading day above Wednesday’s high, which created a lower gap on the chart.
Nio also has a gap above between $39.52 and $40.53. Gaps fill 90% of the time so it's likely Nio will trade up into the range in the future.
If Nio can break up above the Oct. 1 high of $36.67, it will create a higher high on the daily chart, which will indicate the downtrend is broken. Bulls will then want to watch for a higher low on the daily chart for confirmation of a trend change.
Nio is trading above the eight-day exponential moving average (EMA) but below the 21-day EMA. If Nio’s stock can then regain the $36.50 level as support and stay above it for a period of time the eight-day EMA will cross above the 21-day, which would be bullish. The stock is trading well below the 200-day simple moving average, however, which indicates the stock has a lot of work to do before overall sentiment turns bullish.
- Bulls want to see big bullish volume come in and drive the stock up over the higher resistance level, which will put the stock above the 21-day EMA. Above the $36.50 level, there is another resistance zone at $39.61.
- Bears want to see big bearish volume come in and drop Nio back below the $24.06 support level and for bearish momentum to force the stock to make a lower low below $33.28, which would confirm the downtrend is intact. Below the level, Nio has support at $30.71.

Edge Rankings
Price Trend
© 2025 Benzinga.com. Benzinga does not provide investment advice. All rights reserved.
Trade confidently with insights and alerts from analyst ratings, free reports and breaking news that affects the stocks you care about.

