
FuelCell Energy Inc. FCEL shares were trading lower Tuesday in the wake of a worse-than-expected first-quarter earnings report.

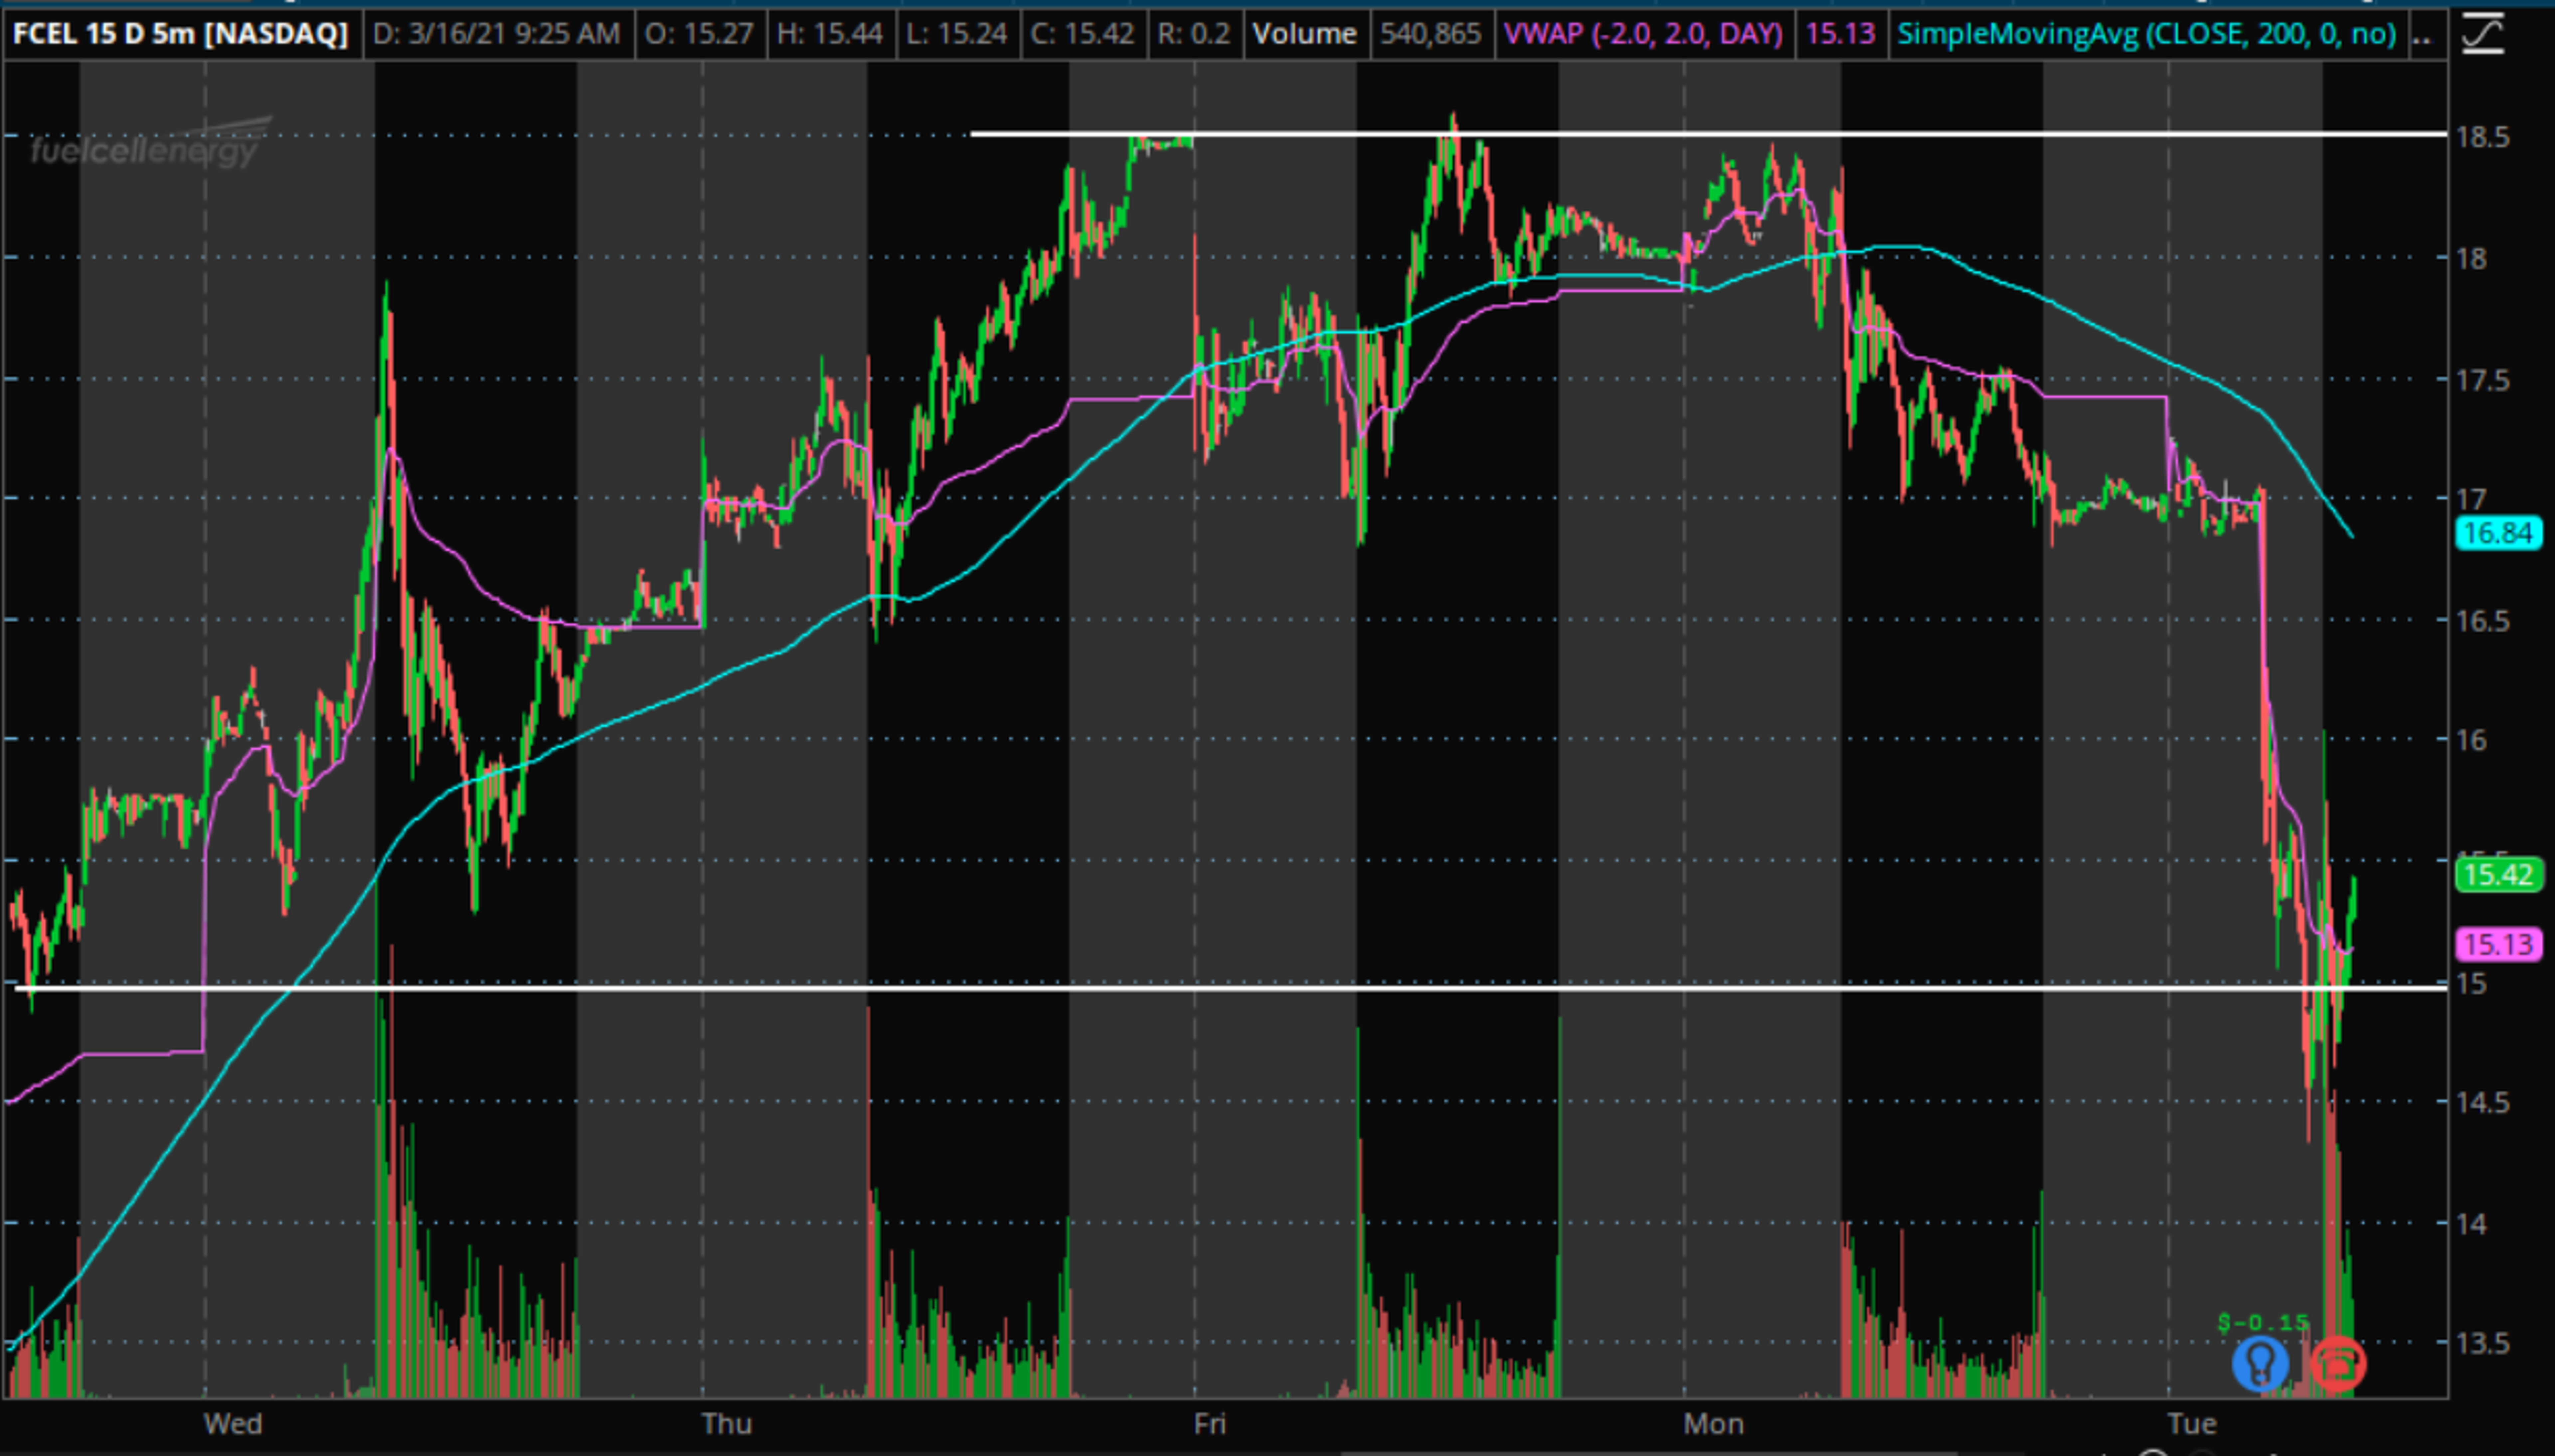
FuelCell Short-Term Chart Analysis: In light of Tuesday's earnings report, the stock may be considered bearish in the short term.
The stock shows potential resistance near $18.50 and potential support near $15 on the 5-minute chart above.
The stock is trading below the 200-day moving average (blue) and above the VWAP (pink).
The price trading below the 200-day moving average brings a bearish sentiment to technical traders. These levels may also show resistance if the price is able to reach these indicators. The VWAP could potentially hold as a support level if the price were to fall.

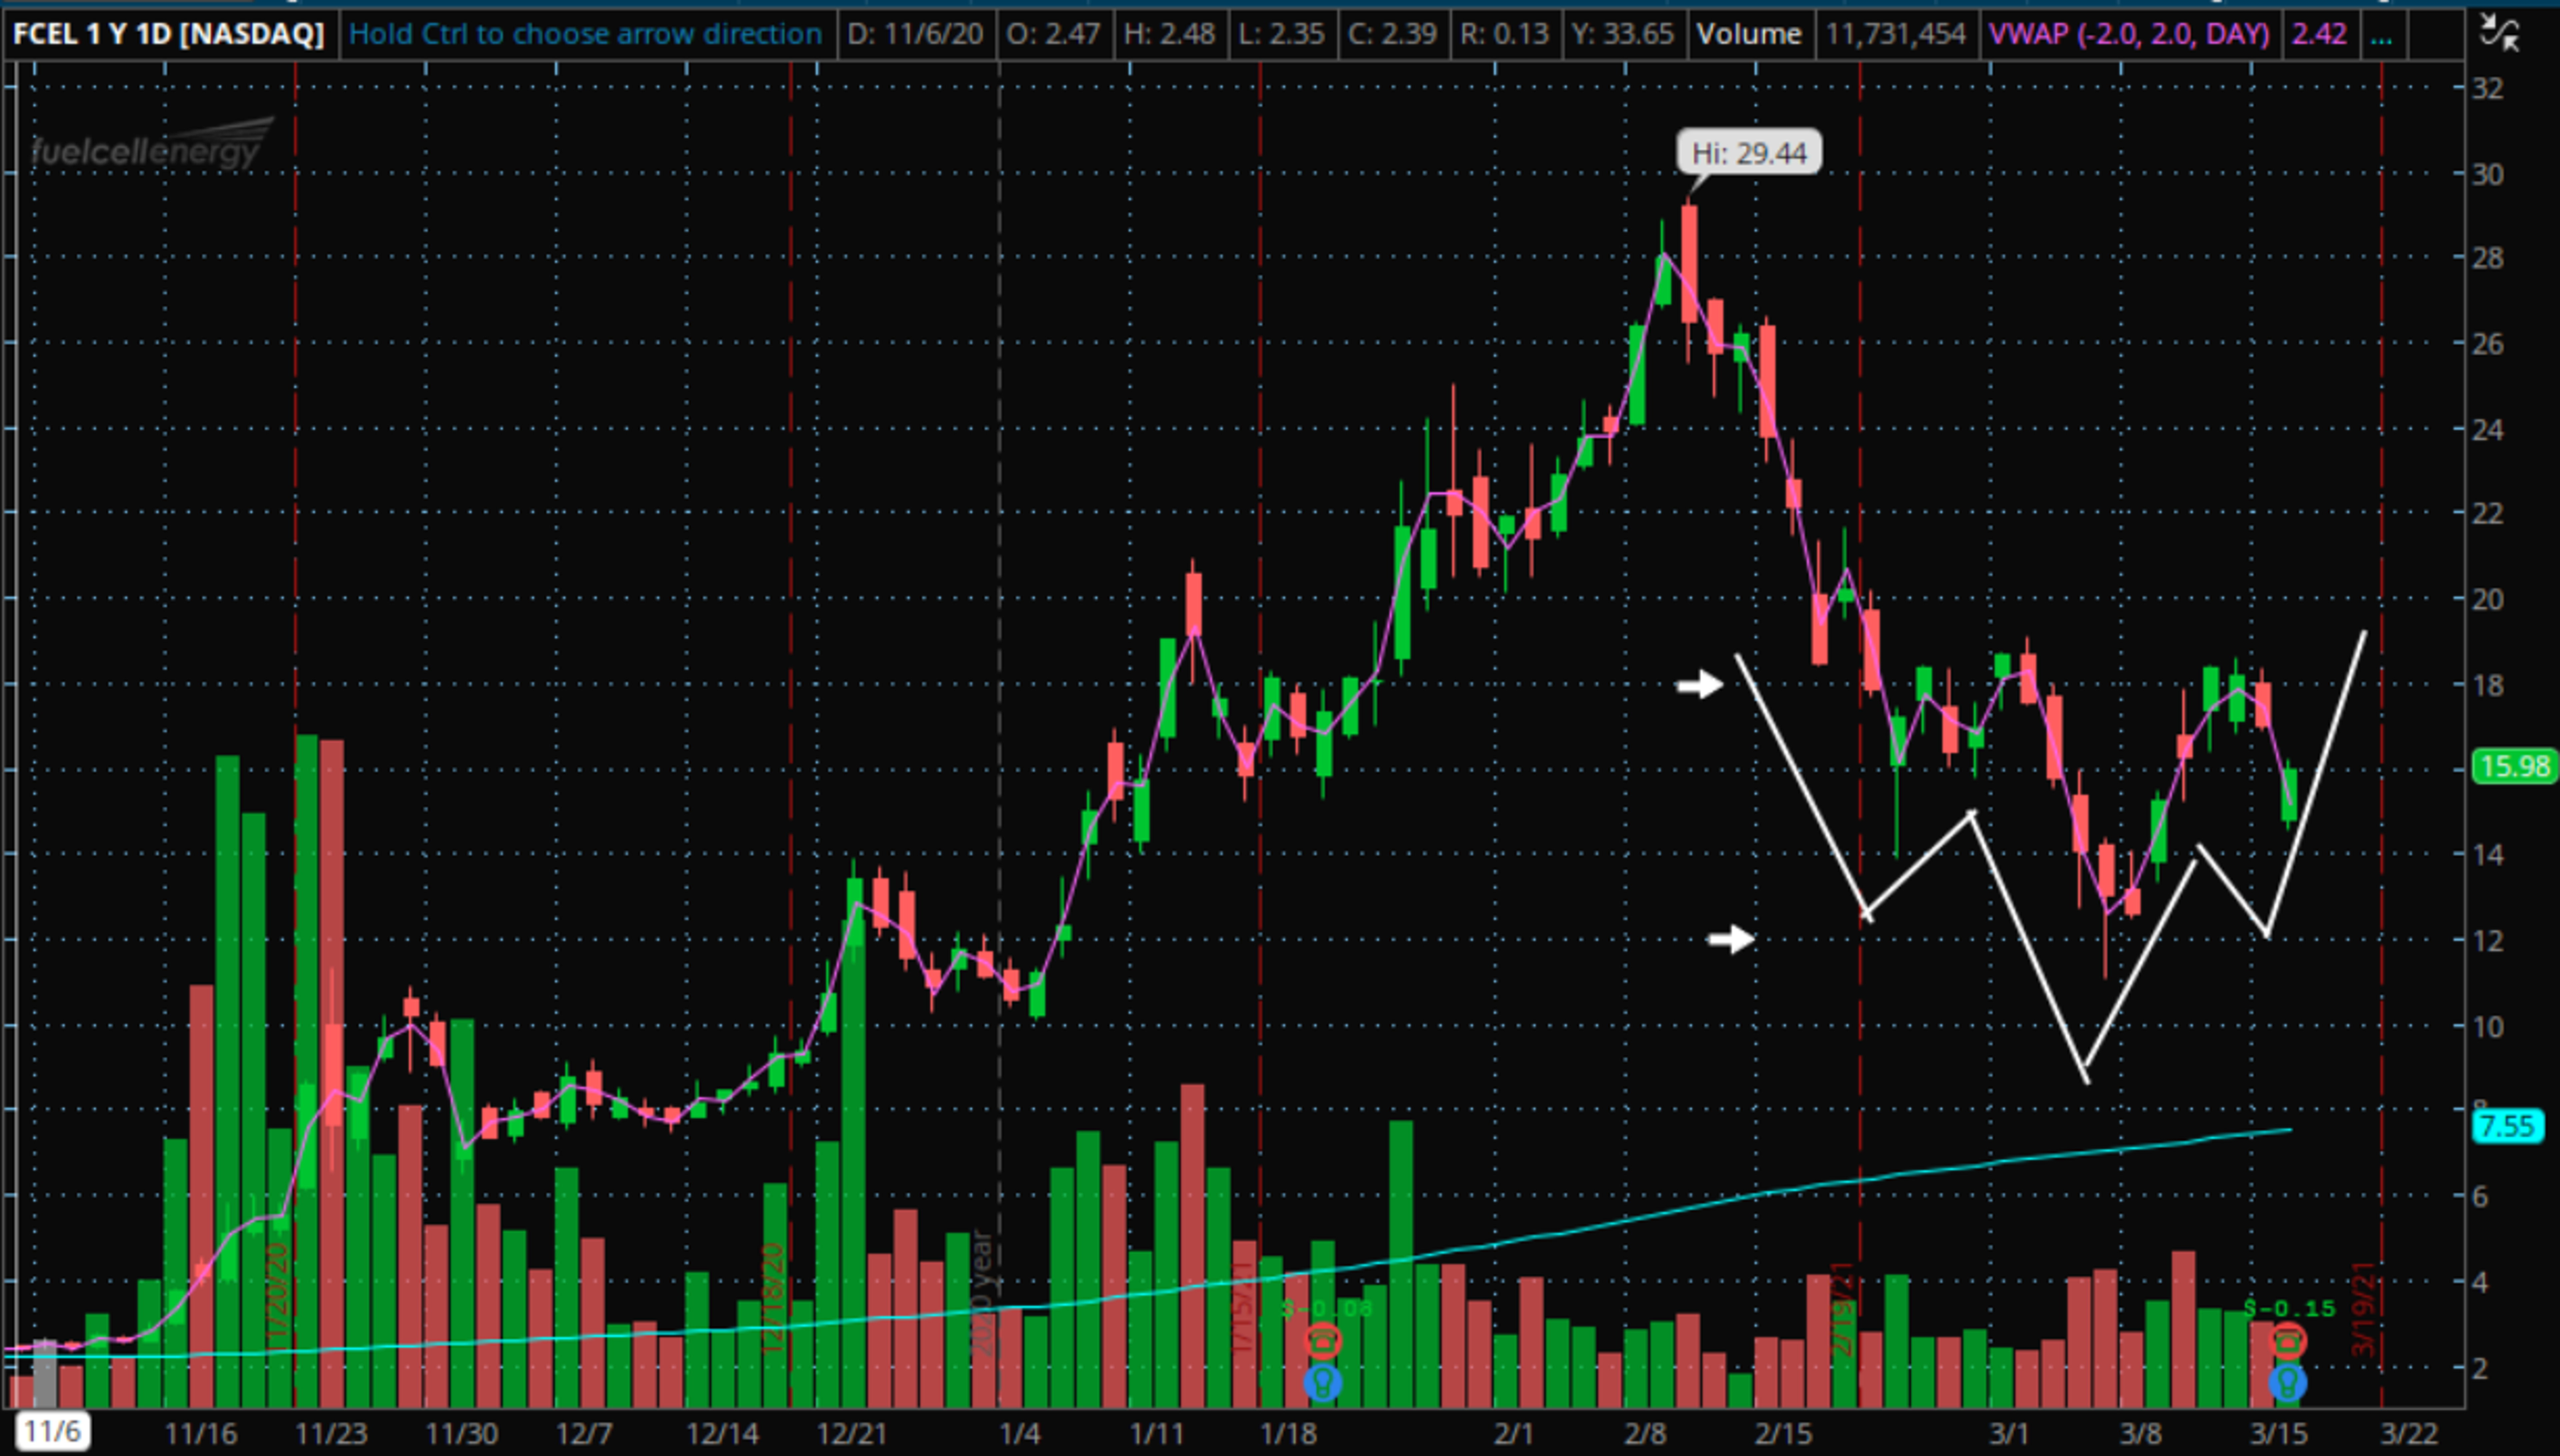
FuelCell Daily Chart Analysis: In the chart above, the stock looks to be trading in a channel between the white arrows.
The bottom arrow is near the price of $12 and the top arrow is near the price of $18.
The stock may potentially be forming what technical traders may call a reverse head-and-shoulders pattern. This pattern is considered a reversal pattern. The stock would need to rise to confirm the pattern.
Bulls would like to see the pattern confirm and the price rise above the $18 level. Bears would like to see the pattern fail and the price fall through the $12 level.
FCEL Price Action: The stock is trading with a market cap of $5.55 billion and a public float of 309 million shares.
The stock was down 4.99% at $16.18 at last check.
Edge Rankings
Price Trend
© 2025 Benzinga.com. Benzinga does not provide investment advice. All rights reserved.
Trade confidently with insights and alerts from analyst ratings, free reports and breaking news that affects the stocks you care about.

