


Issue 39 / What to expect March 31, 2025 thru April 04, 2025
Mar 3
In This Issue
- Market-On-Close: All of last week's market-moving news and macro context in under 5 minutes + futures-at-a-glance
- The Latest Investor Sentiment Readings
- Institutional Support & Resistance Levels For Major Indices: Exactly where to look for support and resistance this week in SPY, QQQ, IWM & DIA
- Institutional Activity By Sector: Institutional order flow by sector including the top institutionally-backed names in those sectors. We break it all down and provide the key insights and take-aways you need to navigate institutional positioning this week.
- Top Institutional Order Flow In Individual Names: All of the largest sweeps and blocks on lit exchanges and hidden dark pools
- Investments In Focus: Bull vs Bear arguments for AIG, EBAY, TXRH
- Top Institutionally-Backed Gainers & Losers: An explosive watchlist for day traders seeking high-volatility
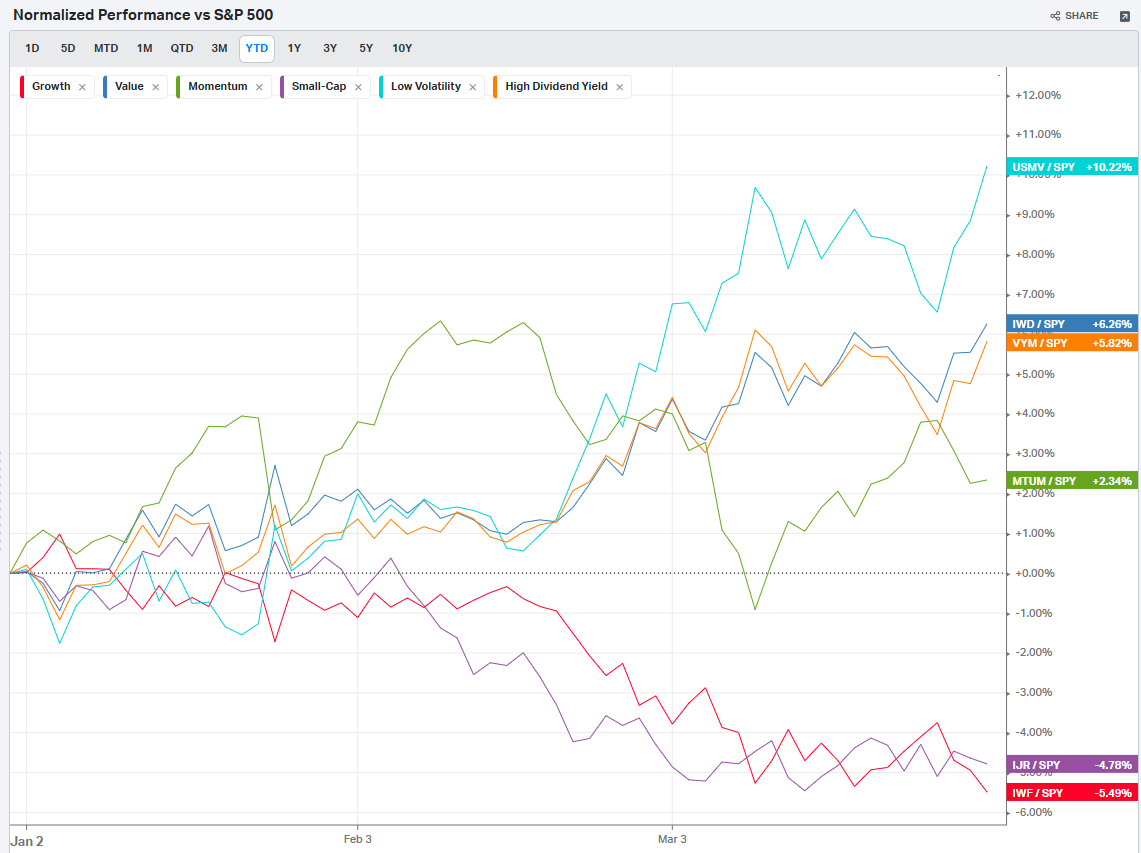
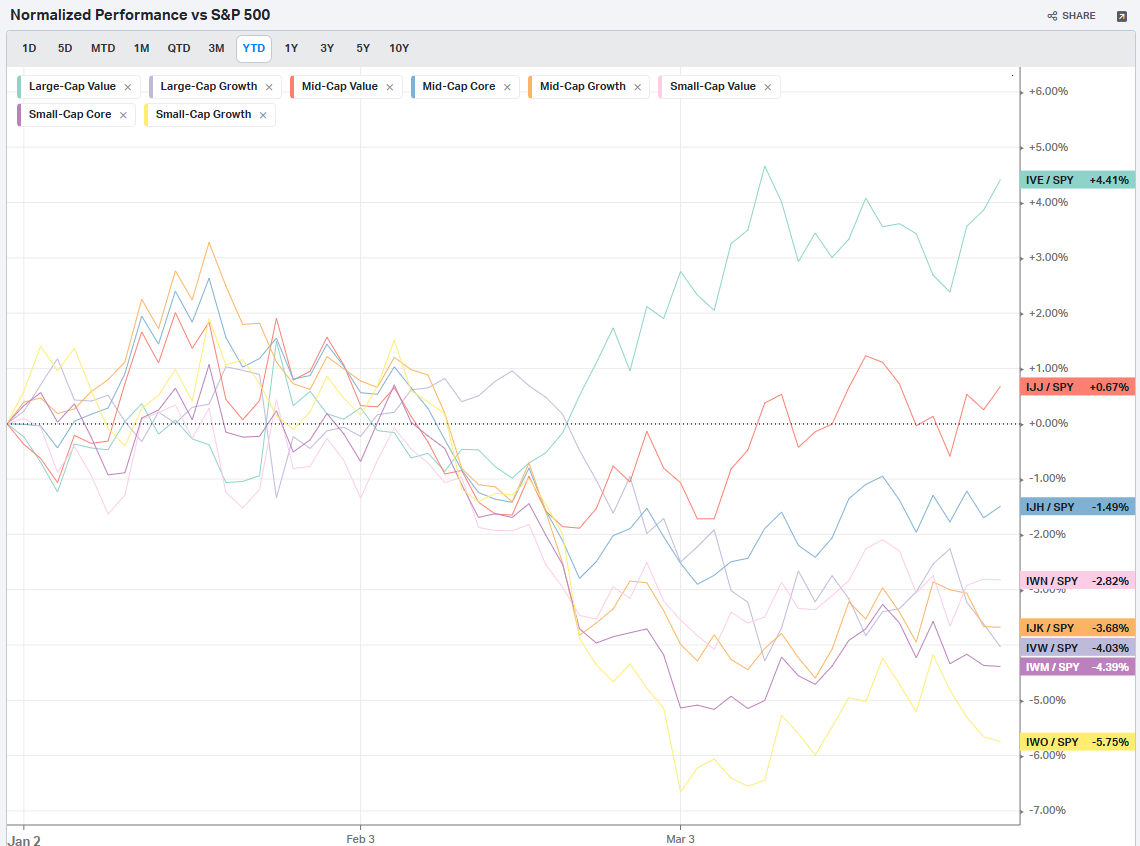
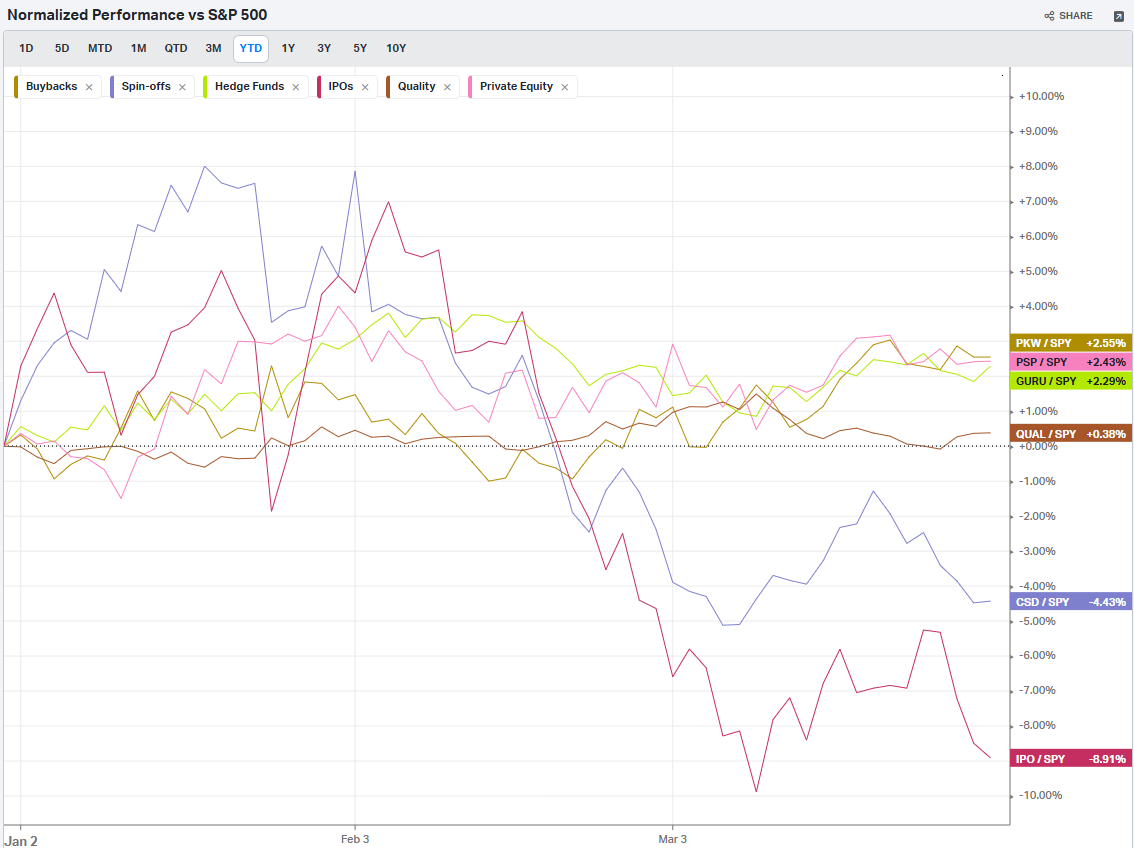
- Normalized Performance By Thematics YTD (Sector, Industry, Factor, Energy, Metals, Currencies, and more): which corners of the markets are beating benchmarks, which ones are overlooked and which ones are over-crowded
- Key Econ Events and Earnings On-Deck For This Week

Market-On-Close
Market Performance and Technical Indicators
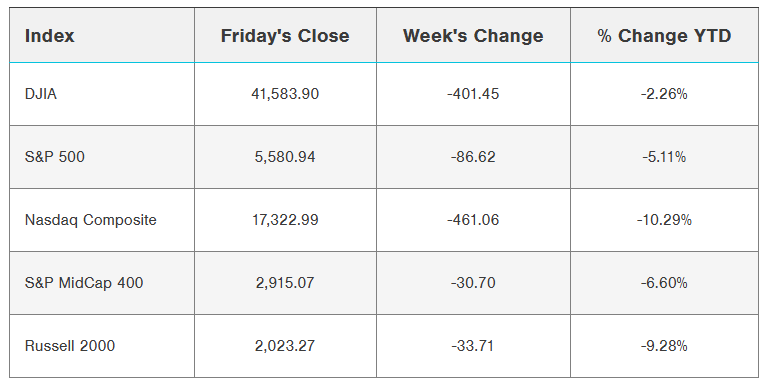
The equity markets closed out the week with significant downside pressure, consolidating a pattern of distribution that’s been developing throughout March. Friday’s session registered decisive negative momentum across all major indices, with the S&P 500 dropping 1.97%, the Dow Jones Industrials shedding 1.69%, and the Nasdaq 100 experiencing the most acute selling pressure at 2.61%. This price action pushed the S&P 500 and Nasdaq 100 to breach their respective two-week support levels, while the Dow retraced to test its one-week support zone. The futures market is continuing to telegraph weakness, with June E-mini S&P futures contracting 2.18% and June E-mini Nasdaq futures exhibiting even greater relative weakness at 2.89%.
The technical damage to the market’s structure is becoming increasingly pronounced. We’re now seeing the fifth negative weekly candle in six weeks for the S&P 500, creating a clear downtrend in the intermediate timeframe. Volume analysis confirms this deteriorating market health, with Bank of America’s examination of EPFR Global data revealing $20.3 billion in U.S. equity outflows for the week ending March 26 – the largest weekly capital exodus this year. This magnitude of fund outflow typically signals a significant repositioning by institutional participants rather than mere tactical adjustments.
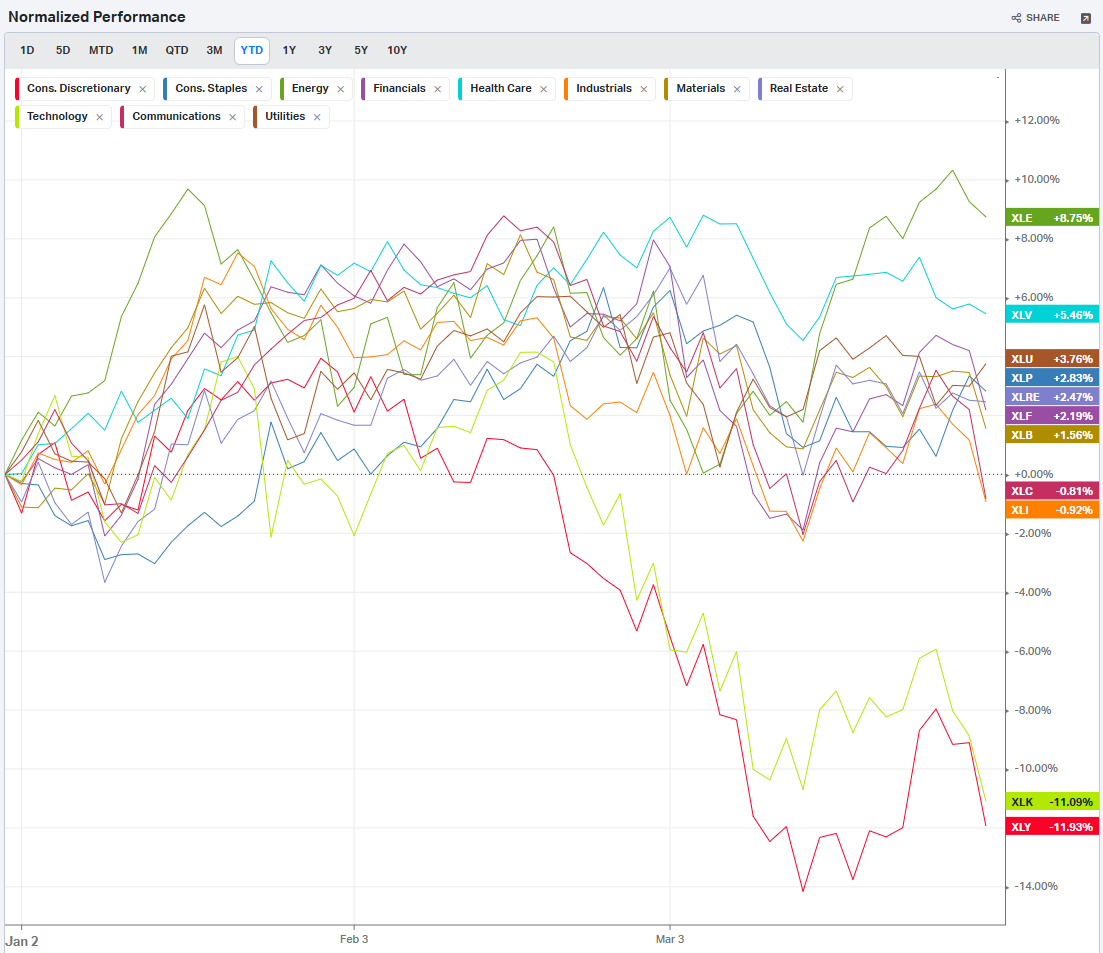
Perhaps the most telling technical development is the pronounced rotation away from last year’s market leadership. The growth-to-value ratio has inverted dramatically, with large-cap growth underperforming value by triple-digit basis points for the week. The growth index declined approximately 2.6% while value stocks demonstrated relative strength, limiting losses to just 0.4%. Year-to-date performance divergence has reached extreme levels, with the growth index down 10.0% against value’s positive 1.2% return. This rotation often indicates a secular shift in market dynamics rather than a temporary adjustment.
Tariff Implementation: Structural Market Catalyst
The primary catalyst driving risk repricing has been the administration’s increasingly defined tariff architecture. The implementation timeline began with the March 4 announcement imposing 25% tariffs on Canadian and Mexican imports alongside the doubling of Chinese tariffs to 20%. This was followed by the March 8 signal of reciprocal and sector-specific tariff implementation effective April 2.
The framework’s scope expanded significantly with Wednesday’s executive action implementing a 25% tariff on all U.S. auto imports effective April 3, initially targeting fully assembled vehicles and expanding to component parts by May 3. The administration’s characterization of these measures as “permanent” with no negotiating parameters has forced market participants to price in structural rather than transitory trade friction.
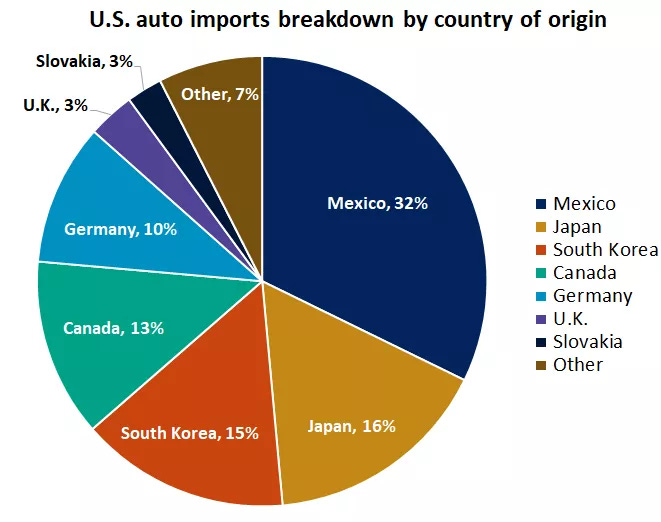
From a sectoral perspective, the automotive vertical faces substantial margin compression given approximately half of the 16 million units sold domestically last year originated from non-U.S. production facilities. The second-order effects will likely manifest in the used vehicle market, maintenance and repair costs, and insurance premiums. An interesting pairs trade has developed, with rental fleet operators experiencing share price appreciation as market participants anticipate enhanced residual values for their vehicle inventories.
The April 2 reciprocal tariff framework represents potentially the most significant trade policy recalibration in decades. The mechanism appears designed to match tariff levels on a country-by-country basis, with possible inclusion of non-tariff barriers such as VATs in the calculation. This graduated approach implies preferential treatment for nations maintaining minimal import barriers for U.S. goods, creating a more nuanced policy than universal tariff application. Additional sector-specific measures targeting lumber and pharmaceuticals are reportedly in advanced development.
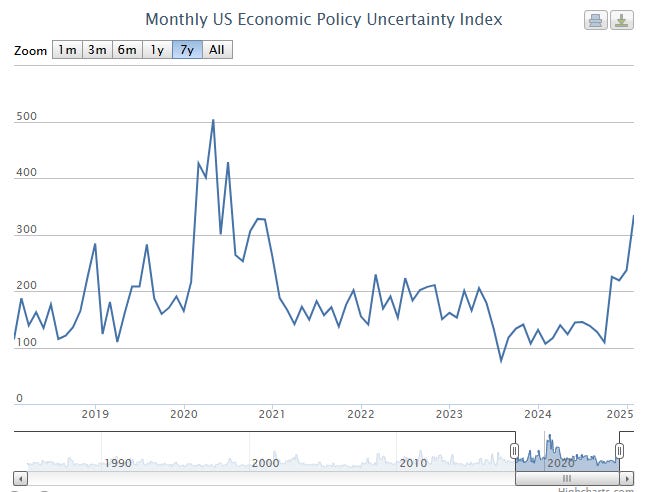
The market’s difficulty in efficiently pricing these policy shifts is evident in the Economic Policy Uncertainty Index, which has reached levels not seen since the initial COVID-19 dislocation. While the April 2 announcement will provide critical details regarding implementation methodology, the subsequent negotiation and potential retaliation dynamics will likely extend price discovery throughout Q2.
Large-Cap Technology: Momentum Reversal
Friday’s session exposed significant technical weakness in the “Magnificent Seven” cohort that has dominated market returns throughout much of 2024. Amazon broke below key support levels with a 4%+ decline, while Alphabet and Meta similarly breached technical support with equivalent percentage losses. Tesla and Microsoft registered declines exceeding 3%, with Apple falling more than 2%. Even Nvidia, which had maintained relative strength in recent sessions, failed to hold support with a decline exceeding 1%.
The semiconductor ecosystem demonstrated even more acute weakness, with ON Semiconductor experiencing a 6%+ breakdown and NXP Semiconductors dropping more than 5%. Broader industry participation in the selloff was evident as Microchip Technology, KLA Corp, Marvell Technology, Intel, Analog Devices, Advanced Micro Devices, GlobalFoundries, Micron Technology, Lam Research, and Qualcomm all breached support levels with 3%+ declines.
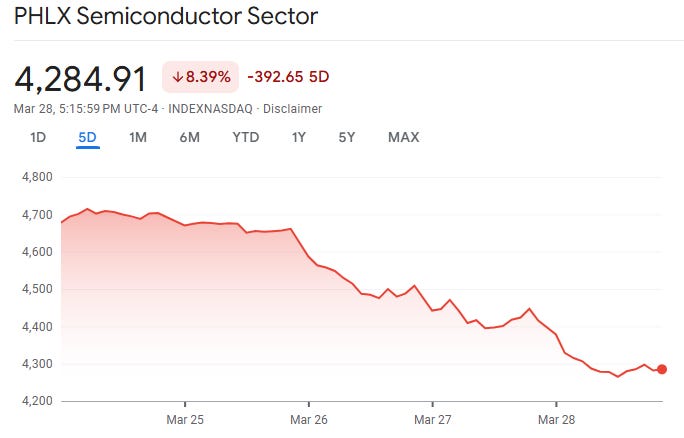
This synchronized breakdown across the technology complex is particularly significant given these companies’ disproportionate index weighting and historical role as market leaders. The sector’s vulnerability stems from its exposure to global supply chain friction and international revenue streams that could face margin compression in a tariff-elevated environment. The magnitude of this correction cannot be understated, with the Magnificent Seven experiencing a 20% drawdown while the broader market has undergone a more standard correction. This separation in performance suggests a potential rotation rather than merely a temporary pullback.
Macroeconomic Cross-Currents: Stagflationary Signals
Friday’s economic data release schedule presented a challenging narrative combination that exacerbated selling pressure. The February personal consumption report registered at 0.4% month-over-month, missing consensus expectations of 0.5% and suggesting demand deceleration. Conversely, personal income expanded 0.8% month-over-month, significantly outpacing the 0.4% consensus forecast and marking the largest monthly gain in 13 months.
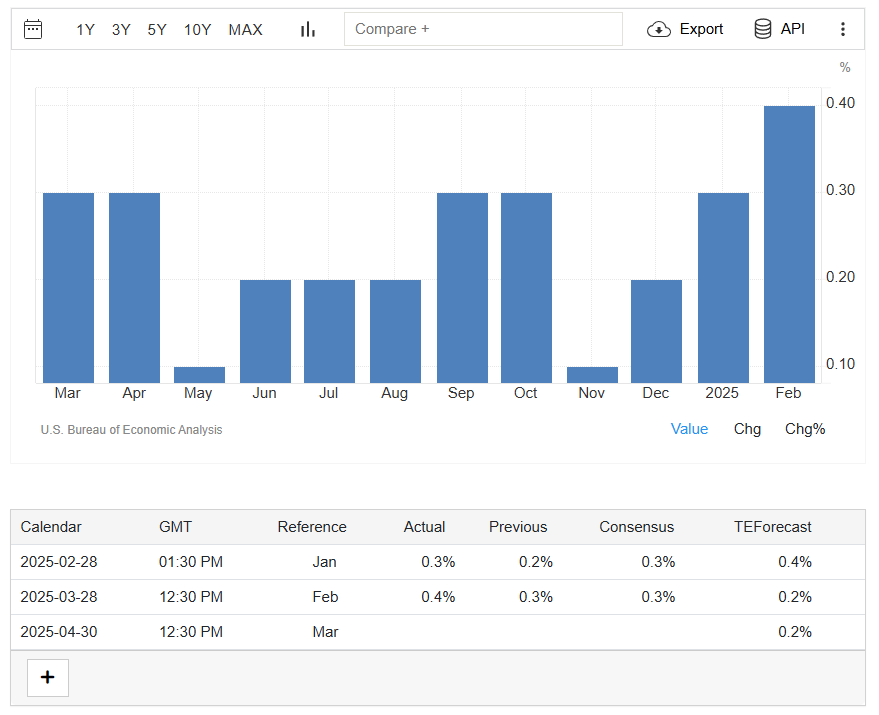
The most consequential data point was the February core PCE price index – the Federal Reserve’s preferred inflation gauge – which came in at 0.4% month-over-month and 2.8% year-over-year, exceeding consensus expectations of 0.3% and 2.7% respectively. This persistent inflation reading maintains significant distance from the Federal Reserve’s 2.0% target, potentially constraining monetary policy flexibility.
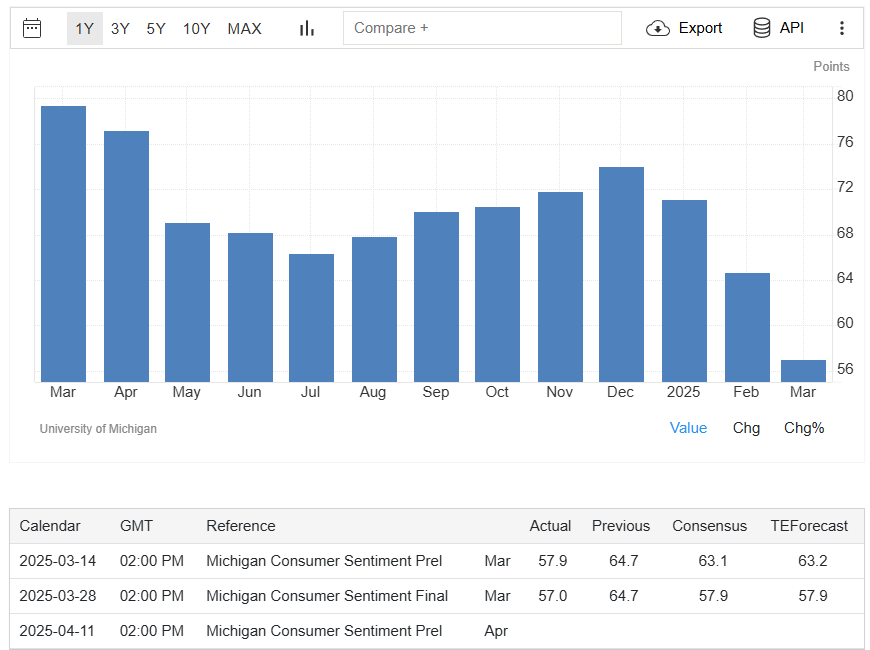
Consumer sentiment metrics demonstrated material deterioration, with the University of Michigan’s March index being revised downward to 57.0 – a 2-1/3 year low and well below the consensus expectation for no revision from the 57.9 preliminary reading. This represented a 12% month-over-month sentiment contraction, highlighting increasing consumer caution. The forward-looking expectations component registered an even more severe 18% decline, reflecting building anxiety about future economic conditions.
Perhaps most troubling from a monetary policy perspective was the inflation expectations component, with the March 1-year indicator rising to a 2-1/3 year high of 5.0% against expectations of 4.9%. The longer-term 5-10 year inflation expectations indicator reached a 32-year high of 4.1%, exceeding the 3.9% consensus forecast. This marked the third consecutive month with inflation expectations jumping at least 50 basis points, suggesting potential de-anchoring of price stability expectations.
The Conference Board’s consumer confidence index demonstrated similar weakness, declining for the fourth consecutive month to 92.9 from February’s 100.1 reading. The expectations component dropped 9.6 points to 65.2 – its lowest level in 12 years – and remained below the critical 80 threshold that historically signals recessionary conditions. The report specifically noted that future income optimism had “largely vanished,” indicating consumer caution is transitioning from abstract concerns to concrete household financial planning.
Business Activity: Leading Sector Divergence
Business activity metrics display increasing sector bifurcation. S&P Global’s Flash Composite PMI registered at 53.5 for March, indicating business expansion accelerating from February levels as service sector resilience offset manufacturing weakness. However, forward-looking indicators paint a more cautious picture, with business expectations for the next 12 months deteriorating to the second-lowest level since October 2022, with respondents specifically citing concerns about demand conditions and policy impacts.
The input price component exhibited the most rapid acceleration in nearly two years, primarily attributable to tariff implications and labor cost pressures. This leading price indicator suggests potential for consumer price pressures in coming quarters as businesses implement pass-through pricing strategies.
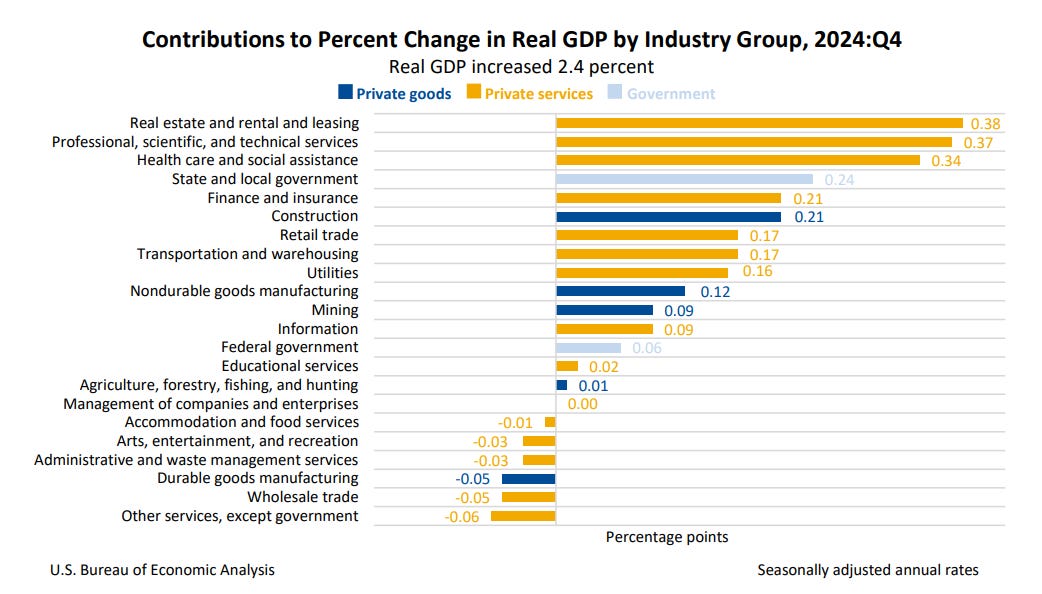
The broader growth trajectory shows Q4 2024 GDP at a 2.4% annualized rate, moderating from Q3’s 3.1% pace but slightly exceeding initial estimates. The consensus expectation for Q1 2025 points to sub-2.0% growth when preliminary data is released on April 30, marking continued deceleration in the economic expansion.
Monetary Policy Positioning: Fed Communications Analysis
Federal Reserve communications reflect increasing internal debate regarding appropriate policy calibration. Boston Fed President Collins directly addressed the tariff impact, stating that it “inevitably” increases inflation pressure, at least in the near term. Richmond Fed President Barkin highlighted that rapid trade policy adjustments have created “a sense of instability” in the business community, with sentiment degradation potentially leading to demand contraction.
The most dovish perspective came from San Francisco Fed President Daly, who suggested a measured approach to assessing tariff impacts and maintained her projection for two 25 basis point rate reductions in 2025 as “reasonable.” This divergence in FOMC member commentary indicates the complex balancing act required between inflation management and growth support.
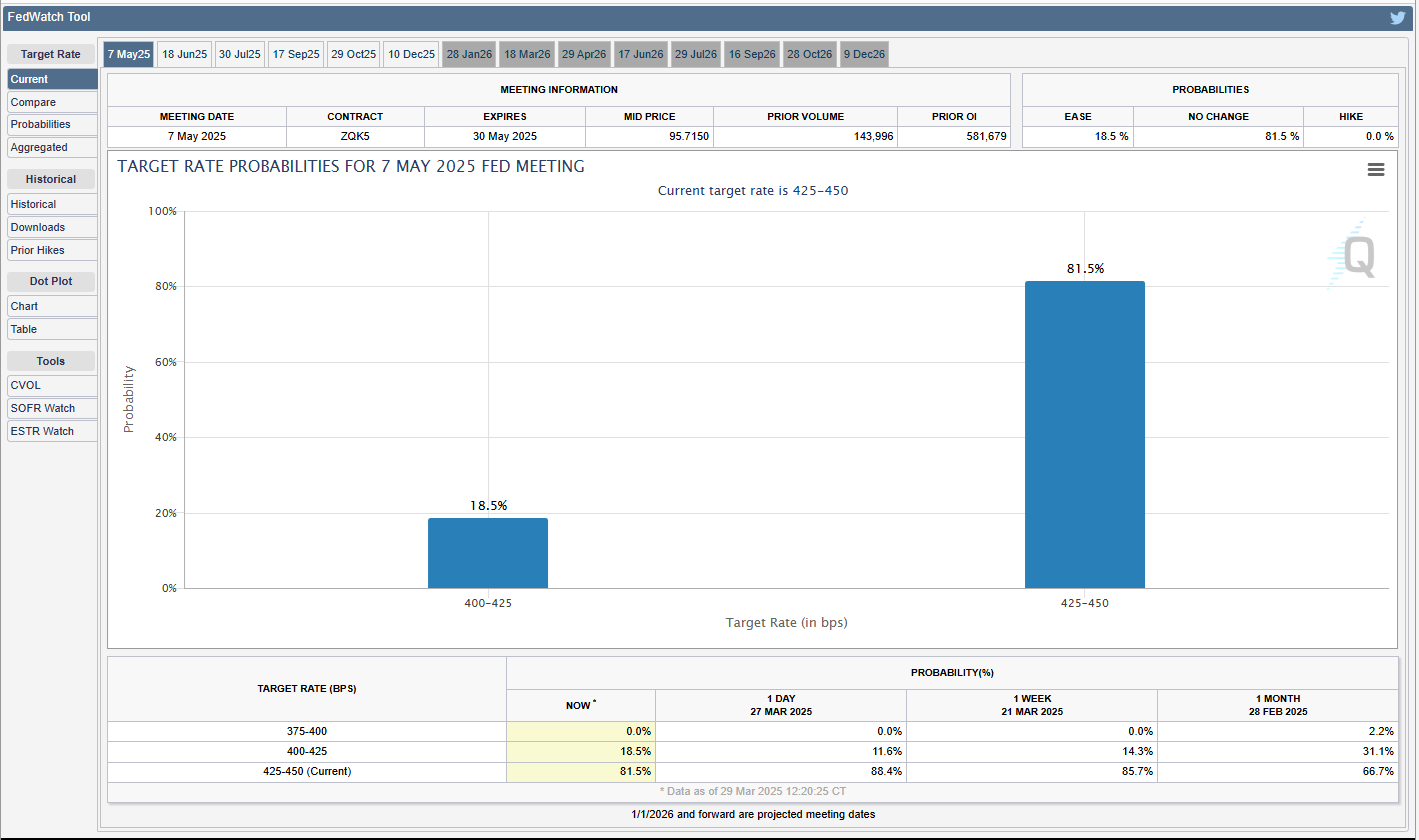
Rate expectations have adjusted accordingly, with swaps markets now pricing two quarter-point reductions by year-end versus the three cuts projected earlier in Q1. Near-term easing expectations have been particularly impacted, with markets assigning just 21% probability to a 25 basis point cut at the May 6-7 FOMC meeting, effectively removing this meeting from consideration for policy adjustment.
Fixed Income Dynamics: Flight to Quality
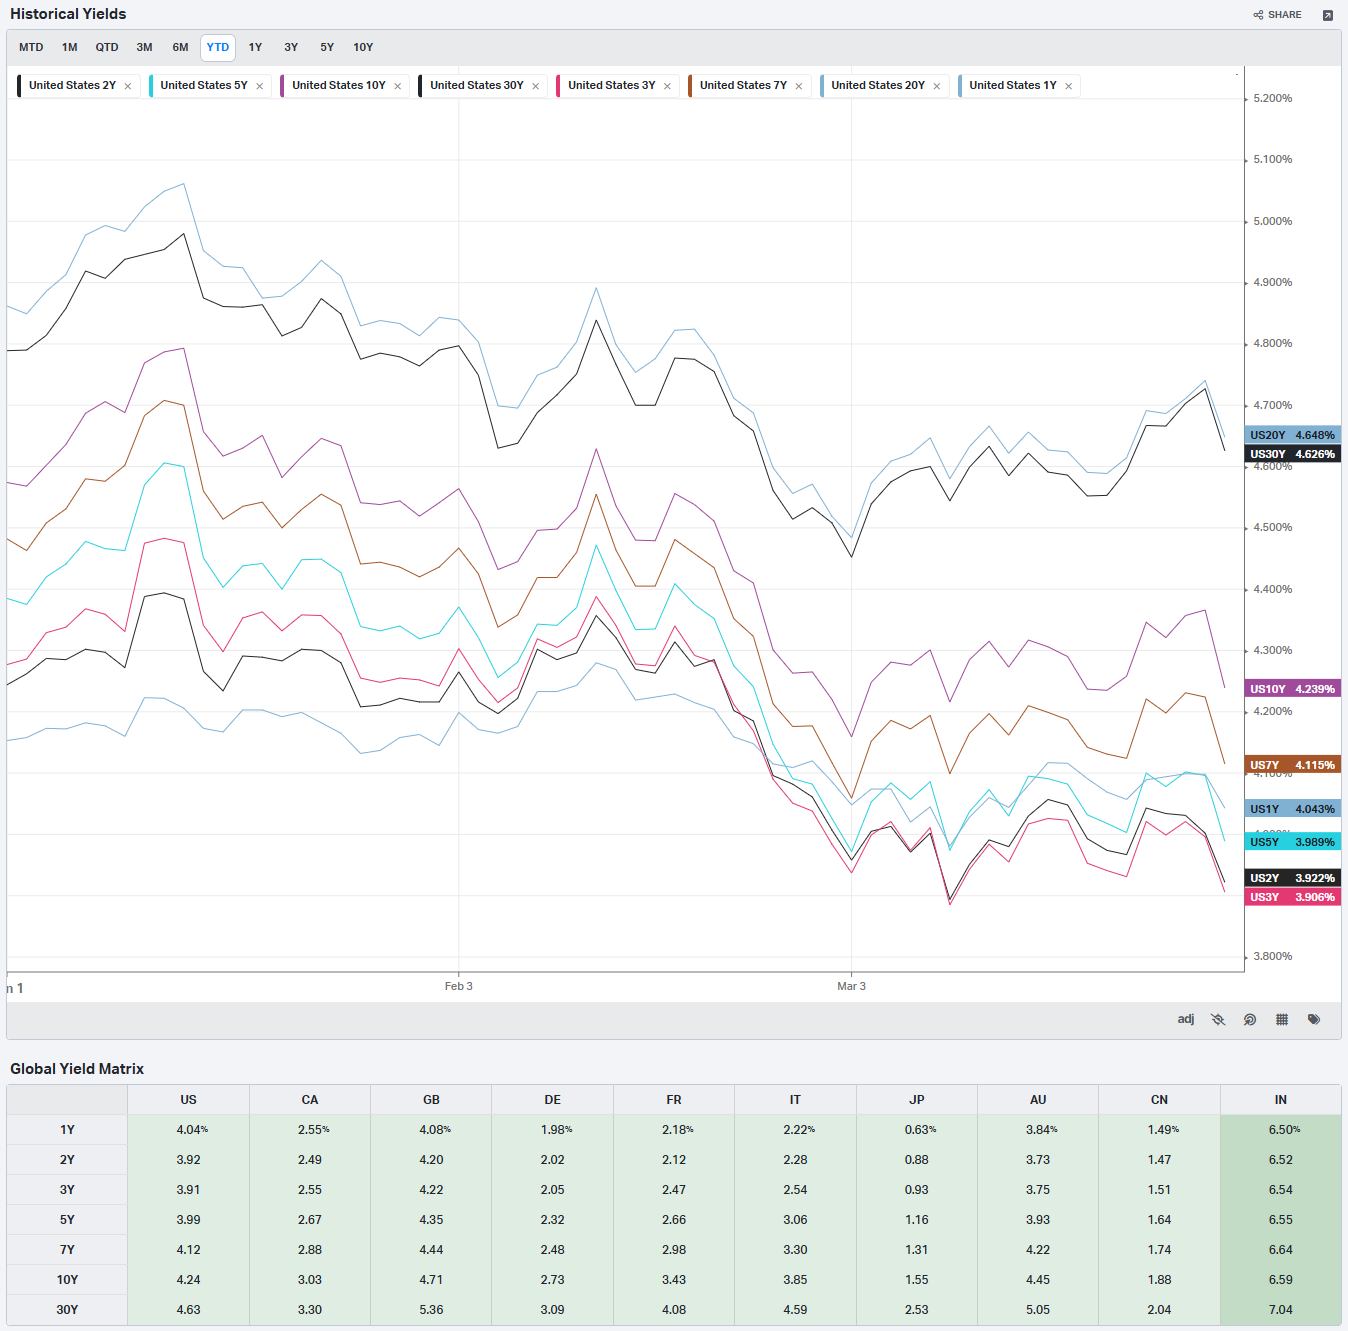
The Treasury complex demonstrated classic flight-to-quality behavior, with June 10-year T-note futures advancing 25 ticks on Friday as the benchmark yield declined 9.9 basis points to 4.261%. This rally was supported by technical strength in 10-year German bunds, which reached three-week highs, and supply relief following the completion of Treasury auctions totaling $211 billion.
The yield curve response accelerated following the University of Michigan sentiment data release, with dovish comments from San Francisco Fed President Daly providing additional support for duration exposure.
European sovereign debt markets demonstrated similar technical patterns, with the 10-year German bund yield reaching a three-week low of 2.707% before closing down 4.6 basis points at 2.727%. UK gilts outperformed, with the 10-year yield compressing 8.9 basis points to 4.694%.
European economic indicators generally underperformed expectations, with the Eurozone March economic confidence index declining 1.1 to 95.2 versus consensus forecasts for improvement to 96.7. The German labor market showed particular weakness, with March unemployment increasing by 26,000 against expectations of 10,000. The unemployment rate rose 0.1 to a 4-1/2 year high of 6.3%, exceeding consensus expectations for stability at 6.2%.
Despite these contractionary signals, European inflation indicators remain elevated, with the ECB’s February 1-year inflation expectations holding at 2.6%, above the 2.5% consensus forecast. Market pricing now assigns 85% probability to a 25 basis point rate cut by the ECB at its April 17 meeting, reflecting expectations for accommodation in response to growth deceleration.
Sector Rotation and Price Action Analysis
The recent market environment has produced significant performance dispersion across sectors, with defensive positioning increasingly favored. Friday’s Treasury rally supported rate-sensitive utility stocks, with American Electric Power, CenterPoint Energy, Edison International, FirstEnergy, Eversource Energy, Ameren, and Public Service Enterprise Group all advancing more than 1%.
Cyclical and leisure-oriented equities experienced disproportionate pressure, with Delta Air Lines, Las Vegas Sands, Royal Caribbean Cruises, Wynn Resorts, Carnival, and United Airlines all dropping more than 4%. MGM Resorts International and Norwegian Cruise Line Holdings declined more than 3%, while Booking Holdings and Hilton Worldwide Holdings contracted more than 2%.
Individual equity movements of note included Lululemon Athletica, which experienced a 14%+ breakdown after providing forward revenue guidance of $11.15-11.30 billion for 2026, below the $11.31 billion consensus projection. Oxford Industries dropped more than 5% after issuing Q1, adjusted EPS guidance of $1.70-1.90, significantly below the $2.73 consensus expectation.
Positive outliers included WR Berkley, which rallied more than 7% to lead S&P 500 gainers after announcing Mitsui Sumitomo Insurance’s agreement to acquire 15% of outstanding shares. AppLovin advanced more than 4% to lead Nasdaq 100 gainers following Loop Capital Markets’ designation as a top pick with recommendation for “aggressive buying” on pullbacks.
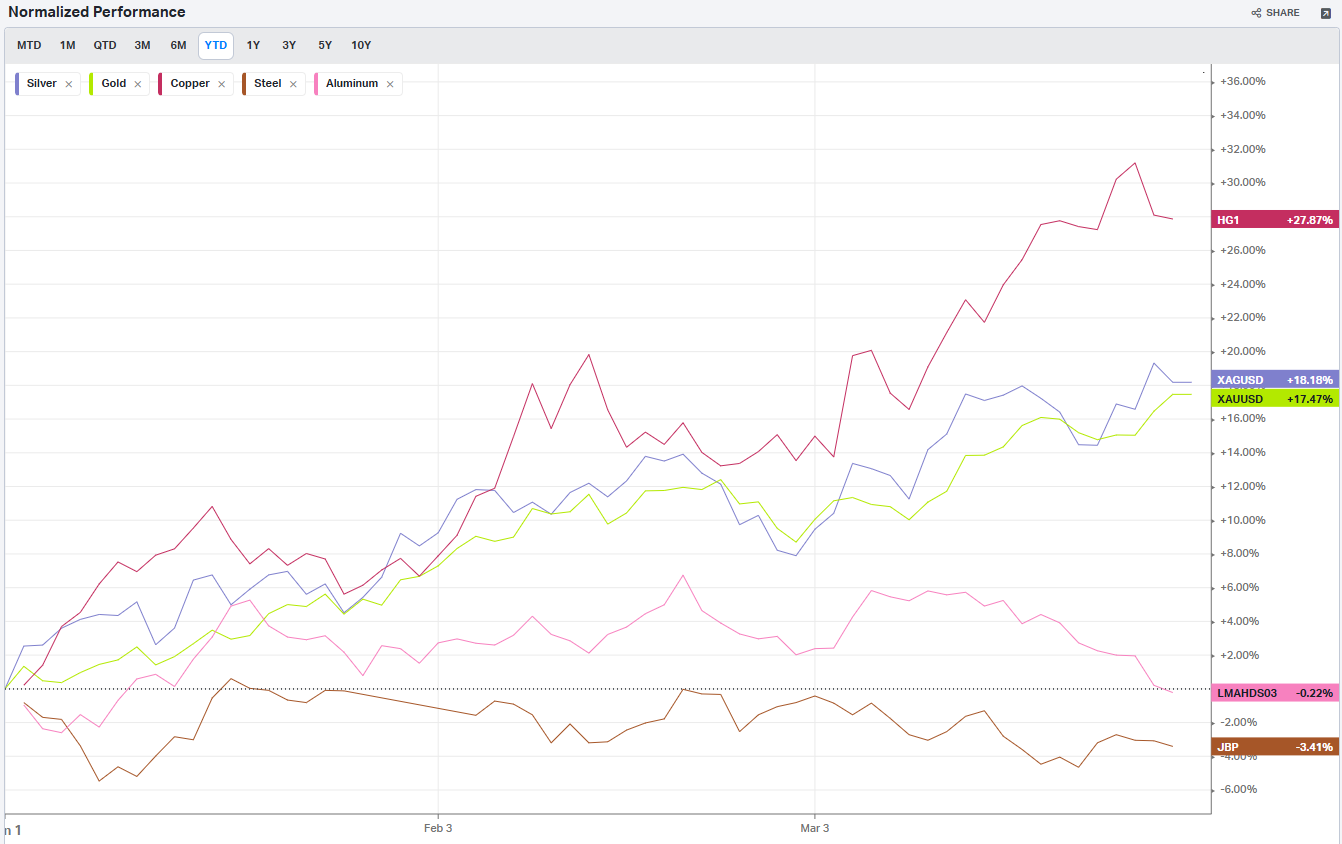
The precious metals complex benefited from macro uncertainty, with AngloGold Ashanti gaining more than 2% as gold reached a new all-time high above $3,100 per ounce. The yellow metal closed Friday’s session around $3,116, extending year-to-date appreciation to approximately 17% as investors sought safe-haven exposure during heightened economic and policy uncertainty.
Commodity Market Technical Analysis
Commodity markets have displayed significant technical divergence as macroeconomic and policy dynamics evolve. Gold has maintained its uptrend integrity with a fourth consecutive weekly gain, extending its year-to-date rally to 17%. The technical breakout above key resistance at $3,000 has accelerated momentum as the metal fulfills its traditional function during periods of elevated inflation and policy uncertainty.
The energy complex has underperformed amid demand concerns, with consensus Brent crude forecasts revised downward to $71 per barrel based on U.S. growth deceleration expectations and OPEC+’s decision to implement flexible production adjustments. The technical structure for crude oil remains negative, with key support levels vulnerable to further pressure.
Industrial metals have shown mixed technical patterns. Copper temporarily breached psychological resistance at $10,000 following tariff discussion reports before consolidating at $9,846.50. The base metals complex remains highly sensitive to both growth expectations and evolving trade policy frameworks.
International Market Correlation Analysis
U.S. trade policy developments have triggered synchronized risk-off responses across international markets. The Euro Stoxx 50 dropped to two-week support levels with a 0.92% decline, while China’s Shanghai Composite contracted 0.67%. Japanese equities demonstrated particular weakness, with the Nikkei 225 falling to two-week support and closing down 1.80%.
European markets face disproportionate exposure to automotive tariff implications, with the sector representing 7% of the German DAX versus just 2% of the S&P 500. This structural difference explains the relative underperformance of European indices during recent sessions.
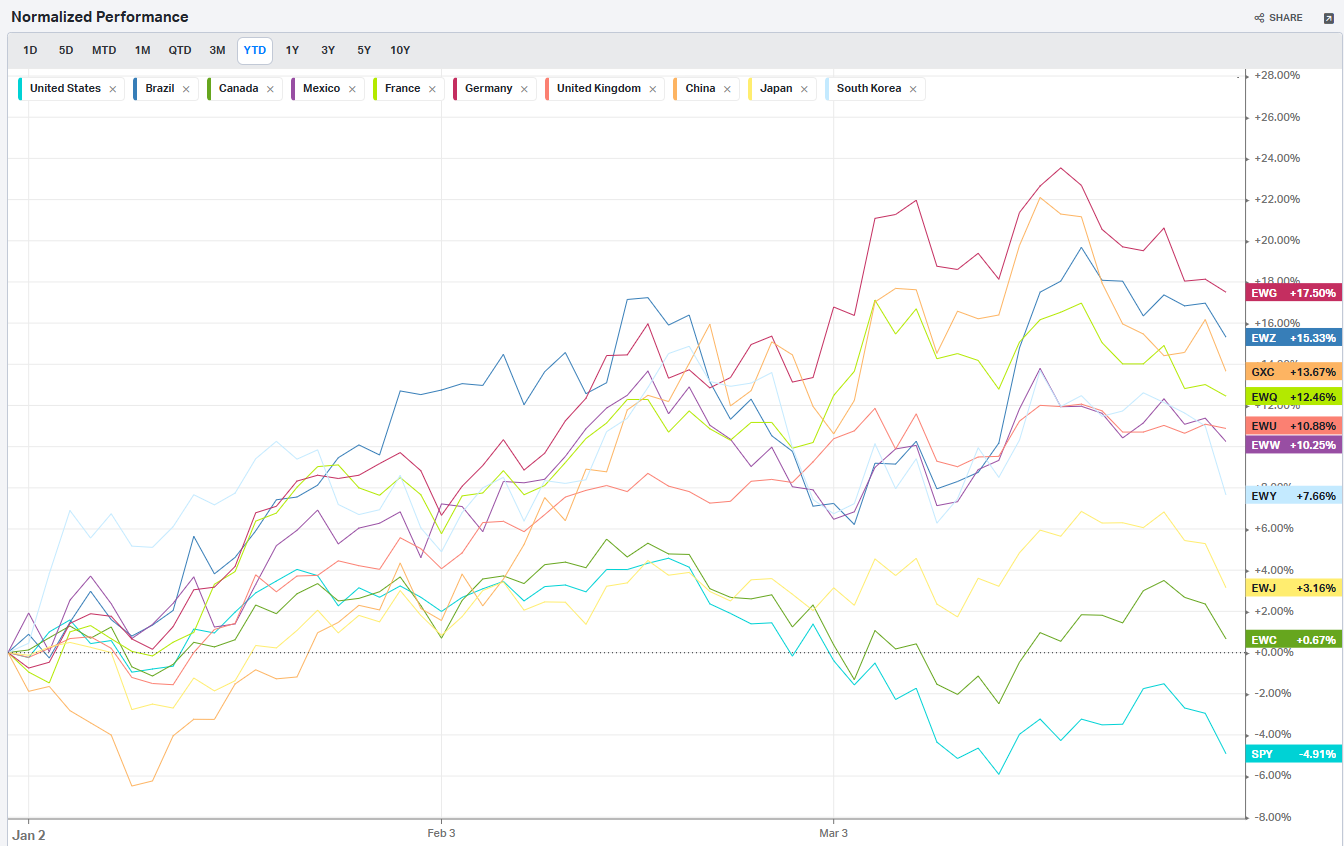
Emerging markets have displayed notable technical divergence, with certain markets significantly outperforming U.S. equities. China, Korea, and Brazil have generated double-digit returns, while India and Taiwan have registered negative performance. This dispersion likely reflects varying degrees of direct exposure to U.S. trade policy, with markets like India, which exports relatively little to the U.S., demonstrating resilience to tariff implications.
Technology Infrastructure: Capacity Utilization Concerns
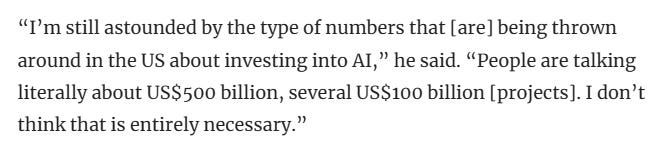
Beyond immediate trade policy considerations, the technology sector faces emerging capacity utilization challenges in AI infrastructure deployment. Alibaba Chairman Joe Tsai has identified potential speculative excess in datacenter expansion, noting that “people are investing ahead of the demand they are seeing today.” This assessment gained credibility following reports that Microsoft has cancelled or deferred datacenter projects in the U.S. and Europe equivalent to approximately two gigawatts of electricity capacity, citing oversupply in AI computing clusters.

These developments raise fundamental questions regarding the sustainability of AI-driven capital expenditure that has supported technology valuations in recent quarters. The sector’s 5.91% weekly decline suggests investors are recalibrating growth expectations for AI-related investments based on utilization rates rather than merely deployment metrics.
Forward Catalysts and Market Timing
Several high-impact catalysts will shape near-term market direction. President Trump’s April 2 reciprocal tariff announcement will provide essential clarity regarding implementation methodology, scope, and timing. The market’s reaction will depend on the extent to which countries receive exemptions or pursue retaliatory measures, determining the ultimate economic impact of these policies.
Friday’s non-farm payroll report will confirm whether the moderation in jobs creation observed in early 2025 extended into March. February’s 151,000 job additions represented marginal improvement from January’s 125,000 but remained well below late-2024 levels. This data will provide critical insight into labor market resilience amid increasing uncertainty.
The initial Q1 2025 GDP estimate on April 30 will deliver comprehensive assessment of how the economy has responded to recent policy shifts and inflationary pressures. Consensus expectations for sub-2.0% growth would represent material deceleration from Q4’s 2.4% expansion rate.
Portfolio Construction Implications
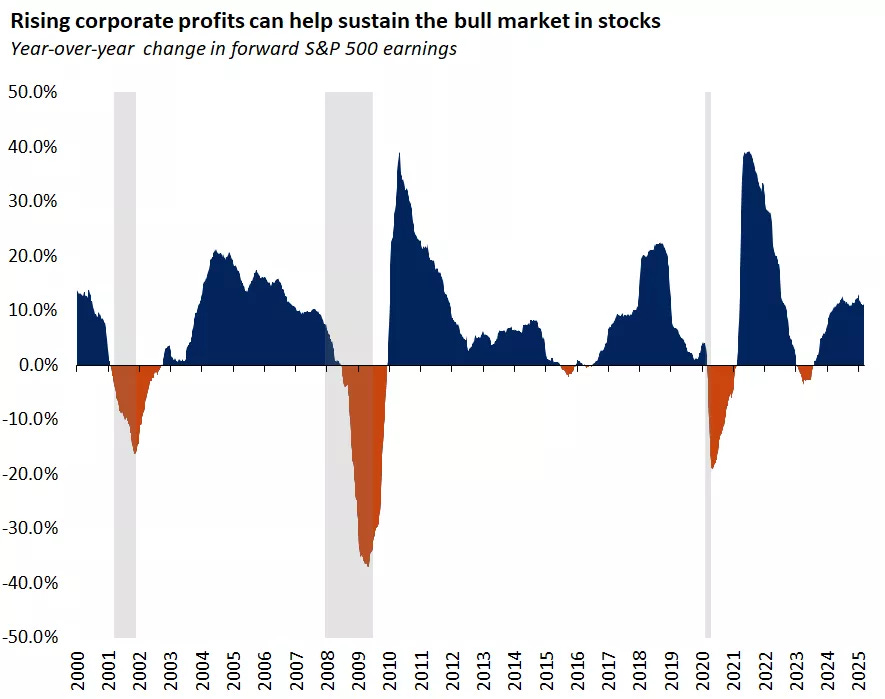
The current market environment requires tactical precision combined with strategic positioning. Core economic fundamentals remain constructive despite recent volatility, suggesting trade developments may not trigger recessionary conditions. Corporate profit trajectories continue to point to full-year growth exceeding 10%, well above the 6-7% long-term average. Labor market metrics reflect moderation rather than deterioration, with private sector job creation maintaining levels above the 100,000-120,000 monthly threshold required to accommodate labor force expansion.
Monetary policy positioning, while restrictive, appears unlikely to tighten further. Financial condition indicators remain generally supportive, with high-yield credit spreads – which typically function as early warning indicators for economic stress – maintaining historically tight ranges that do not yet signal significant concern.
The persistence of trade policy uncertainty makes V-shaped market recovery improbable in the immediate term. However, historical precedent suggests current pullbacks may present accumulation opportunities for strategic positioning if earnings and economic growth remain positive. Current sentiment deterioration creates asymmetric potential for positive surprises if developments prove less negative than current pricing implies.
From an allocation perspective, the year’s rotation from previous market laggards to former underperformers likely continues, though with substantial variance based on trade tension evolution. Balanced exposure between growth and value factors provides optimal positioning in this environment. Sectors with minimal tariff exposure and attractive valuations – particularly healthcare and financials – offer compelling risk-adjusted return potential. Financial equities may benefit disproportionately from potential pro-growth policies that could emerge as the administration pivots from trade to broader economic priorities.
Multi-asset diversification has rarely been more critical for navigating current volatility regimes. Fixed-income allocations provide essential portfolio stabilization during equity market dislocations, while the unusually wide range of potential outcomes emphasizes the importance of disciplined long-term positioning rather than reactive tactical shifts based on headline catalysts.
Strategic Framework: Volatility as Opportunity
The recent correction reflects legitimate concerns regarding trade policy implications and inflation persistence. However, these developments should be contextualized within an economy demonstrating fundamental resilience. Corporate profitability maintains structural integrity, labor markets show moderation rather than collapse, and monetary policy, while restrictive, is not actively tightening.
As implementation details crystallize in coming weeks, markets will recalibrate from speculation-driven positioning to evidence-based assessment of economic impact. This process will likely generate continued volatility but ultimately create tactical opportunities for those maintaining discipline and focusing on fundamental value rather than price action.
The leadership transition from growth to value and the correction in technology momentum stocks represents healthy market rebalancing rather than necessarily indicating broader economic distress. While tactical caution remains warranted given the fluid policy environment and mixed economic signals, the structural foundation for continued expansion and eventual market recovery remains intact for patient, disciplined investors capable of distinguishing between noise and signal.
5-Day Futures Performance Leaders
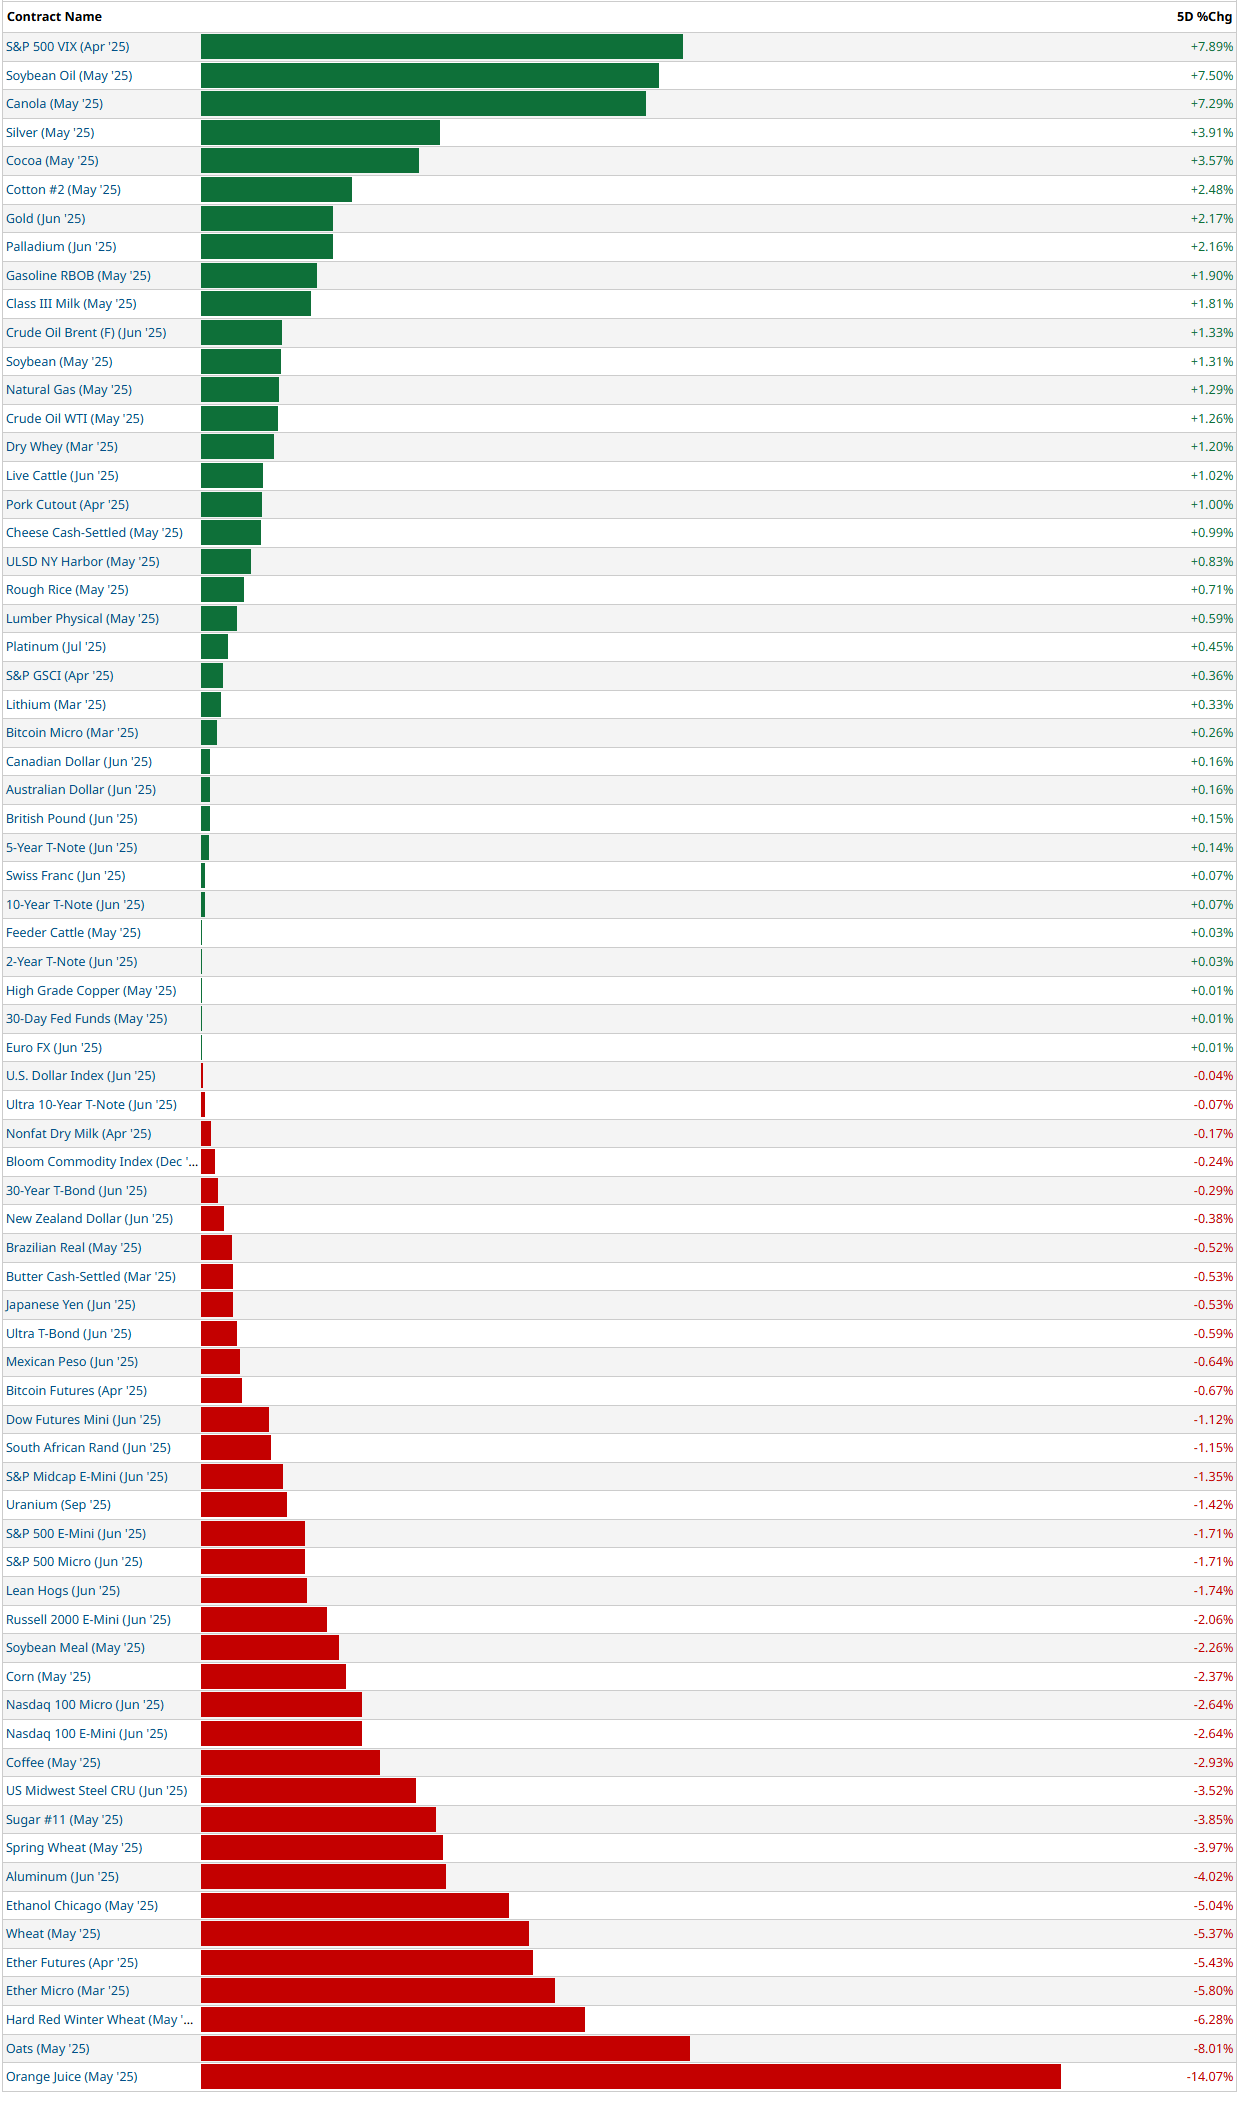
📈 Top Gainers:
Soybeans, Canola, and Other Agricultural Commodities
- Concerns over dry weather in Brazil affecting crop yields have supported prices for soybeans and canola.
Silver and Gold
- Rising geopolitical tensions and expectations for rate cuts later this year increased safe-haven demand.
S&P 500 VIX (Volatility Index)
- Volatility surged after a sharp tech-led pullback in equities, especially with the Fed’s cautious tone around interest rates. This unexpected rise in inflation, combined with disappointing consumer sentiment and the announcement of new tariffs, also contributed to significant market volatility
📉 Top Losers:
Orange Juice
- Prices fell sharply after forecasts of higher-than-expected Florida orange production eased supply concerns.
Ether (ETH) Futures
- Ethereum experienced a selloff due to profit-taking and concerns about upcoming regulatory measures on staking.
Wheat & Oats
- A combination of improving crop conditions in the U.S. Midwest and lower export demand pushed prices down.
Coffee & Sugar
- Brazil's improved weather forecasts led to expectations of higher production in the coming season.
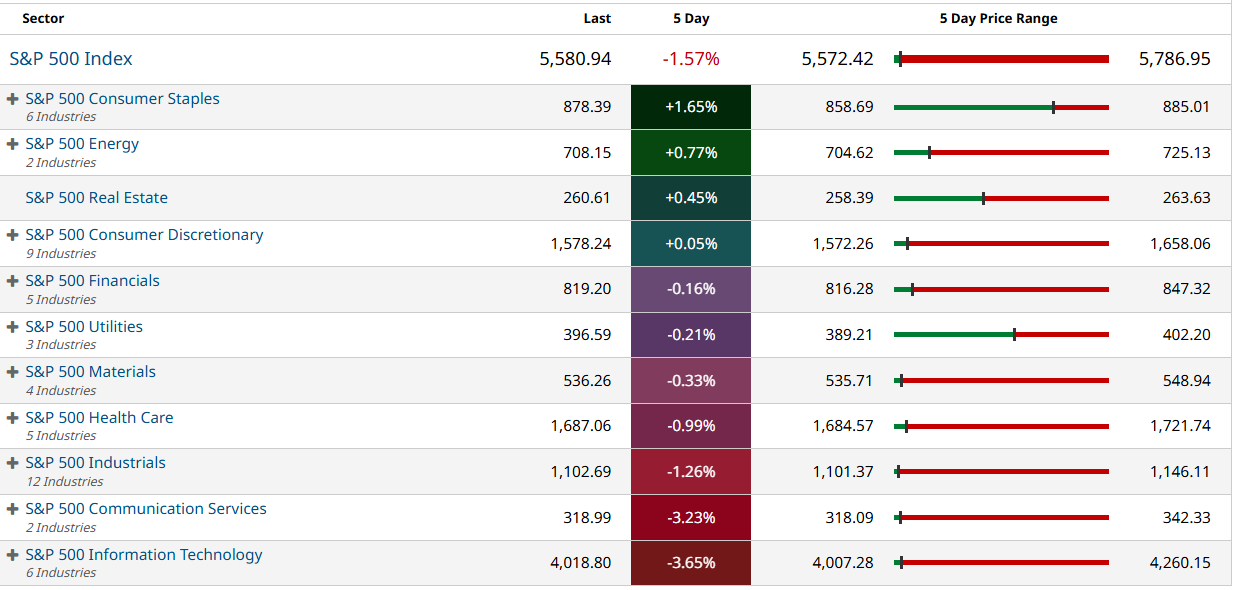
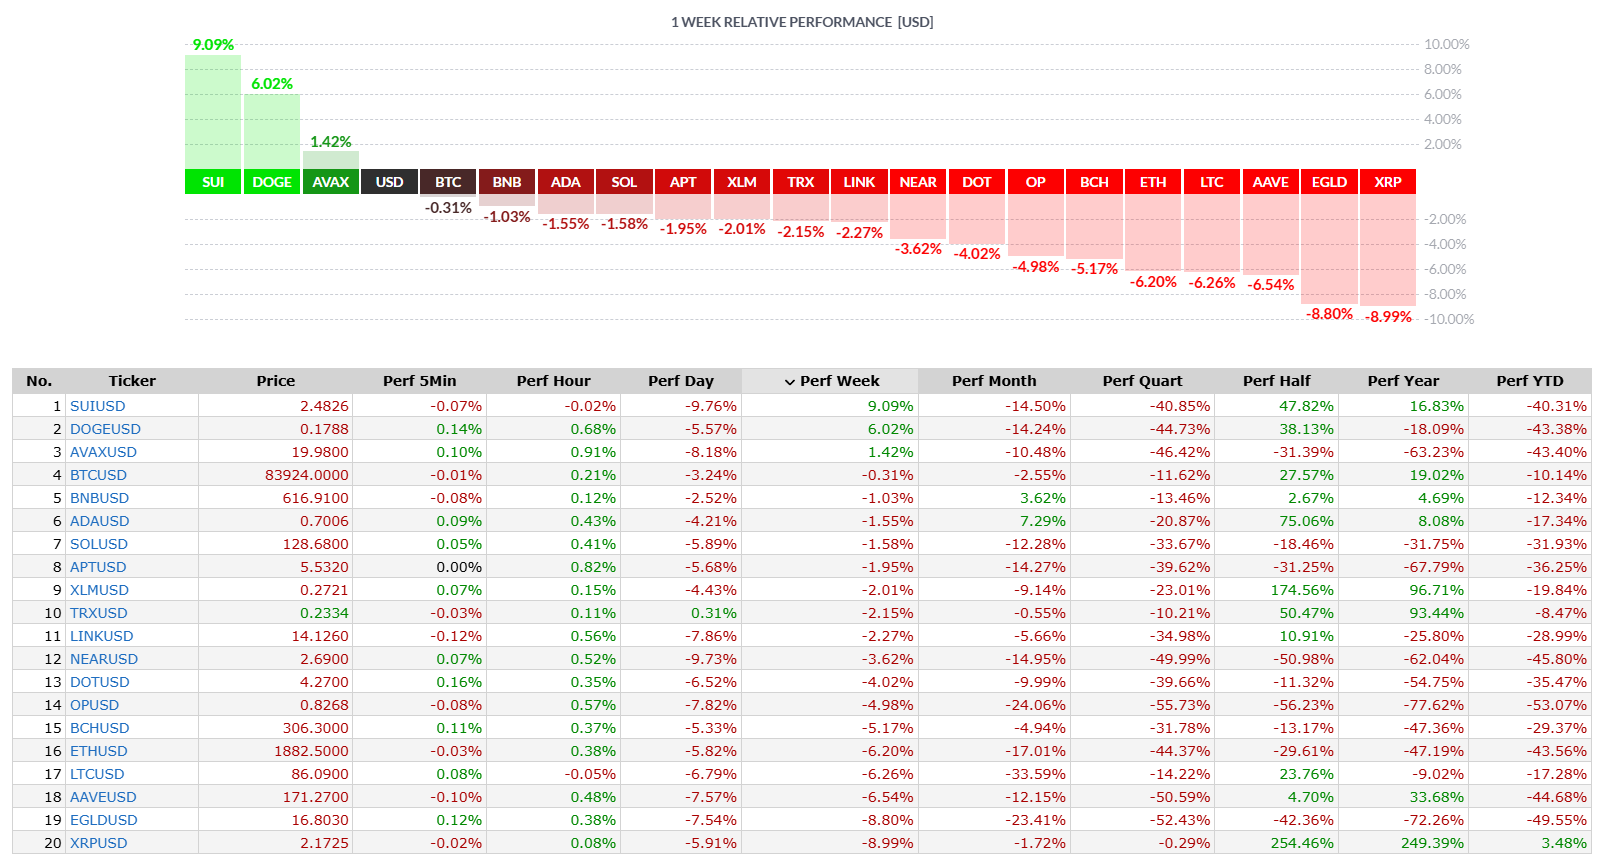
S&P 500 Sector Insights
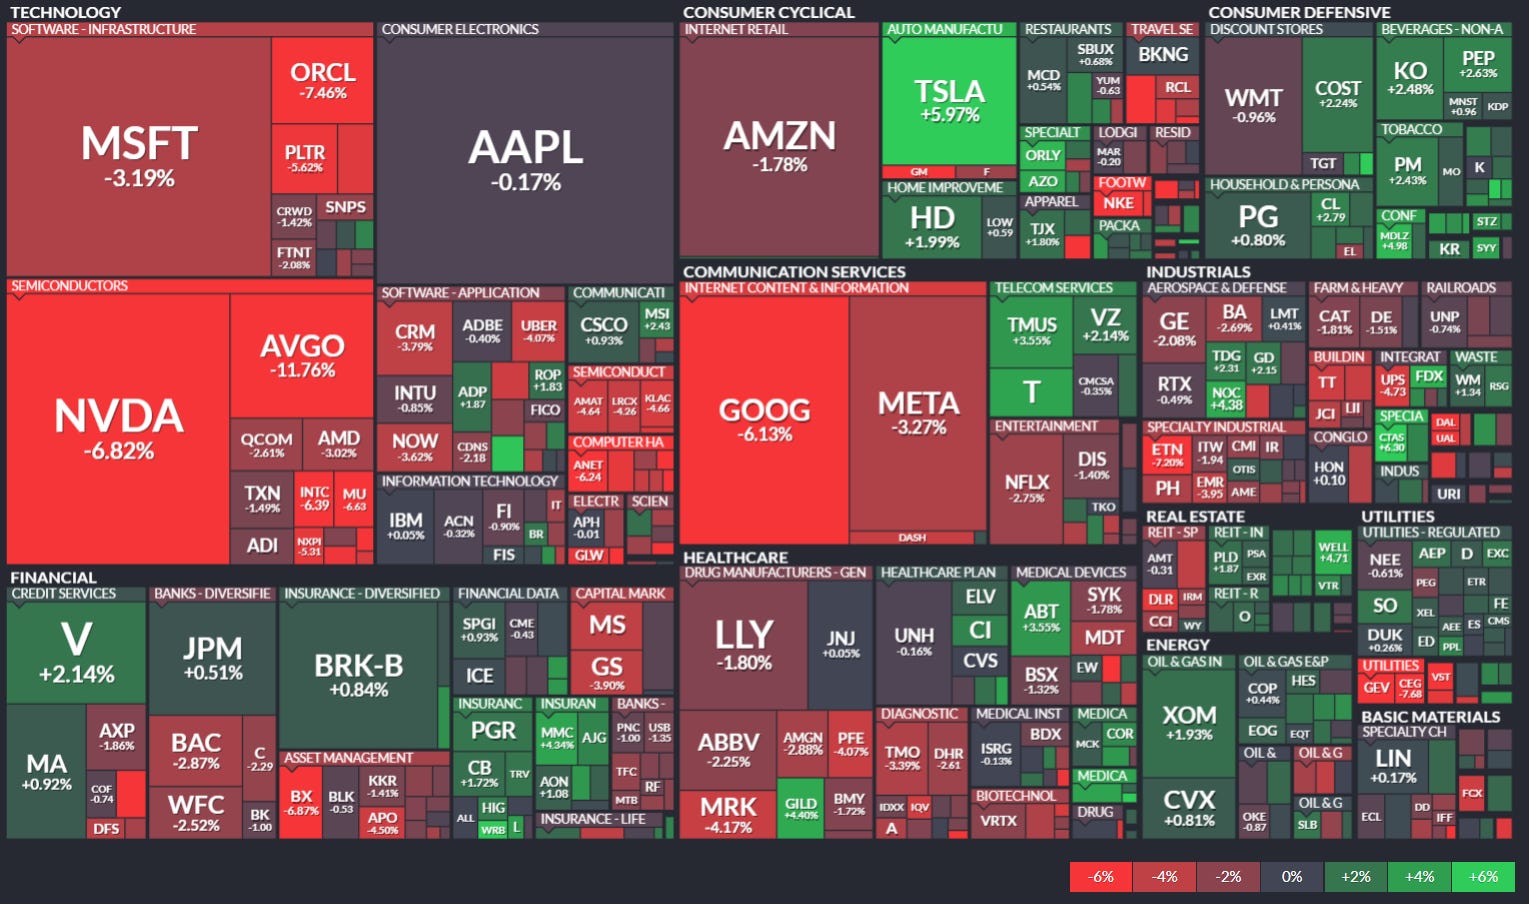
Consumer Discretionary:
- Performance: The sector faced significant challenges, primarily due to President Donald Trump’s announcement of a 25% tariff on imported cars and light trucks, effective April 3. Major automakers, including General Motors and Ford, saw their shares drop significantly. Conversely, Tesla experienced a slight increase due to its domestic production focus. Companies like Lululemon Athletica and Oxford Industries reported notable declines, attributed to consumer concerns about inflation and economic conditions.
Technology:
- The technology sector exhibited mixed results throughout the week. Earlier in the week, tech giants like Nvidia and Tesla rallied, contributing to a 1.76% rise in the S&P 500 on Monday. However, the sector faced headwinds later in the week due to ongoing trade uncertainties and concerns over high valuations. For instance, Broadcom Inc.’s stock fell by 4.1%, underperforming its competitors.
Energy:
- The energy sector lagged, influenced by fluctuating oil prices and global demand concerns. Investors showed caution, leading to underperformance in energy stocks compared to other sectors.
Utilities:
- As a traditionally defensive sector, utilities outperformed amid market volatility.Companies like American Water Works saw gains, indicating a shift toward stable, recession-proof investments during uncertain economic times.
Communication Services:
- The sector had a mixed week, with some companies benefiting from increased demand for digital services. While certain stocks in this sector saw gains, others faced challenges due to broader market conditions and investor sentiment.
Financials:
- The financial sector experienced declines, influenced by market volatility and economic slowdown fears. Concerns over interest rates and loan demand impacted bank stocks, contributing to the sector’s underperformance.
Consumer Staples:
- This defensive sector showed resilience, with modest gains amid broader market declines. The shift toward consumer staples reflects investor preference for sectors perceived as safer during economic uncertainties.
5-Day Sector Leaderboard
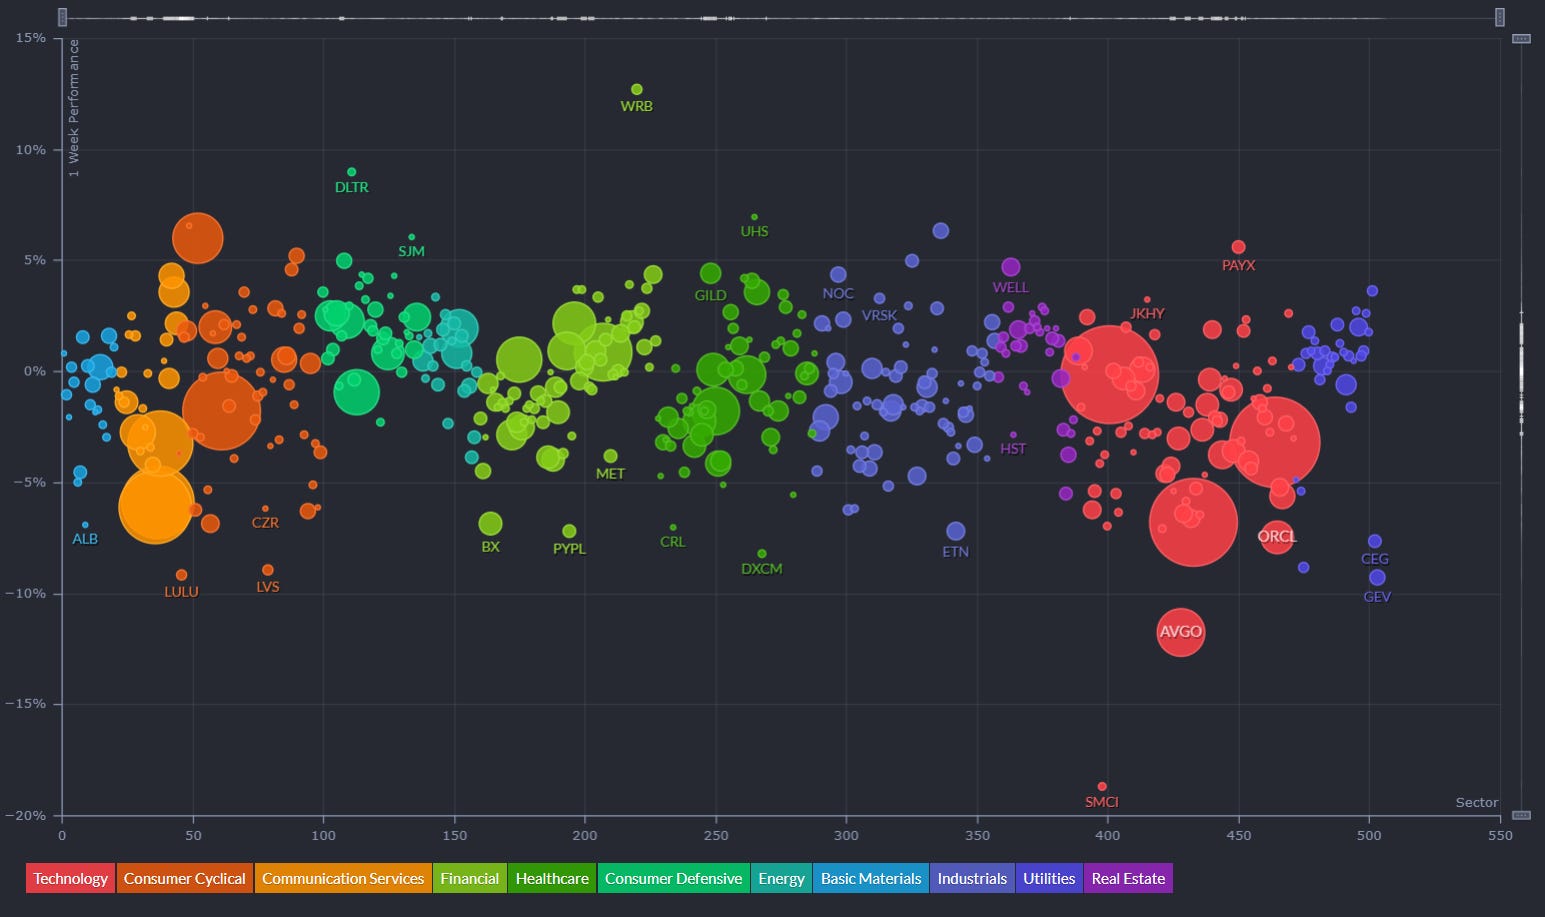
5-Day Individual Performance Grouped By Sector (Size By Market Cap)
ETF Insights
Reviewing a heatmap like this weekly can be incredibly helpful for investors as it provides a quick and visual summary of market performance across various sectors, asset classes, and geographies.
1. Sector and Asset Class Trends
- Identify Strong and Weak Sectors: Investors can quickly spot which sectors (e.g., technology, energy, healthcare) are performing well or underperforming.
- Asset Class Diversification: Seeing how commodities, fixed income, equities, and cryptocurrencies performed helps assess diversification.
2. Market Sentiment
- Risk-On or Risk-Off: A green-dominated map suggests bullish sentiment, while red indicates bearish sentiment. Investors can align their strategies accordingly.
- Volatility Indicators: Observing movements in volatility indices (e.g., VIX) can highlight changing market dynamics.
3. Regional Analysis
- Global Insights: Performance in developed and emerging markets (e.g., Europe, China, Asia-Pacific) helps in gauging international investment opportunities or risks.
- Currency Impacts: Movements in forex or country-specific ETFs can indicate currency-driven market trends.
4. Thematic Trends
- Growth vs. Value: Comparing the performance of growth ETFs (e.g., VUG) versus value ETFs (e.g., VTV) reveals the prevailing market preference.
- Industry Leadership: Highlighting leadership within industries (e.g., gold miners, semiconductors) can inform thematic plays.
5. Monitoring Investments
- Portfolio Alignment: Investors can track how their existing investments or watchlist align with broader market trends.
- Rotation Signals: Seeing week-over-week changes in sector dominance may signal sector rotation opportunities.
6. Risk Management
- Recognizing Overbought/Oversold Conditions: Consistent underperformance or overperformance in specific areas may indicate potential mean-reversion trades.
- Correlation Awareness: By observing how different asset classes move, investors can manage portfolio correlation and risk.
7. Decision Support
- Identify Outperformers/Underperformers: ETFs, sectors, or indices that repeatedly outperform or underperform can help refine trading or investment strategies.
- Macro Perspective: Weekly trends highlight macroeconomic or geopolitical influences affecting markets.
Regularly reviewing a heatmap like this is a strategic practice that supports data-driven decision-making while fostering a holistic understanding of market dynamics.
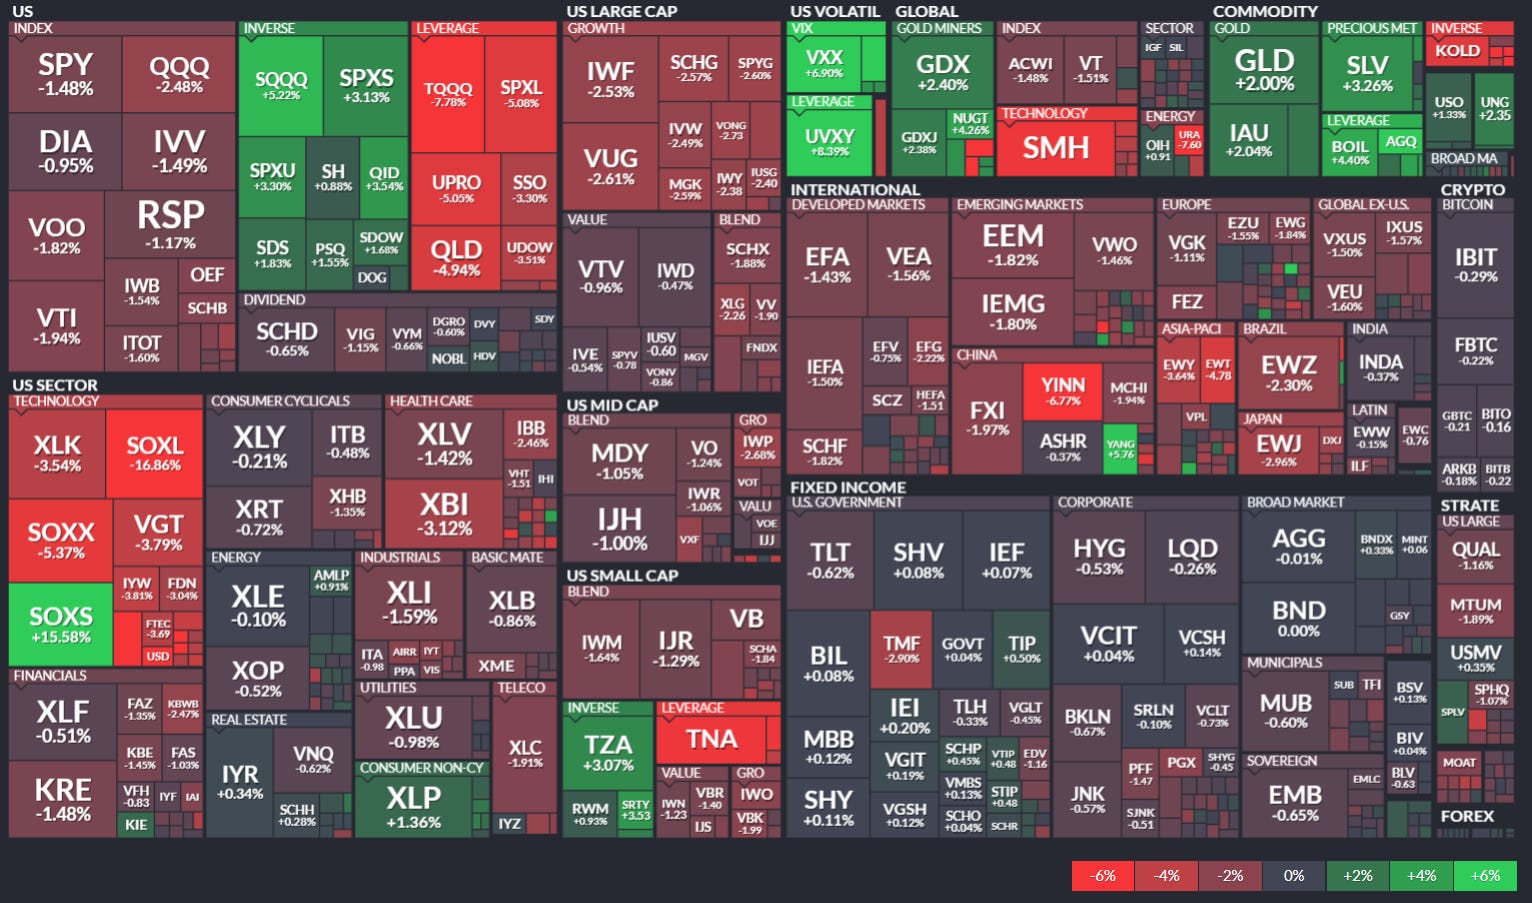
Broad Market ETFs:
- SPDR S&P 500 ETF Trust (SPY): Closed at $555.66, down 1.98% for the week, mirroring the S&P 500’s overall decline.
- Invesco QQQ Trust (QQQ): Ended at $468.94, a 2.63% decrease, reflecting the tech sector’s volatility.
- iShares Russell 2000 ETF (IWM): Finished at $200.45, down 2.02%, indicating challenges among small-cap stocks.
Sector-Specific ETFs:
- Technology Select Sector SPDR ETF ( XLK 0.00%↑ ): Dropped 2.44% to $206.38, influenced by trade tensions and supply chain concerns.
- Consumer Discretionary Select Sector SPDR ( XLY 0.00%↑ ): Fell 3.06% to $197.04, impacted by new tariffs on imported vehicles.
- Energy Select Sector SPDR Fund ( XLE 0.00%↑ ): Declined 0.47% to $92.43, amid fluctuating oil prices and global demand worries.
- Utilities Select Sector SPDR ETF ( XLU 0.00%↑ ): Rose 0.79% to $77.98, as investors sought defensive positions during market volatility.
Top-Performing ETFs:
- Sprott Junior Copper Miners ETF ( COPJ 0.00%↑ ): Gained 14.1%, driven by rising copper prices due to supply concerns.
- Amplify Junior Silver Miners ETF ( SILJ 0.00%↑ ): Increased 13.8%, benefiting from heightened demand for silver as a safe-haven asset.TradingView
- Global X Defense Tech ETF ( SHLD 0.00%↑ ): Advanced 13.1%, reflecting increased interest in defense technology amid geopolitical tensions.TradingView
Global Overview
Foreign ADR stocks listed on NYSE, NASDAQ & AMEX categorized by geographic location. Reviewing a global heatmap like this weekly is valuable for investors because it offers insights into international markets, helping to:
- Identify Global Trends: Spot which regions or countries are performing well or underperforming.
- Assess Sector and Regional Performance: Understand how industries are faring across different regions.
- Diversify Portfolios: Uncover opportunities in emerging or developed markets for greater diversification.
- Gauge Global Sentiment: Recognize the impact of macroeconomic events on specific regions.
- Align with Global Strategies: Refine investment strategies based on regional strengths or weaknesses.
This overview ensures investors stay informed about global opportunities and risks, complementing their domestic market analysis.
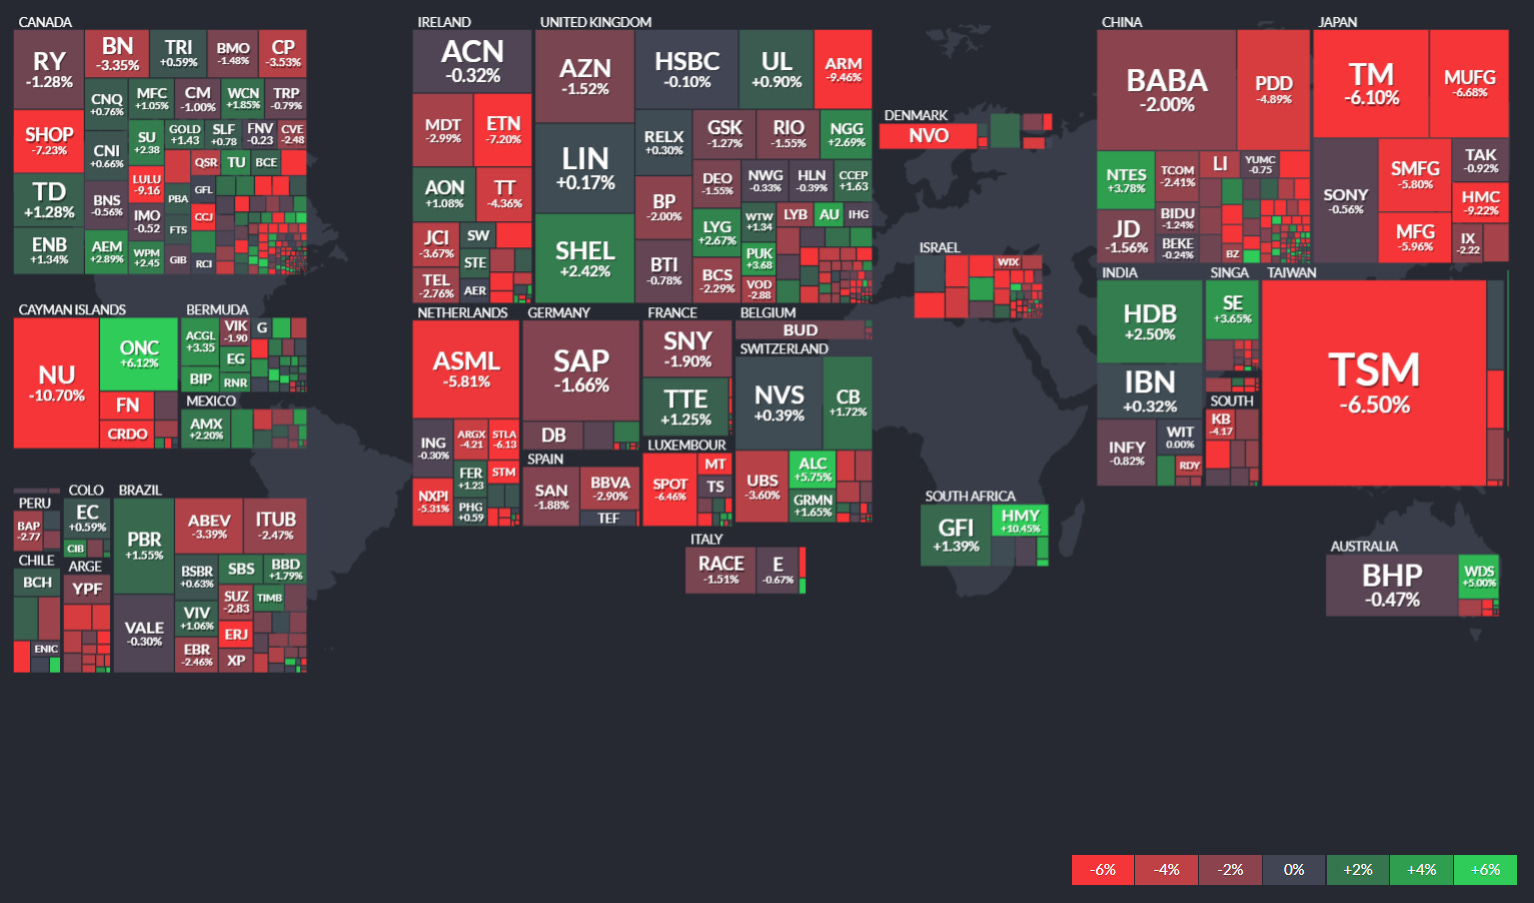
Top Performers:
- DBV Technologies S.A. ( DBVT 0.00%↑ ): The France-based biopharmaceutical company experienced a 59% surge, closing at $6.20. This significant uptick is attributed to positive developments in their allergy treatment pipeline.
- Lixiang Education Holding Co. Ltd. ( LXEH 0.00%↑ ): This China-based education services provider saw a 32% increase, ending the week at $17.65. The rise reflects strong earnings and optimistic future enrollment projections.
- NuCana PLC ( NCNA 0.00%↑ ): The UK-based biopharmaceutical firm reported a 20% gain, closing at $1.28, likely due to favorable clinical trial results for its oncology treatments.
Top Decliners:
- Trident Digital Tech Holdings Ltd. ( $TDTL ): Based in Singapore, the company faced a 34% decline, ending at $0.41. The drop is linked to disappointing quarterly earnings and concerns over digital advertising revenues.
- Jianzhi Education Technology Group Co. Ltd. ( JZ 0.00%↑ ): The Chinese education technology firm saw a 16% decrease, closing at $0.77, amid regulatory challenges in China’s online education sector.
- Quoin Pharmaceuticals Ltd. ( QNRX 0.00%↑ ): The Israel-based pharmaceutical company experienced a 15% drop, ending at $0.24, possibly due to delays in drug approval processes.
Crypto Performance Summary

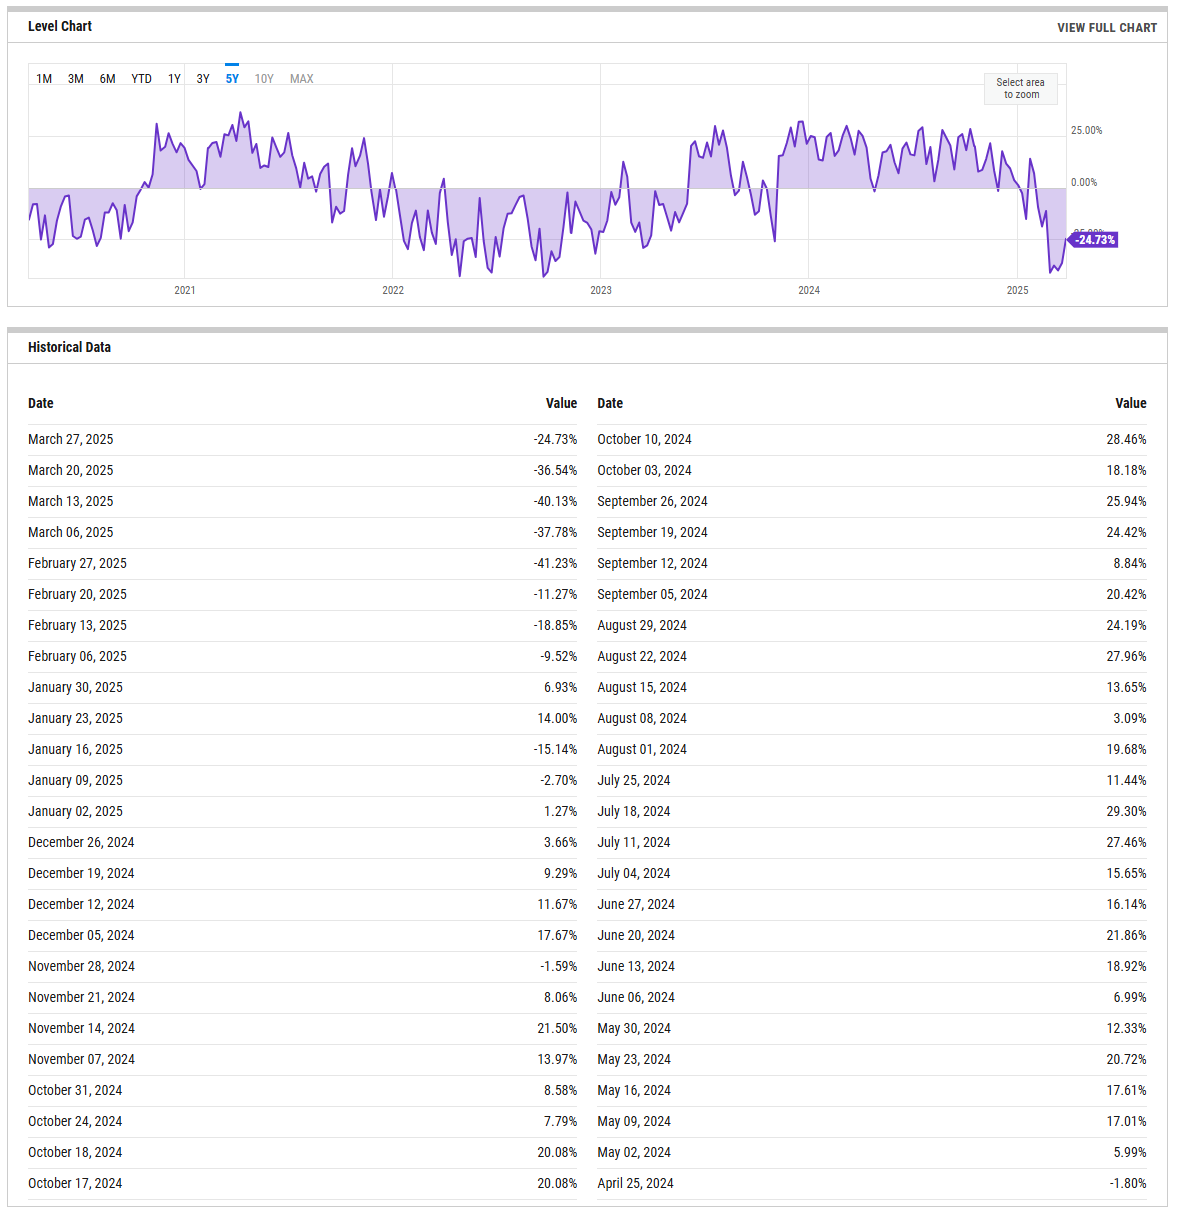
US Investor Sentiment
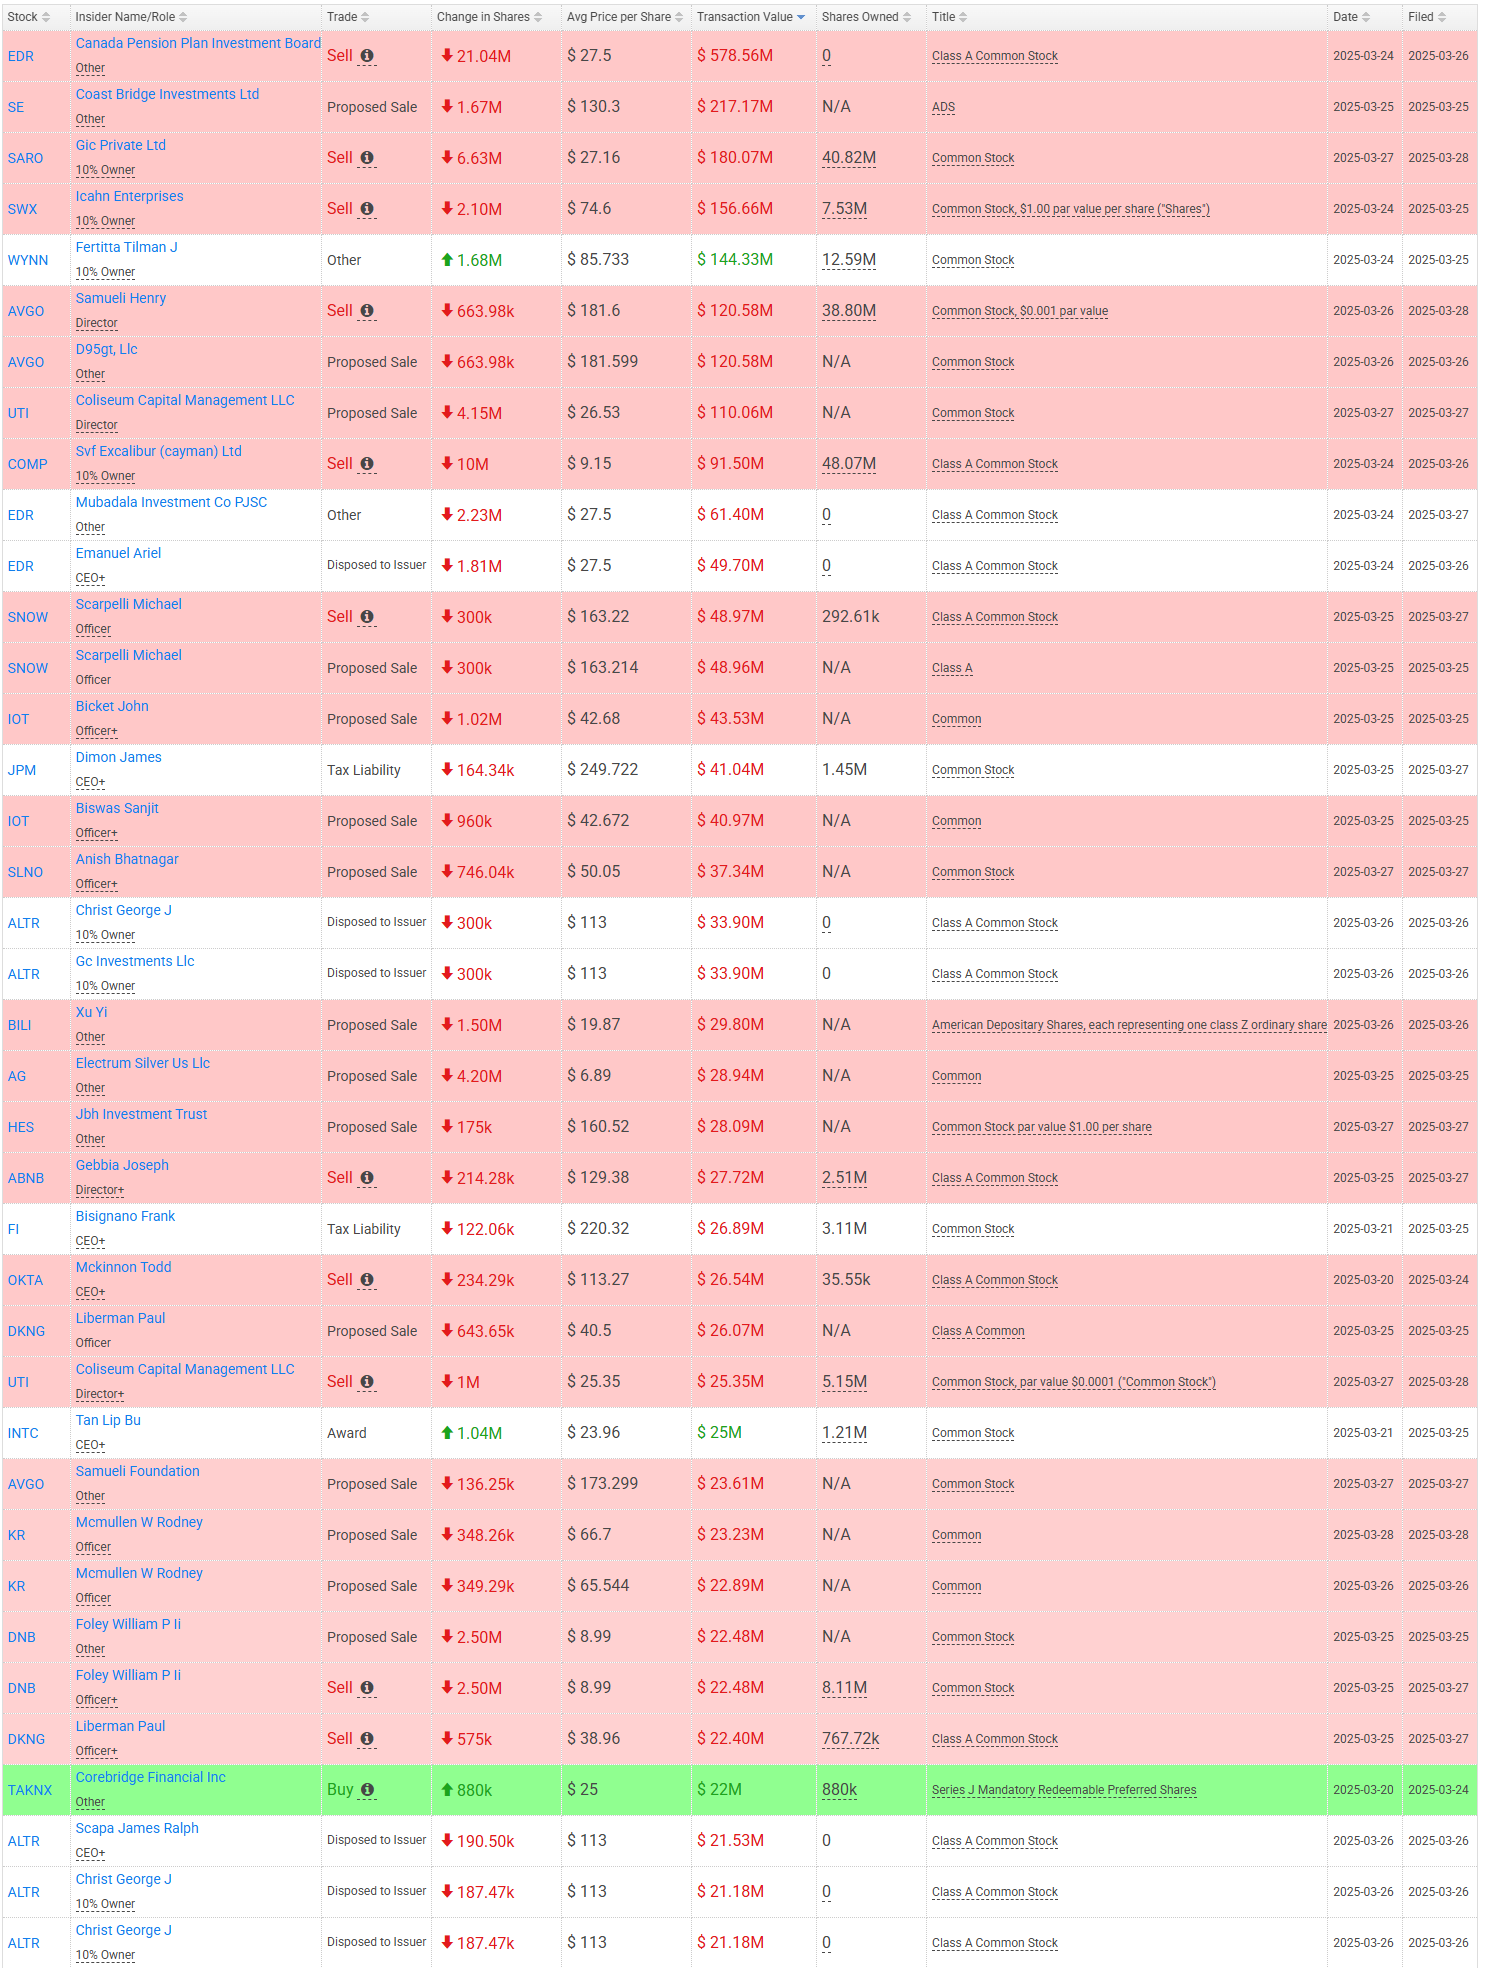
Insider Trading
Insider trading occurs when a company's leaders or major shareholders trade stock based on non-public information. Tracking these trades can reveal insider expectations about the company's future. For example, large purchases before an earnings report or drug trial results might indicate confidence in upcoming good news.
%Bull-Bear Spread
The %Bull-Bear Spread chart is a sentiment indicator that shows the difference between the percentage of bullish and bearish investors, often derived from surveys or sentiment data, such as the AAII (American Association of Individual Investors) sentiment survey. This spread tells investors about the prevailing mood in the market and can provide insights into market extremes and potential turning points.
- Bullish or Bearish Sentiment:
- When the spread is positive, it means more investors are bullish than bearish, indicating optimism about the market's direction.
- A negative spread indicates more bearish sentiment, meaning more investors expect the market to decline.
- Contrarian Indicator:
- The %Bull-Bear Spread is often used as a contrarian indicator. For example, extremely high levels of bullish sentiment might suggest that the market is overly optimistic and could be due for a correction.
- Similarly, when bearish sentiment is extremely high, it might indicate that the market is overly pessimistic, and a rally could be on the horizon.
- Market Extremes and Reversals:
- Historically, extreme values of the spread (both positive and negative) can signal turning points in the market. A very high positive spread can signal market exuberance, while a very low or negative spread may indicate fear or capitulation.
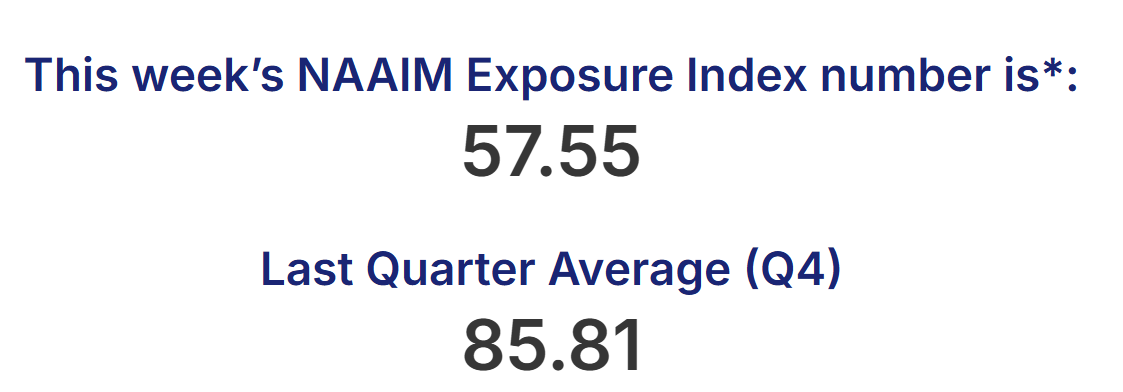
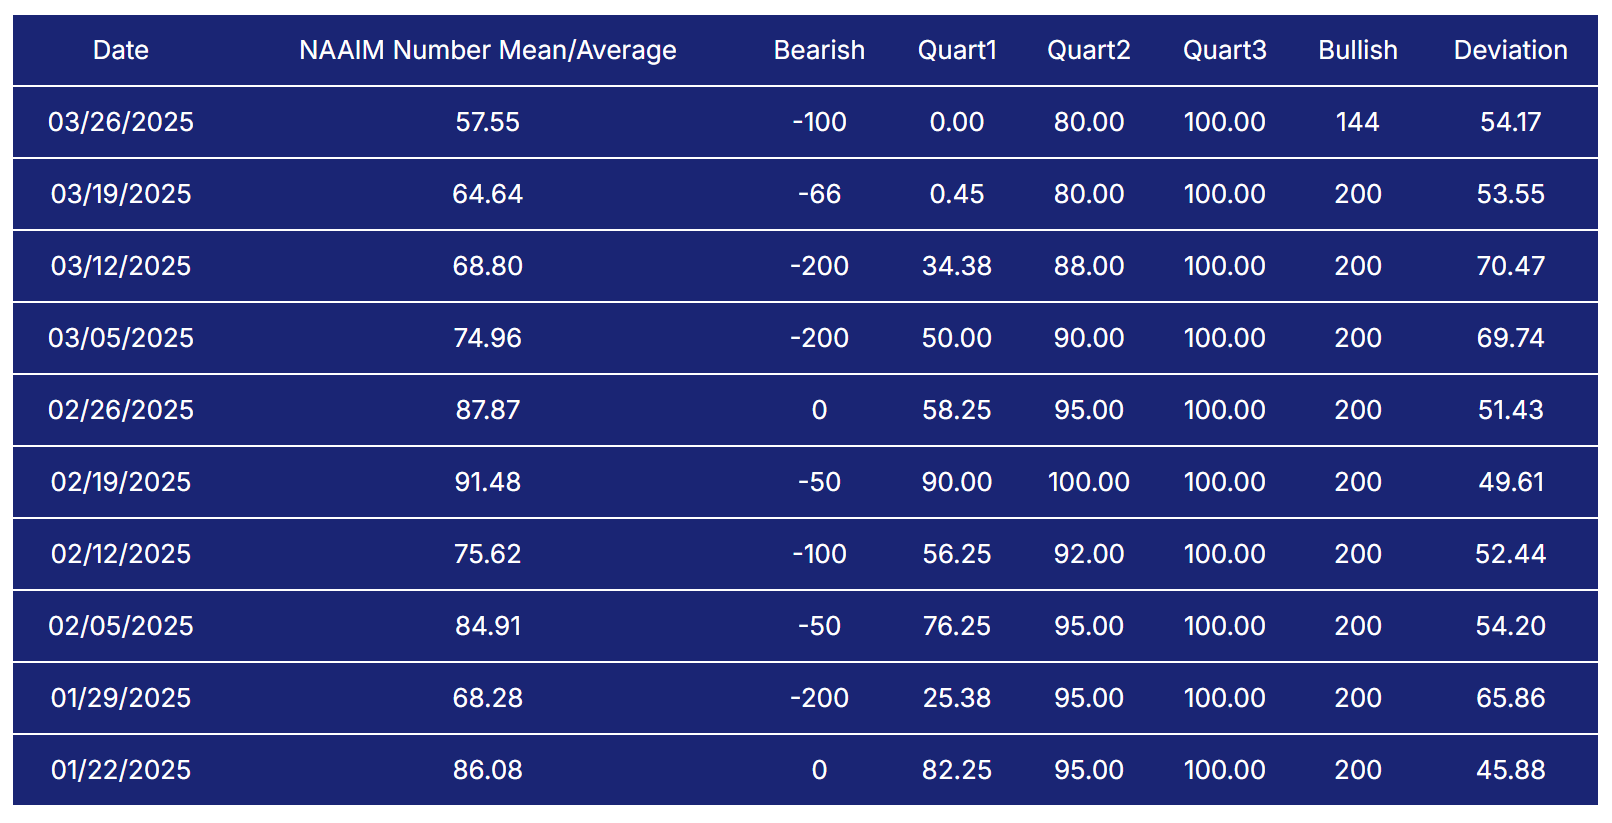
NAAIM Exposure Index
The NAAIM Exposure Index (National Association of Active Investment Managers Exposure Index) measures the average exposure to U.S. equity markets as reported by its member firms. These are typically active money managers who provide their equity exposure levels weekly. The index offers insight into how much these managers are investing in equities at any given time, ranging from being fully short (-100%) to leveraged long (up to +200%).
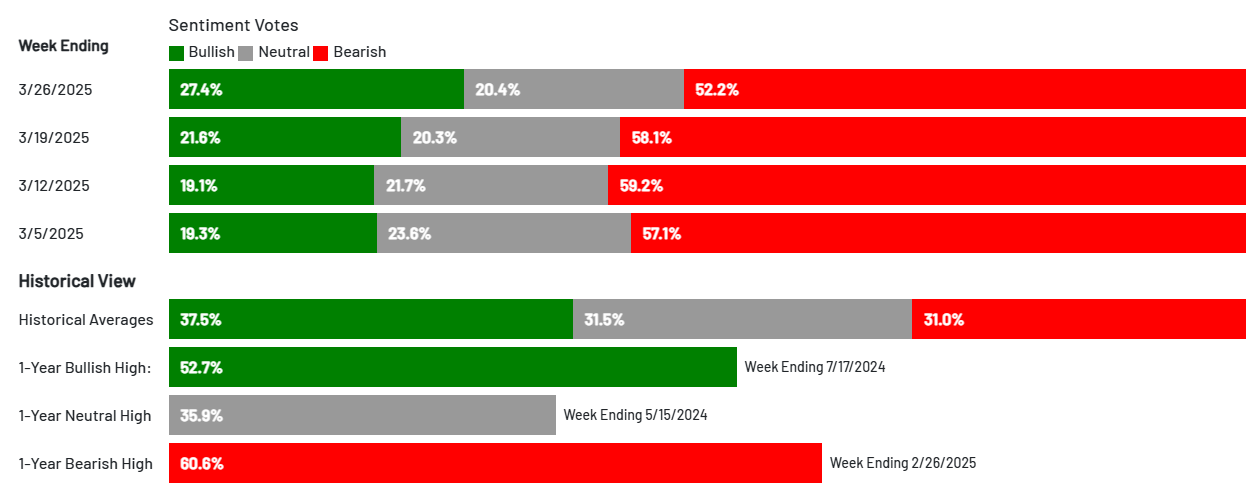
AAII Investor Sentiment Survey
The AAII Investor Sentiment Survey is a weekly survey conducted by the American Association of Individual Investors (AAII) to gauge the mood of individual investors regarding the direction of the stock market over the next six months. It provides insights into whether investors are feeling bullish (expecting the market to rise), bearish (expecting the market to fall), or neutral (expecting the market to stay about the same).
Key Points:
- Bullish Sentiment: Reflects the percentage of investors who believe the stock market will rise in the next six months.
- Bearish Sentiment: Represents those who expect a decline.
- Neutral Sentiment: Reflects investors who anticipate little to no market movement.
The survey is widely followed as a contrarian indicator, meaning that extreme levels of bullishness or bearishness can sometimes signal market turning points. For example, when a large number of investors are overly optimistic (high bullish sentiment), it could suggest a market top, while excessive pessimism (high bearish sentiment) may indicate a market bottom is near.
SPX Put/Call Ratio
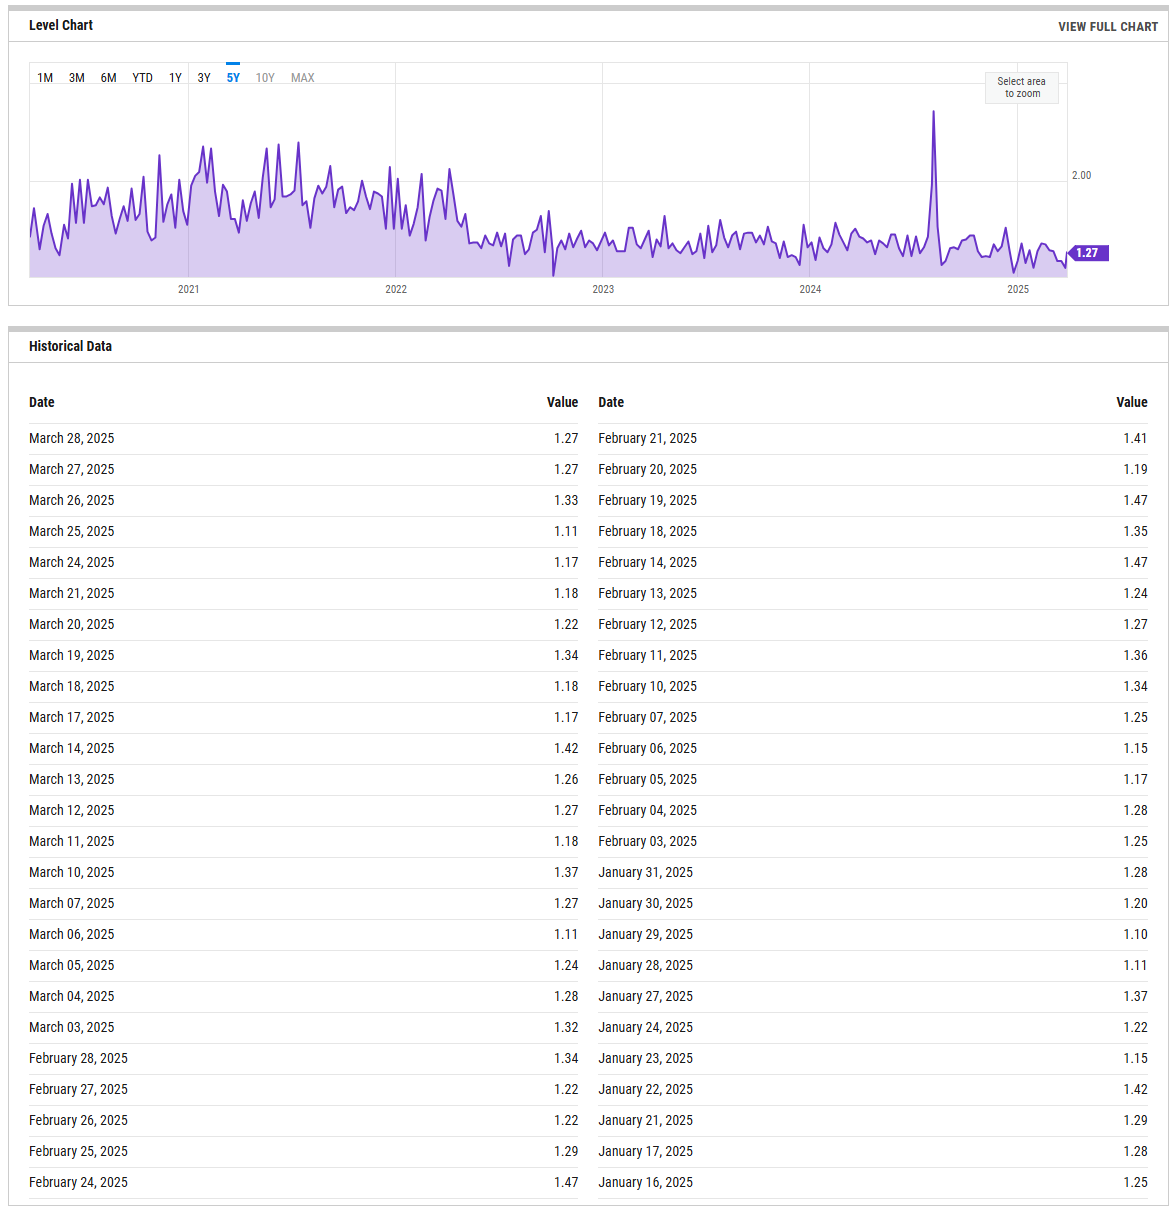
The SPX Put/Call Ratio is an indicator that is used to gauge market sentiment. This is calculated as the ratio between trading S&P 500 put options and S&P call options. A high put/call ratio can indicate fear in the markets, while a low ratio indicates confidence. For example, in 2015, the Put-Call ratio was as high as 3.77 because of market fears stemming from various global economic issues like a GDP growth slowdown in China and a Greek debt default.
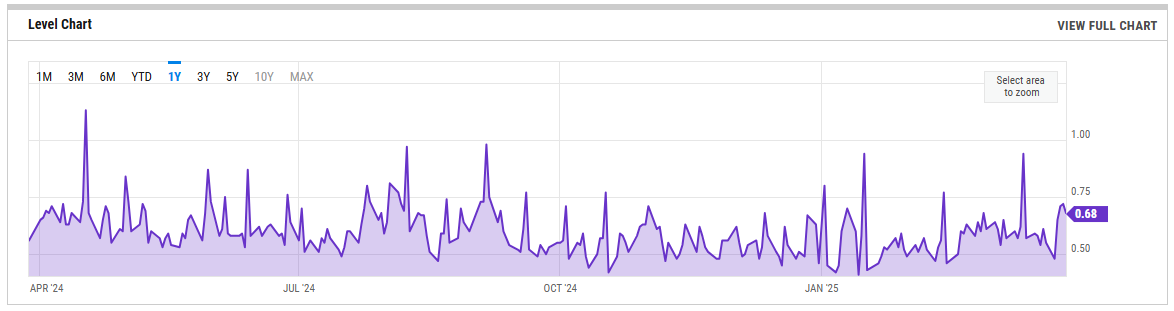
CBOE Equity Put/Call Ratio
The CBOE (Chicago Board Options Exchange) equity put/call ratio is a sentiment indicator used by traders and analysts to gauge market sentiment and potential shifts in investor behavior. It is calculated by dividing the volume of put options by the volume of call options on equities. Here's what it reveals and how it is generally interpreted:
- High Put/Call Ratio: When the put/call ratio is high (above 1.0), it suggests that there is more demand for put options than call options. This typically reflects a more bearish sentiment, as investors may be hedging against potential declines or expecting the market to fall.
- Low Put/Call Ratio: Conversely, a low put/call ratio (below 0.7) indicates a higher volume of call options compared to puts, reflecting bullish sentiment. Investors may be expecting upward momentum and are positioning themselves to profit from price gains
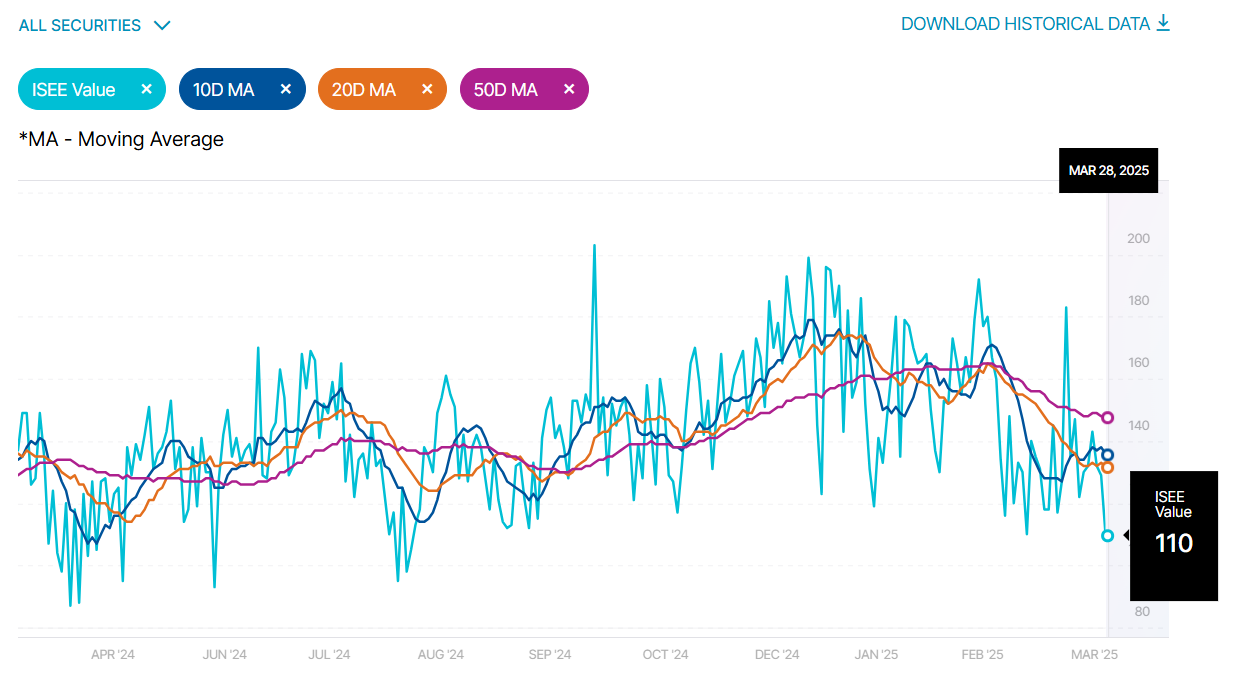
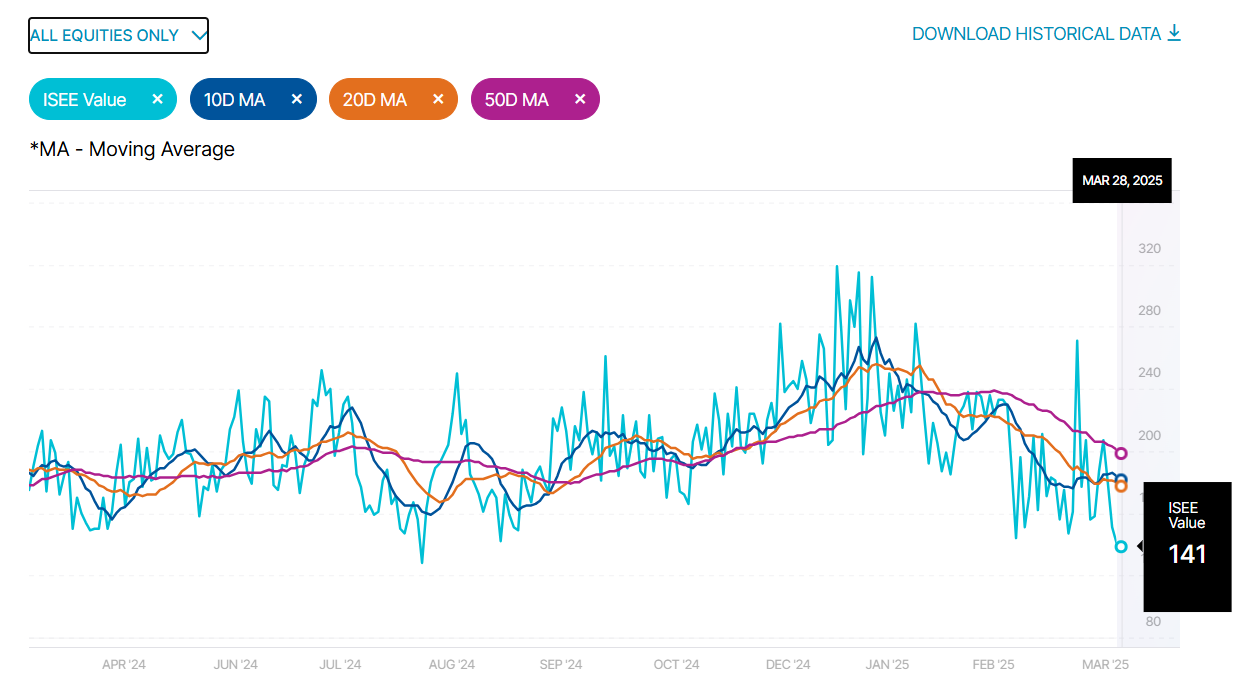
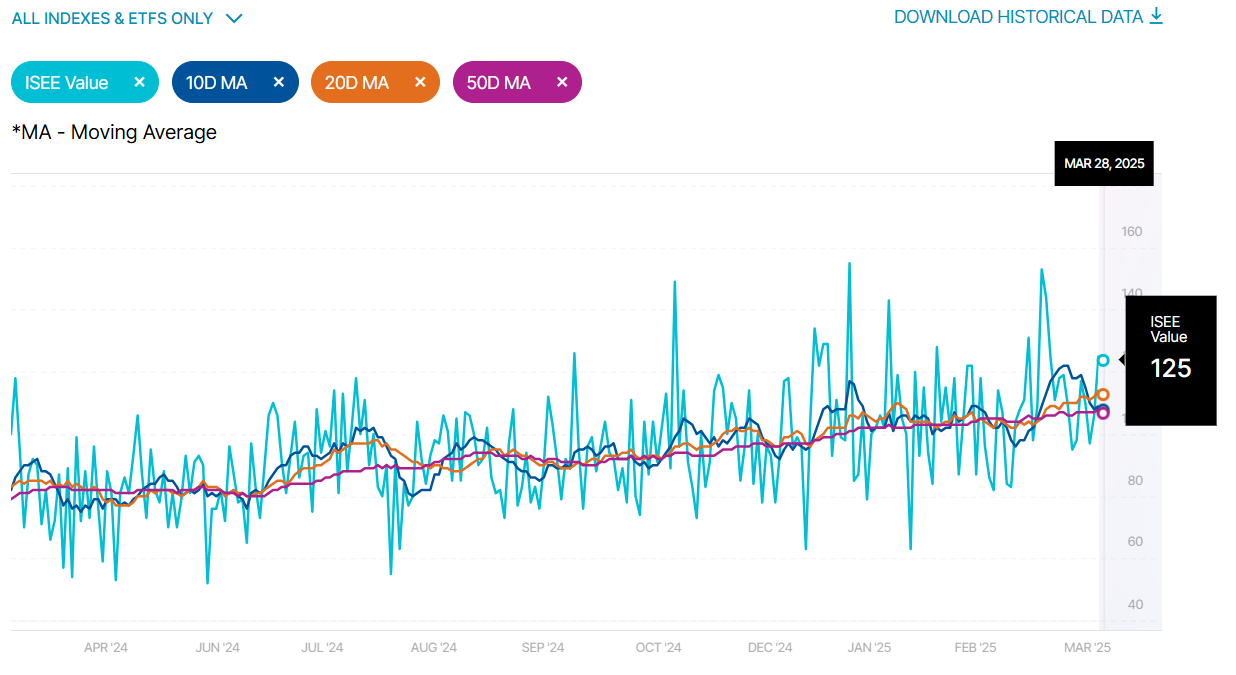
ISEE Sentiment Index
The ISEE (International Securities Exchange Sentiment) Index is a measure of investor sentiment derived from options trading. Unlike traditional put/call ratios, the ISEE Index focuses only on opening long customer transactions and is adjusted to remove market-maker and firm trades, providing a purer sentiment reading.
The ISEE Index typically ranges from 0 to 200, with readings above 100 indicating more call options being bought relative to put options, suggesting bullish sentiment. Conversely, readings below 100 suggest bearish sentiment, with more puts being purchased relative to calls.
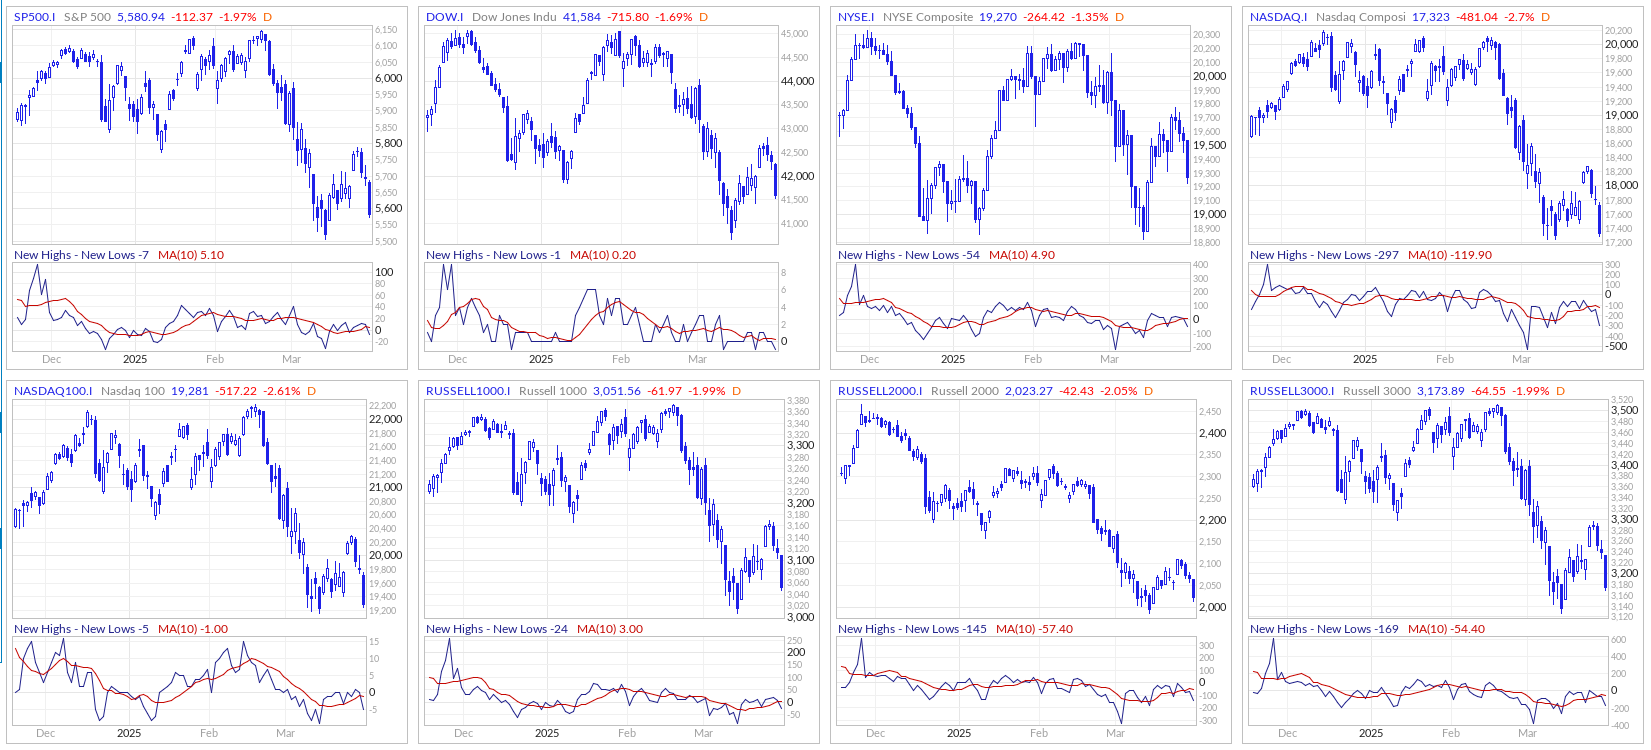
New Highs – New Lows
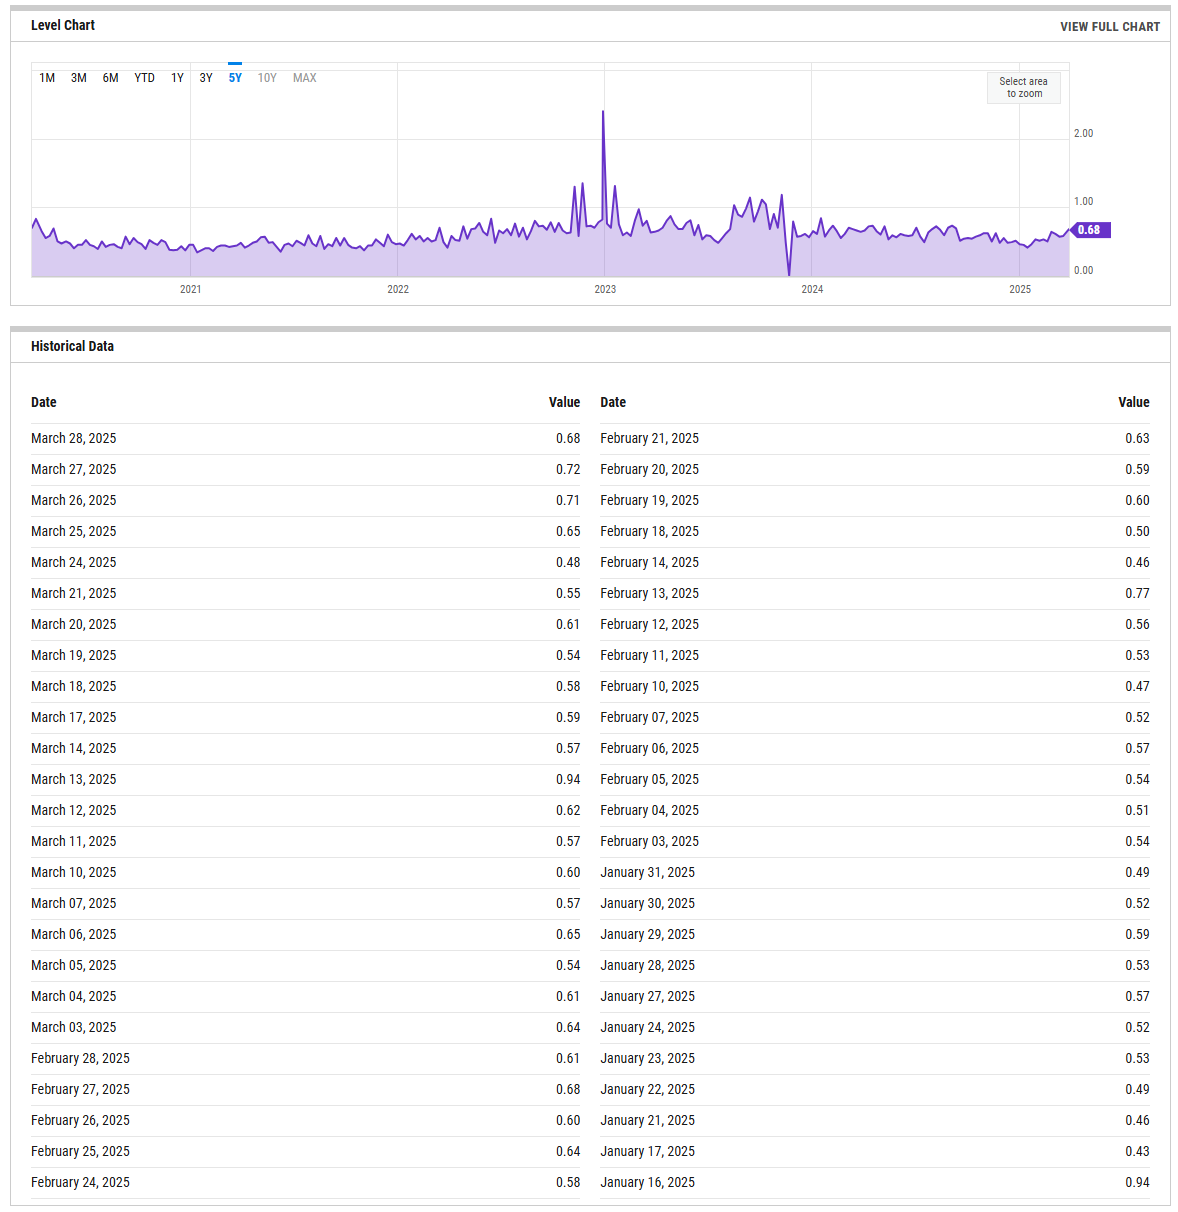
The New Highs – New Lows indicator (NH-NL) displays the daily difference between the number of stocks reaching new 52-week highs and the number of stocks reaching new 52-week lows. The NH-NL indicator generally reaches its extreme lows slightly before a major market bottom. As the market then turns up from the major bottom, the indicator jumps up rapidly. During this period, many new stocks are making new highs because it’s easy to make a new high when prices have been depressed for a long time. The NH-NL indicator oscillates around zero. If the indicator is positive, the bulls are in control. If it is negative, the bears are in control. As the cycle matures, a divergence often occurs as fewer and fewer stocks are making new highs (the indicator falls), yet the market indices continue to reach new highs. This is a classic bearish divergence that indicates that the current upward trend is weak and may reverse.
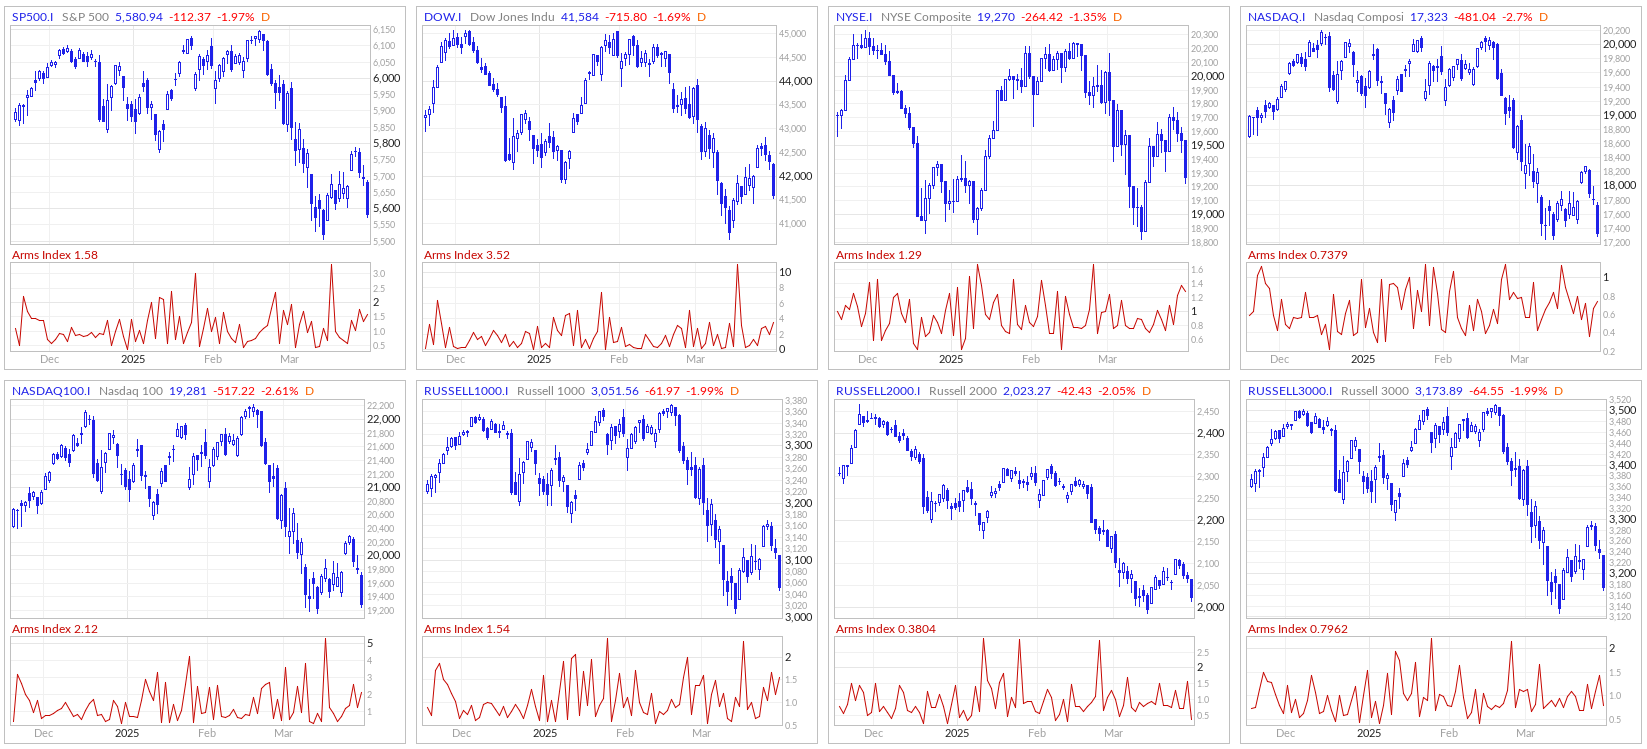
ARMS Index
The Arms Index, also known as the TRIN (Short-Term TRading INdex), was developed by Richard Arms in the 1960s. It is calculated by dividing the ratio of advancing stocks to declining stocks by the ratio of advancing volume to declining volume. Interpreting the Arms Index involves looking at its value in relation to certain thresholds. A value below “1” is considered bullish, indicating that advancing stocks and volume dominate the market. Conversely, a value above “1” is considered bearish, suggesting that declining stocks and volume are more prevalent. Extremely low values (below 0.5) or high values (above 2) are often seen as potential reversal signals.
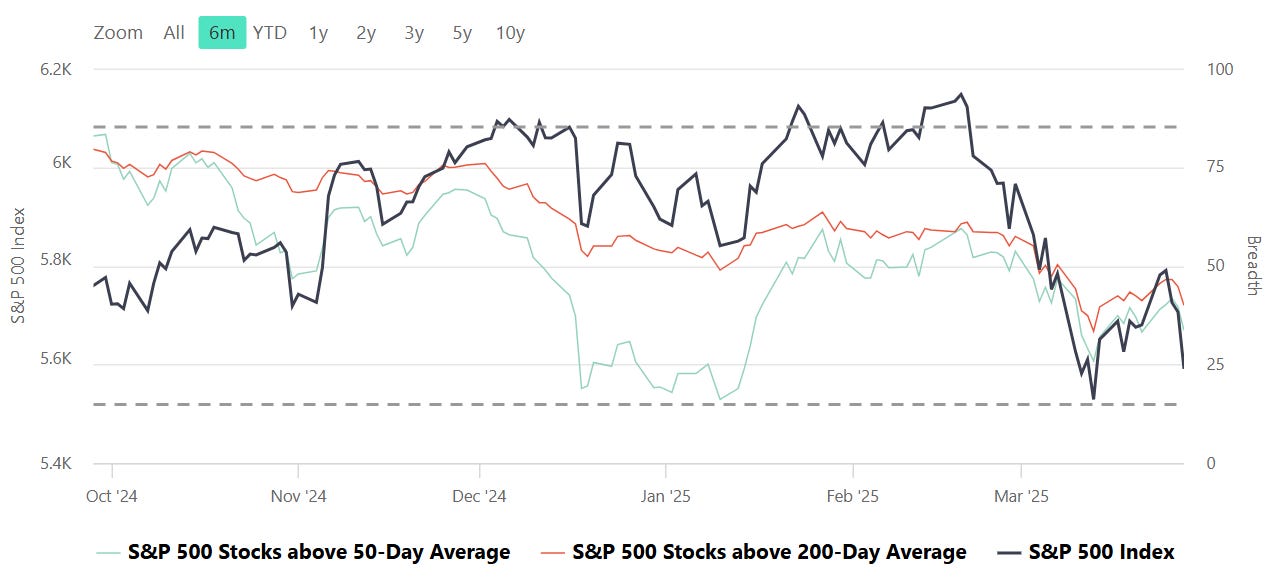
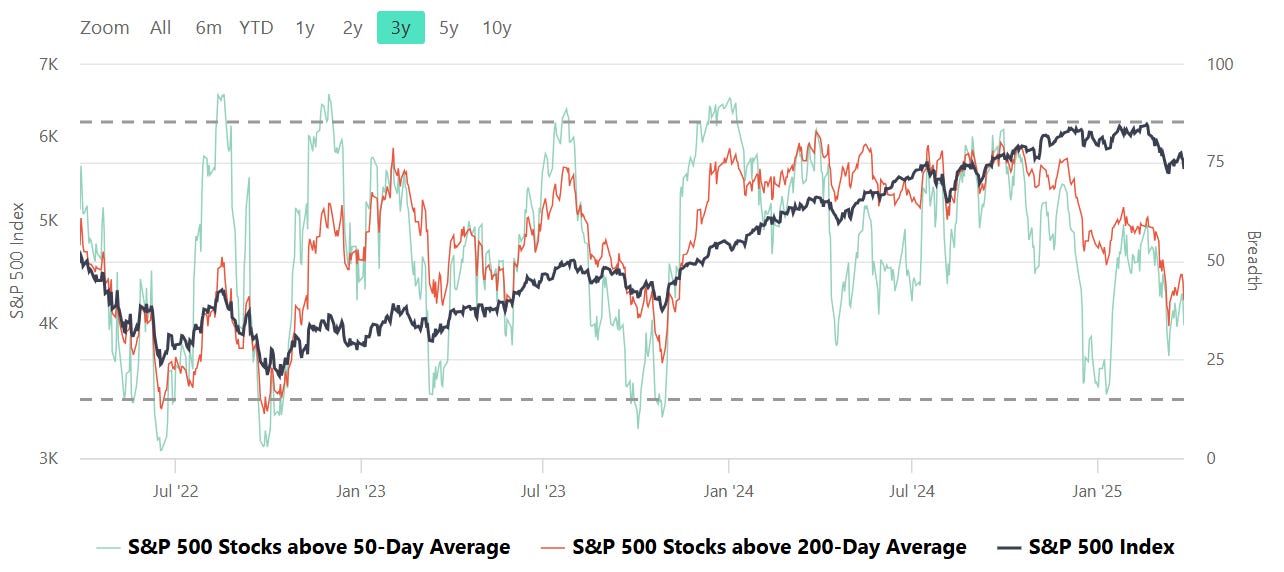
S&P Breadth
Breadth, in the context of stock market analysis, refers to the measure of how many stocks in a given index (such as the S&P 500) are participating in a trend, such as advancing or declining relative to a certain moving average (e.g., 50-day or 200-day).
- Market Strength Assessment:
- Breadth provides insight into whether a market rally or decline is broad-based or driven by only a few large-cap stocks. A rally supported by a high percentage of stocks above their 50-day or 200-day averages is generally considered healthier and more sustainable.
- Early Warning Signals:
- Divergences between breadth indicators and the index price can signal potential reversals. For example:
- If the index is rising, but the number of stocks above their moving averages is declining, it may indicate weakening underlying strength and potential for a pullback.
- Conversely, if breadth improves while the index remains flat or declines, it may suggest accumulating strength for a future rally.
- Divergences between breadth indicators and the index price can signal potential reversals. For example:
- Trend Confirmation:
- Breadth indicators can confirm trends. For instance, a strong majority of stocks above their moving averages signals robust market momentum, providing confidence in the prevailing trend.
- Identifying Overbought or Oversold Conditions:
- Extremely high or low breadth readings can signal overbought or oversold conditions, which might lead to mean reversion. For example:
- If nearly all stocks are above their 50-day or 200-day averages, it may suggest overbought conditions.
- Conversely, extremely low levels indicate oversold conditions and potential for a bounce.
- Extremely high or low breadth readings can signal overbought or oversold conditions, which might lead to mean reversion. For example:
Breadth and Timing Investments:
- Entry Points:
- When breadth improves (e.g., more stocks move above their 50-day or 200-day moving averages) after a market pullback, it can indicate a good time to start building positions as the broader market is regaining strength.
- Exit Points:
- Breadth deterioration during a rally may suggest it's time to reduce exposure, especially if only a small number of stocks are driving index gains. This is often a warning sign of an impending correction.
- Volatility and Risk Management:
- Weak breadth in volatile markets may prompt caution or defensive positioning. Conversely, improving breadth can justify taking on more risk during uptrends.
CME Fedwatch
What is the likelihood that the Fed will change the Federal target rate at upcoming FOMC meetings, according to interest rate traders? Use CME FedWatch to track the probabilities of changes to the Fed rate, as implied by 30-Day Fed Funds futures prices.
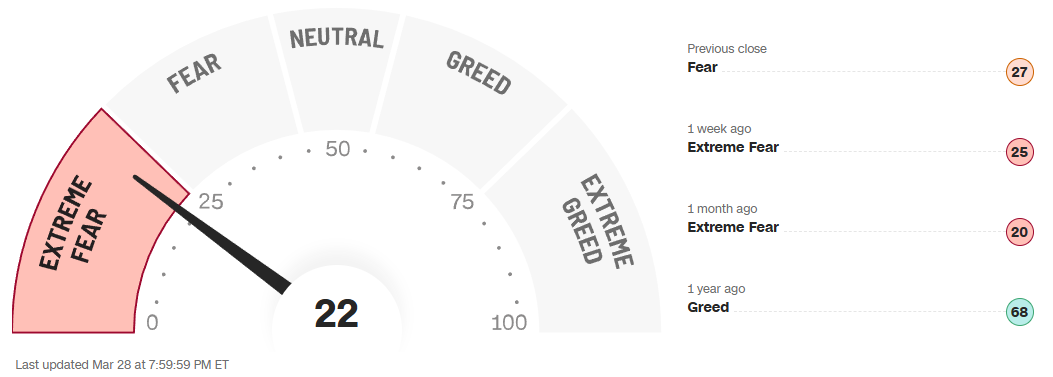
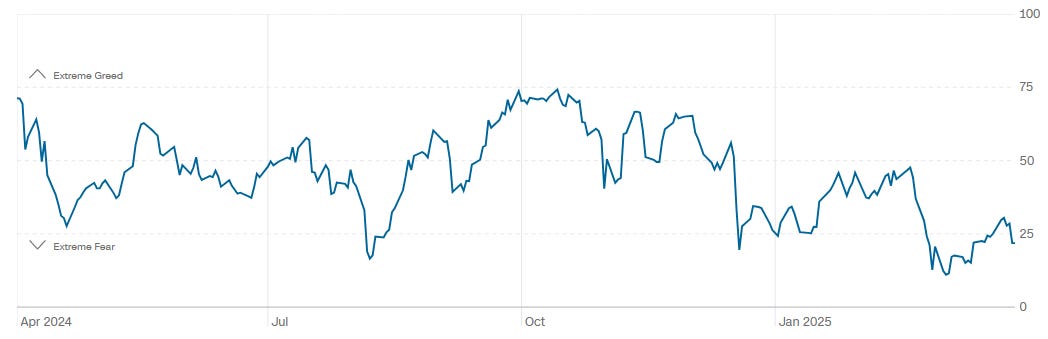
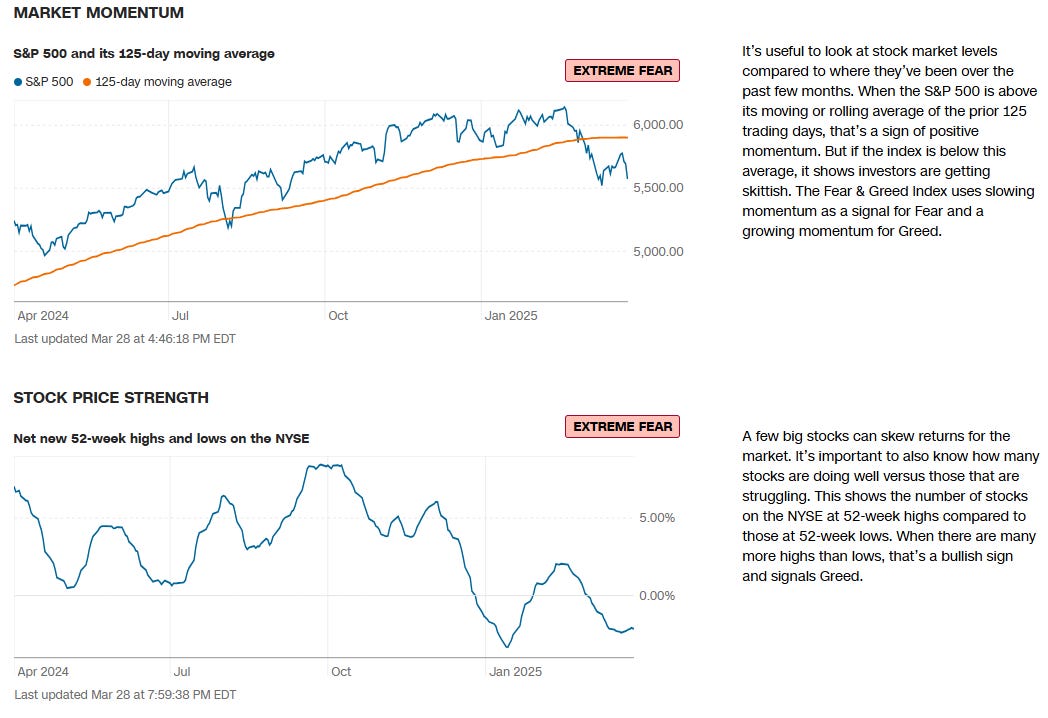
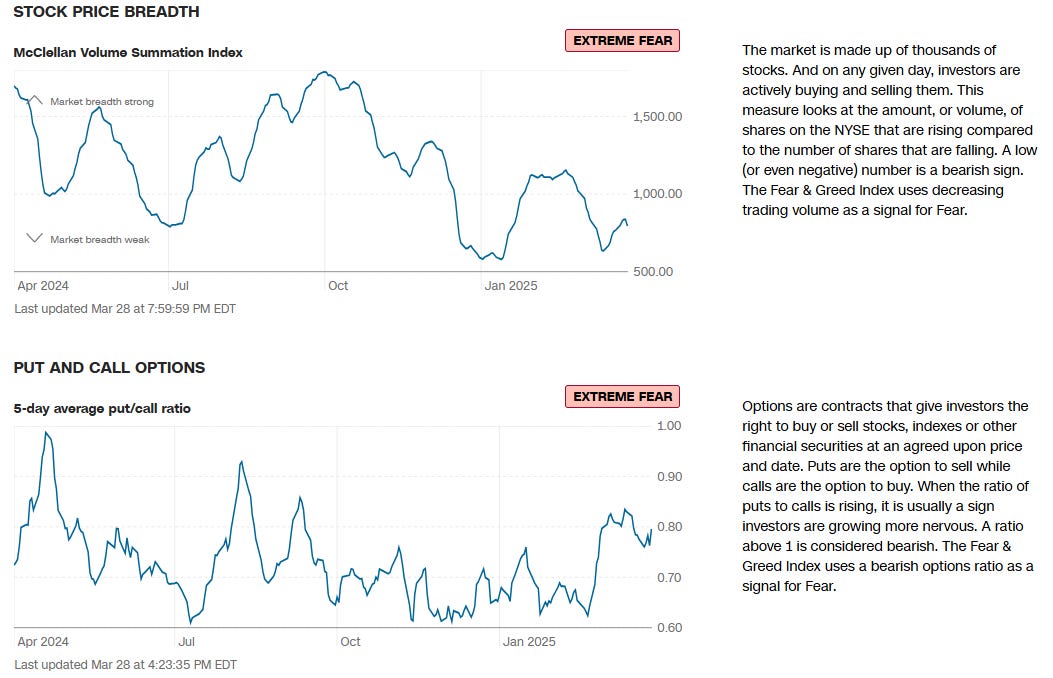
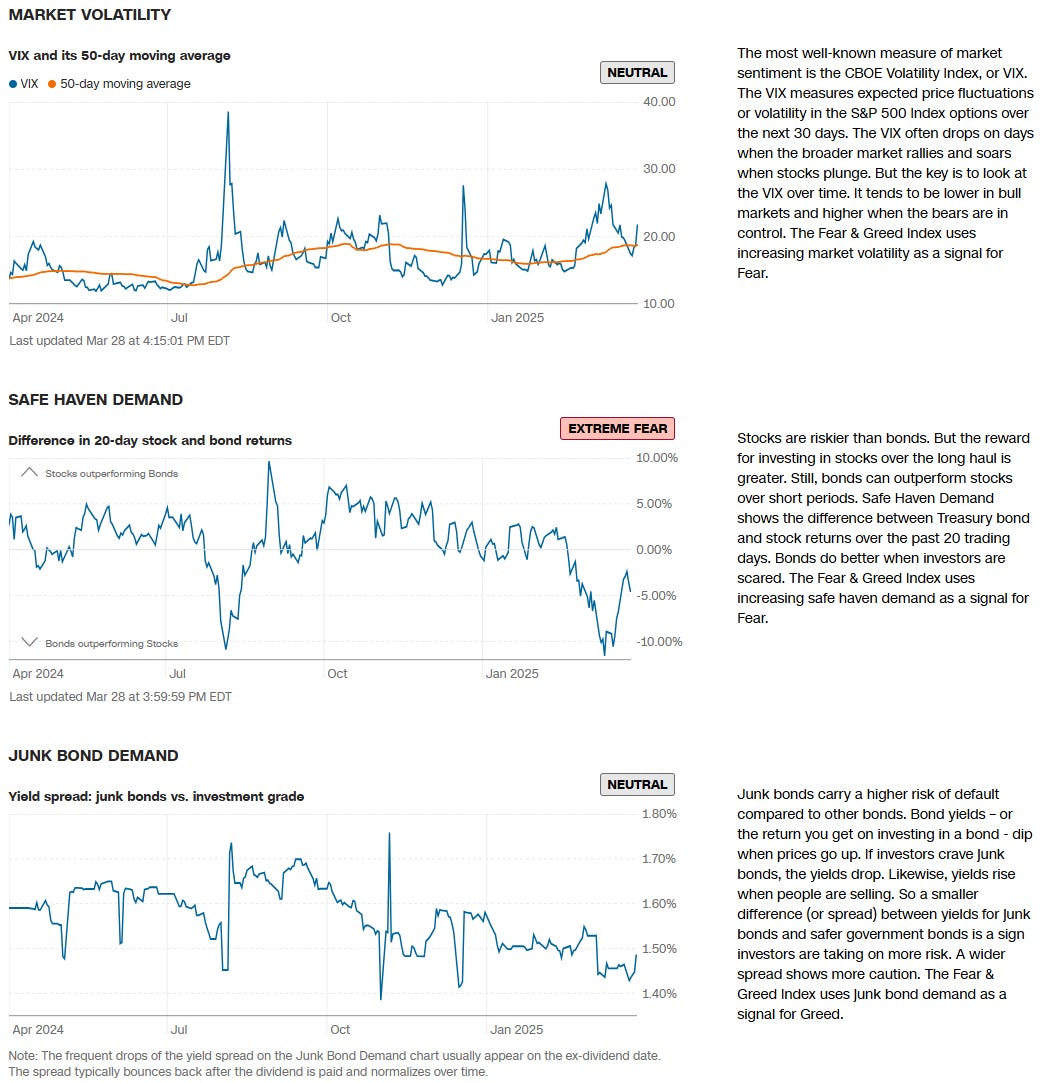
CNN Fear & Greed Constituent Data Points & Composite Index
Institutional S/R Levels for Major Indices
When you're a large institutional player, your primary goal is to find liquidity – places to do a ton of business with the least amount of slippage possible. VolumeLeaders.com automatically identifies and visually plots the exact spots where institutions are doing business and where they are likely to return for more. It's one of the primary reasons "support" and "resistance" concepts work and truly one of the reasons "price has memory".
Levels from the VolumeLeaders.com platform can help you formulate trades theses about:
- Where to add or take profit
- Where to de-risk or hedge
- What strikes to target for options
- Where to expect support or resistance
And this is just a small sample; there are countless ways to leverage this information into trades that express your views on the market. The platform covers thousands of tickers on multiple timeframes to accommodate all types of traders.
SPY 0.00%↑
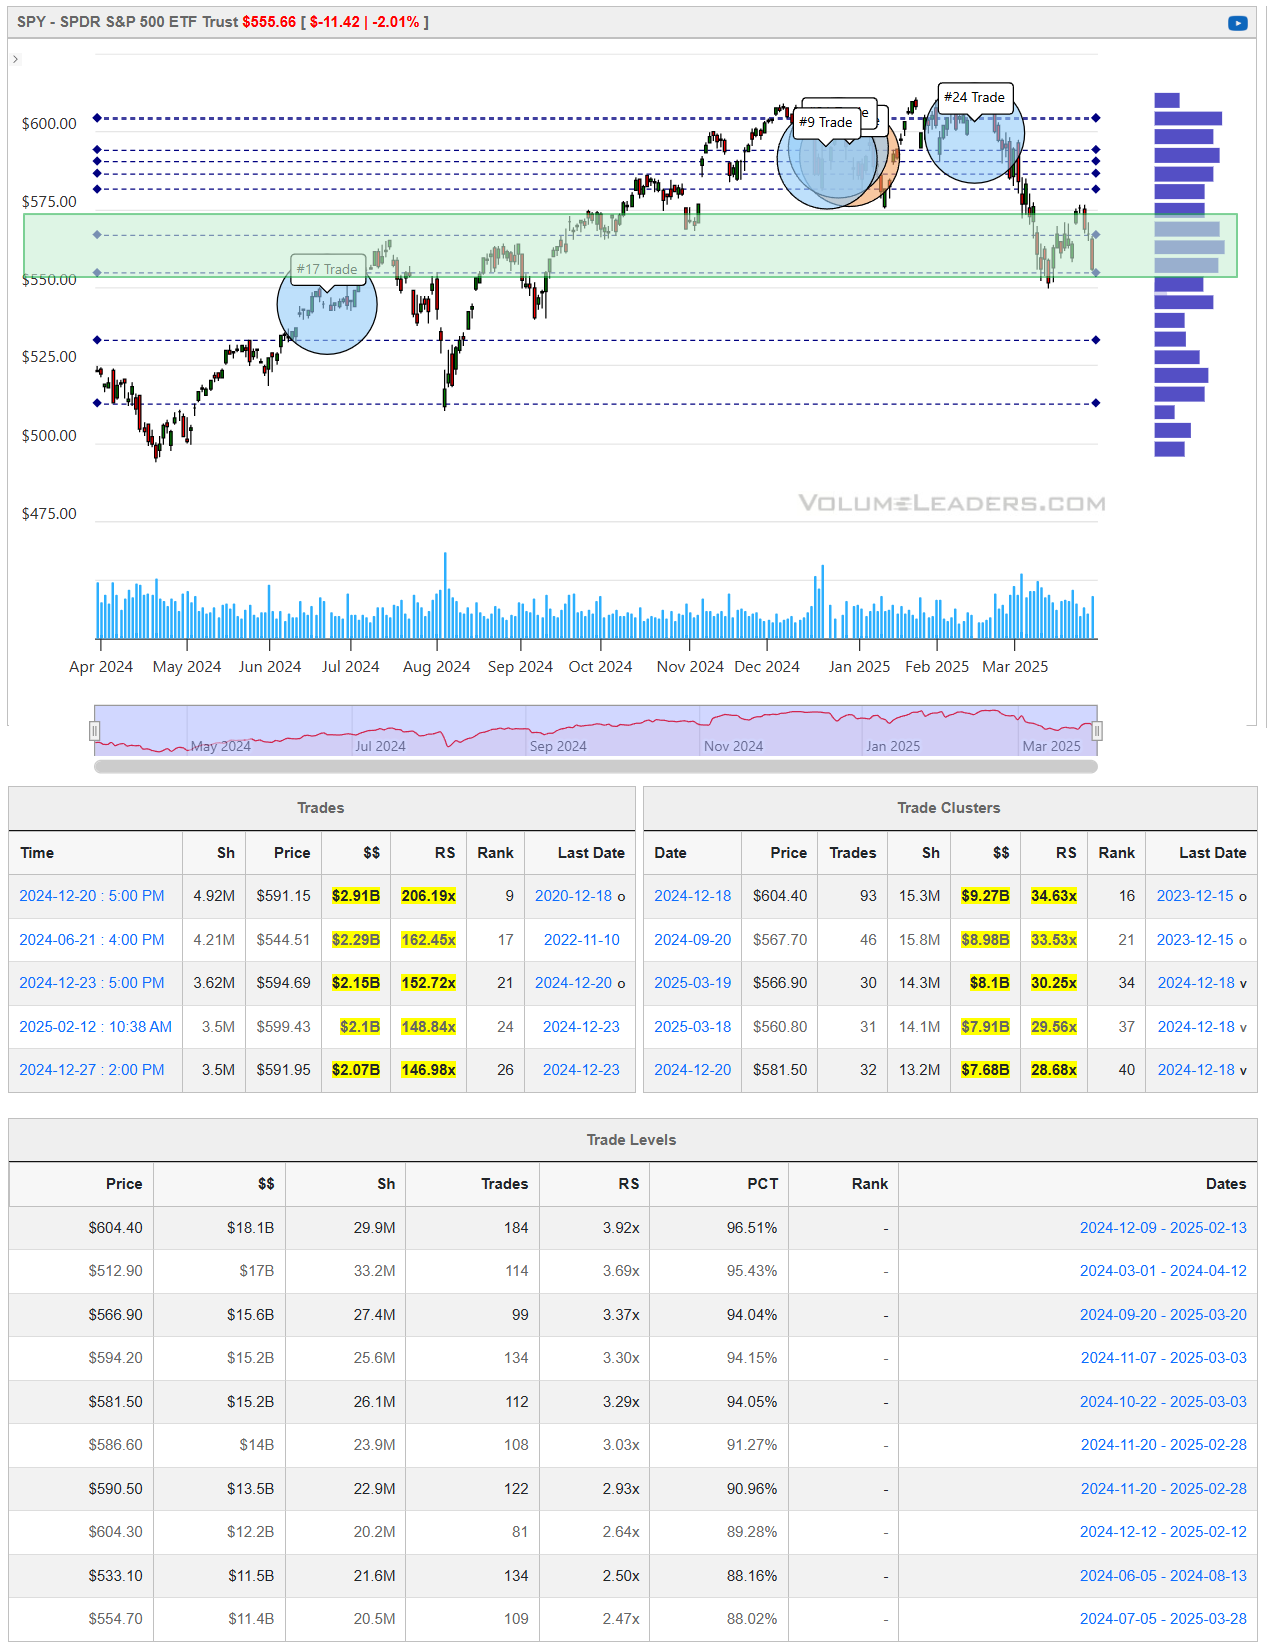
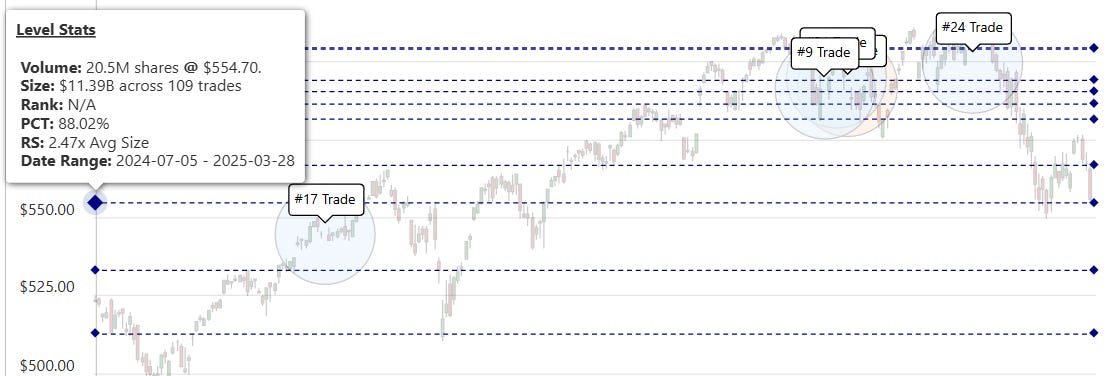
This week we're zooming out a little and looking at some higher timeframe charts due to the depth of the pullback in the markets. Through the green box we've got excellent development at levels that are viewed as historically healthy corrective moves but there is still plenty that could continue to derail the bulls. To get long, it's clear bulls want to put in a solid low in this area at the bottom of the green box/bottom of the HVN which is just about where we closed Friday and puts us a dollar off this VL level at $554.70:
Zooming out to include larger time ranges is a great way to add multi-timeframe analysis into your prep. Finding lower timeframe trades that align with the prevailing direction will certainly increase your success rate. With prices accepting lower at this time, for bulls to put in a low, they'll have to take-on all of the overhead supply that is getting shaken out:
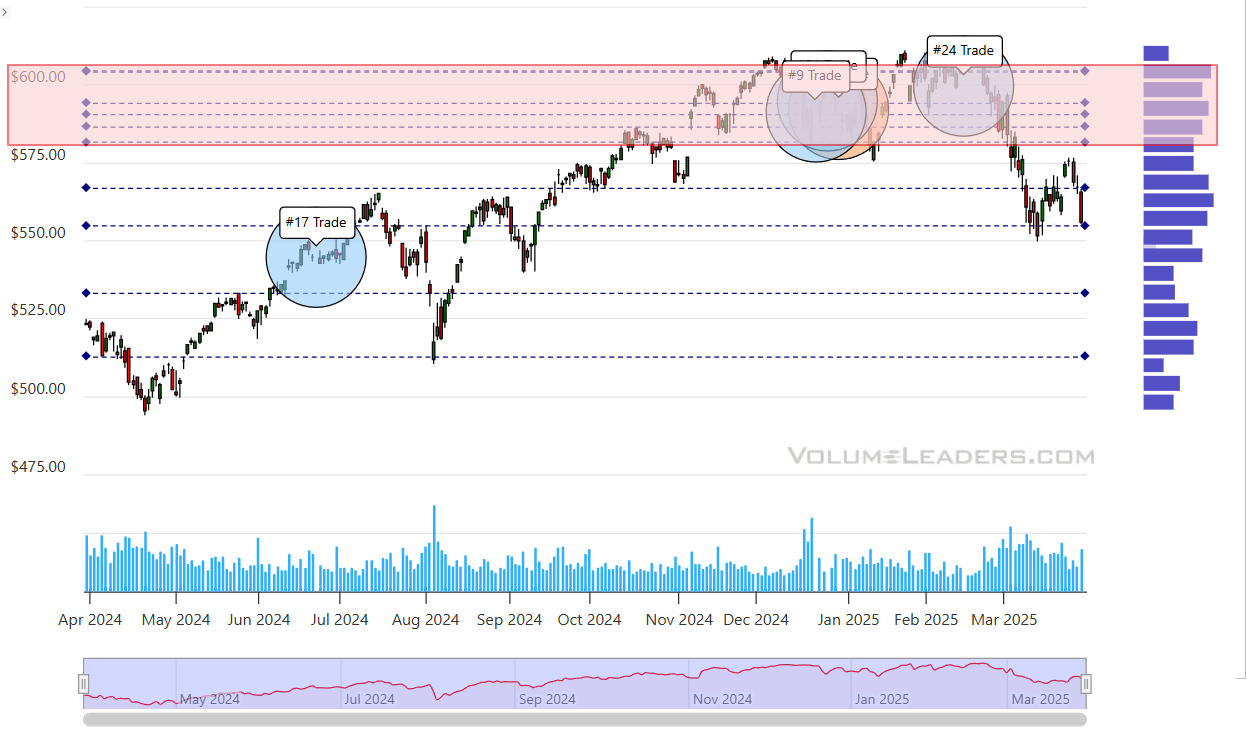
All of those levels and top-ranked trades represent inventory trapped at the highs. and price won't turn from where we are until the very last seller has sold. The development of price in this area is at least showing pause which is constructive. Bulls want to see looks below this range quickly bought-up – price should appear buoyant.
If you're a bear, you had a great opportunity to reload into the midweek lift and also got a great close on Friday. The close on the lows suggests sellers aren't finished. Price action on this daily chart has painted the classic bearish h-pattern with plenty of air underneath to the next level at $533.10. Here's everything you need to know to play this pattern for continuation to the short-side and how to get long when the pattern fails:
🧩 What is the Bearish h-Pattern?
Visually, it resembles a lowercase "h":
- Sharp leg down (the “stick” of the h)
- Weak bounce (the “hump” of the h)
- Rollover and breakdown — price fails to make a higher high and resumes selling
It shows that sellers are in control, and buyers' attempts to reverse the trend are weak and short-lived.
📉 Psychology Behind It:
- The initial leg down panics participants.
- The bounce gives hope to dip buyers — but volume and momentum fade.
- As price stalls near the bounce highs, selling resumes, trapping late longs.
- The break below the initial low confirms the pattern and often leads to a strong continuation move.
📈 Entry Opportunities
🔹 Short-Side Entry:
- Aggressive Entry:
Enter short during the bounce, ideally near a prior support-turned-resistance level, with a stop above the bounce high.- 🎯 Best risk/reward setup
- 🧠 Assumes you anticipate the pattern forming
- Confirmation Entry:
Wait for the break below the initial low, confirming the “H” structure.- ✅ Higher probability
- 📍 Lower reward since some of the move is already underway
- Place stop just above the breakdown level
🔹 Long-Side Entry:
- Aggressive Long (Reversal Play):
Enter at the base of the H before it breaks down, hoping for a double bottom or reversal.- ⚠️ High risk — price often fails to hold
- 🔒 Use tight stop just below the low
- 🪫 Often not recommended unless there’s a bullish divergence or big catalyst
- Safer Long:
Wait for the H-pattern to fail — i.e., price breaks below the low but then quickly reclaims it ("false breakdown" or bear trap).- 🔁 Indicates seller exhaustion
- 💪 Could set up for a strong bounce
- Place stop under the reclaimed low
🧠 Best Practices:
- Volume is key: Low volume on the bounce and high volume on the breakdown confirms weakness.
- Use context: H-patterns are often more reliable in downtrends, or after failed breakouts.
- Combine with indicators: e.g., order flow, volume profiles and other techniques can add confirmation…confluence is king.
The 3 other major index ETFs all appear to have the same h-pattern setup but the similarity ends there; observe where levels suggest supply and demand exist, where price is more comfortably finding support vs threatening to breakdown quite a bit further and which names have fared better in this downdraft off the highs.
QQQ 0.00%↑
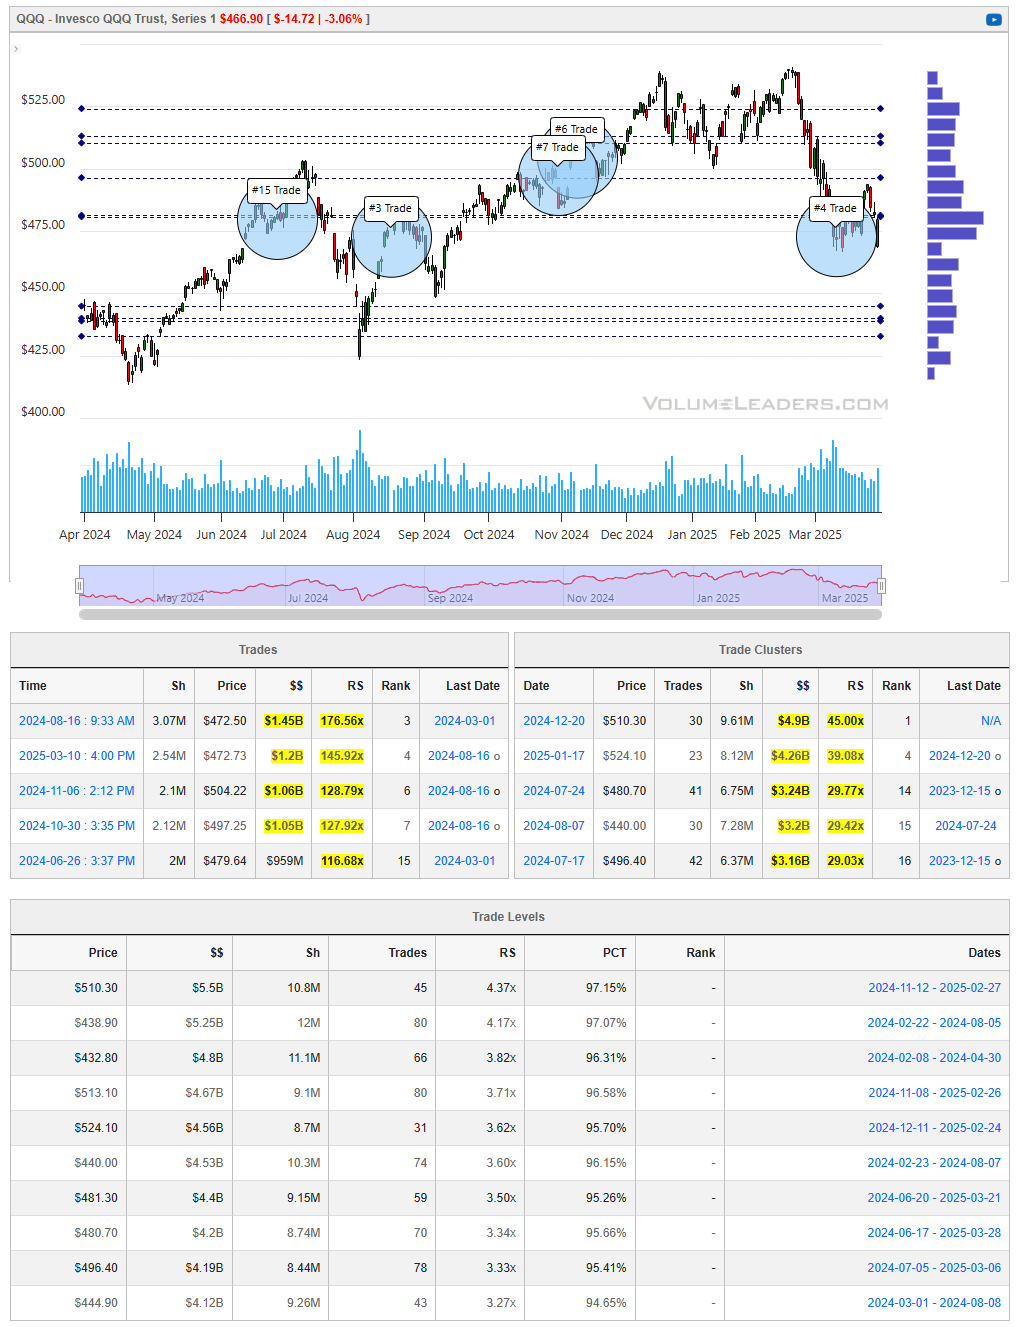
Air down to $444.90…this represents the top of the clustered levels under price that will be the next place to look for support if we sellers sustain a break below prior week lows
IWM 0.00%↑
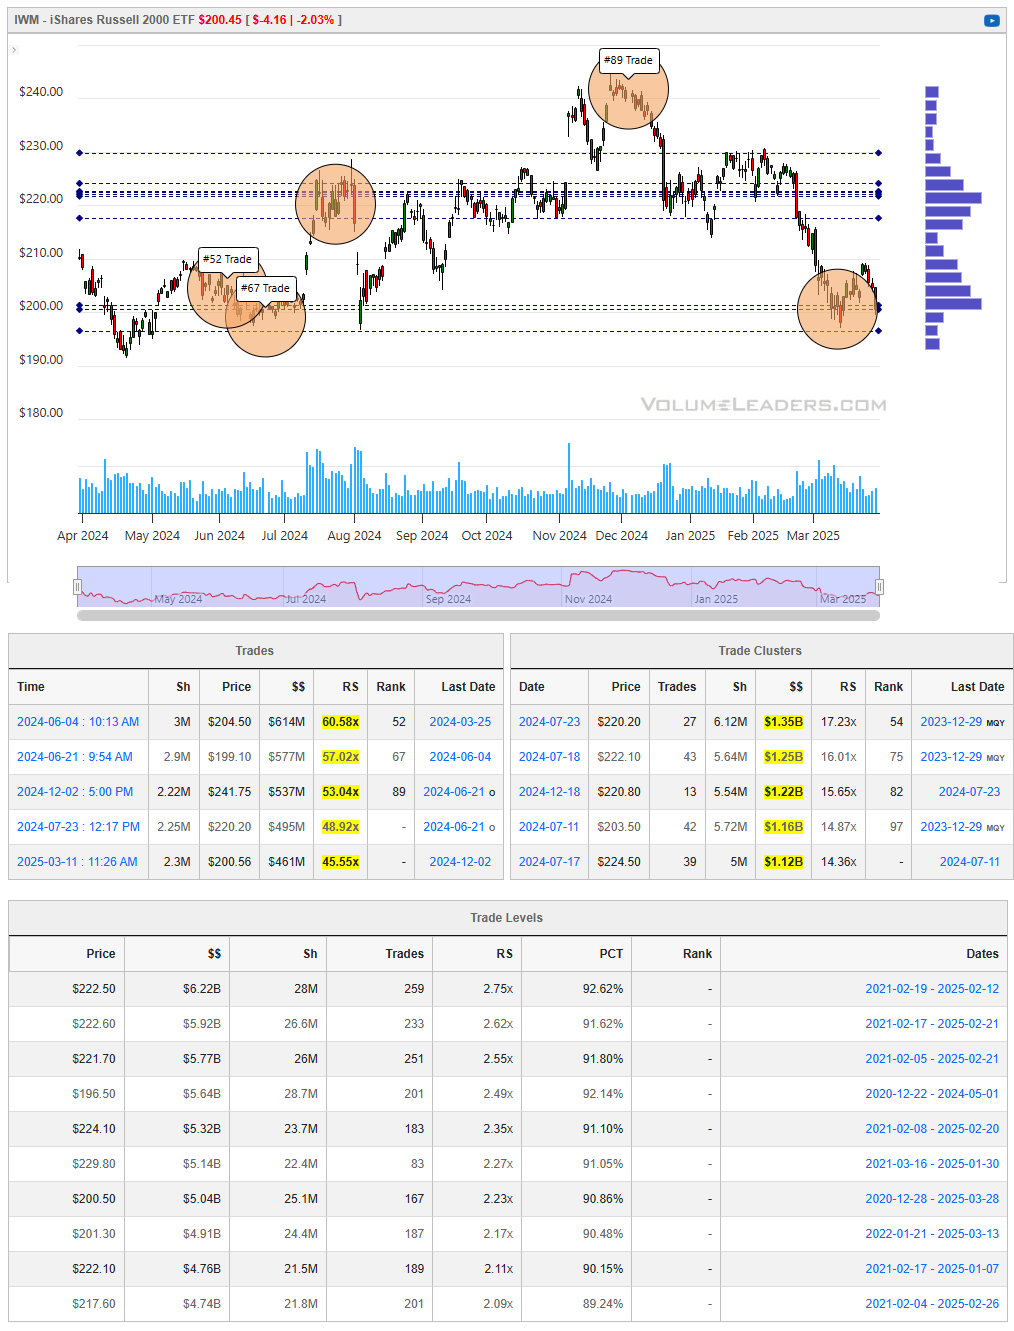
IWM development looking good through here. Still a lot of supply overhead but this is very constructive development around $200. Still needs more time in my opinion. Note how the auction moves in extensions…$20 between the two highest volume nodes and a look-above-and-fail into the next auctionable area where the #89 trade is…bulls will have their eyes here as a target down the road.
DIA 0.00%↑
DIA also moving in $20-extensions. A lot of demand underneath. If you're a seller and you get into $400, I would keep my fingers on the flatten button as I fully expect buyers to be very responsive here.
Institutional Order Flow
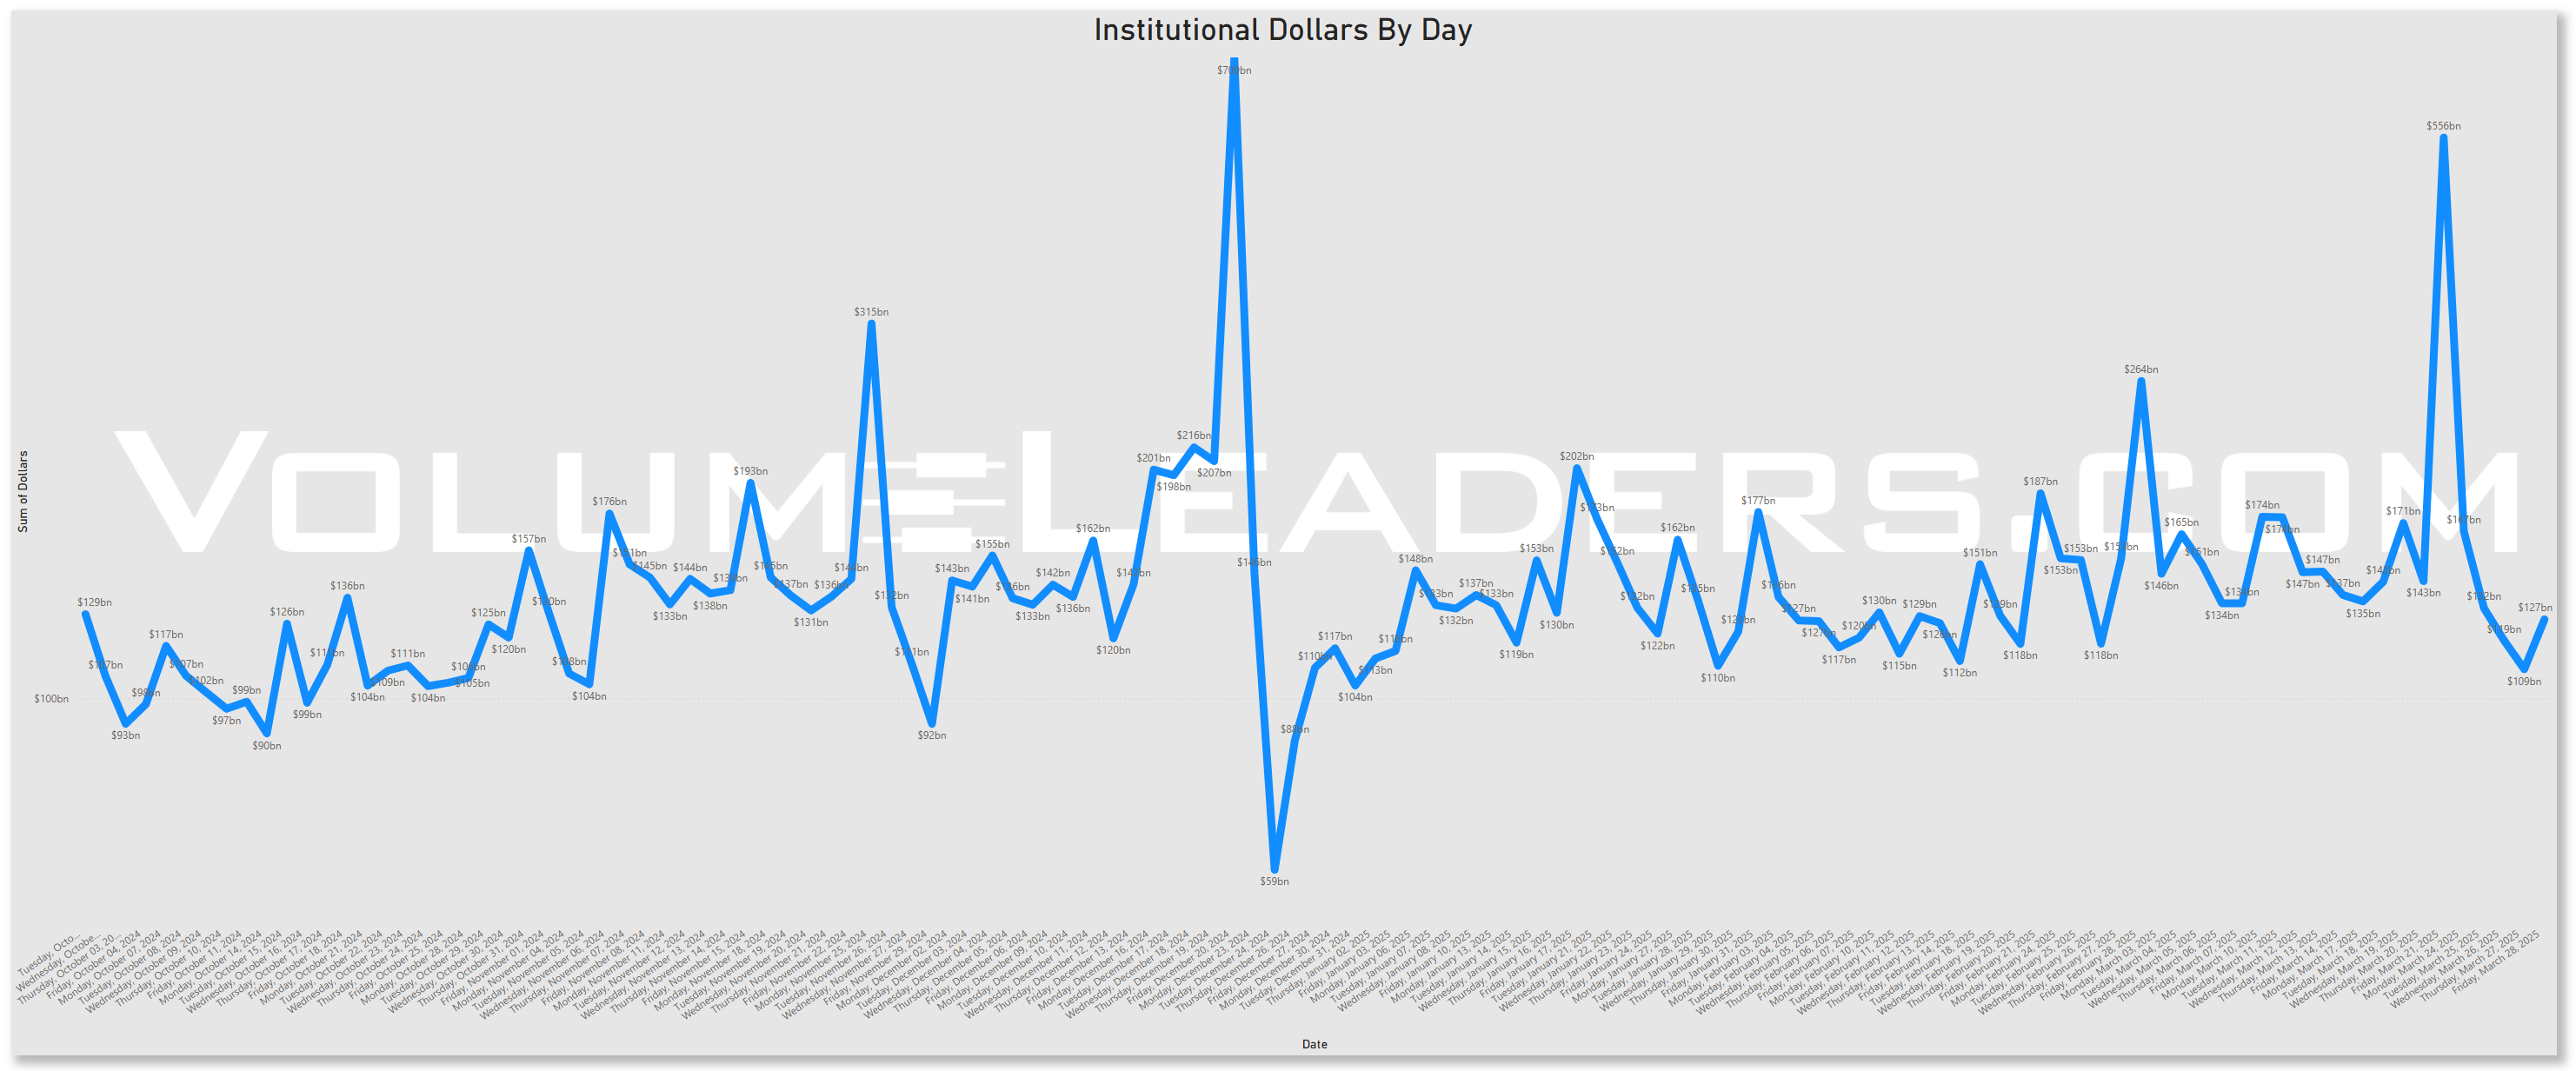
Rolling 90-Day Dollars By Day
This chart shows institutional activity by dollars by day on a rolling 1-year basis. From a theoretical standpoint, examining a chart of daily institutional dollar activity over the course of a year can offer several insights and possible inferences, though all should be approached with caution since the data alone may not prove causality or confirm underlying reasons. Some potential takeaways include:
- Event-Driven Behavior:
Sharp, singular spikes on certain days might correlate with major market-moving events. These could include central bank policy announcements, significant geopolitical news, sudden macroeconomic data releases (like employment reports or GDP data), earnings seasons for large-cap companies, or unexpected shocks (e.g., mergers, acquisitions, regulatory changes). - Liquidity Dynamics:
Institutions often concentrate large trades on days with higher expected liquidity. For instance, heightened activity might coincide with index reconstitutions, option expiration dates, or the days leading up to or following a major index rebalance, when large amounts of capital shift hands simultaneously. - Risk Management and Hedging Activity:
Institutions may significantly adjust their exposures on days that are critical from a risk management perspective. Large spikes can occur if hedge funds, pension funds, or asset managers are rolling over futures contracts, initiating or closing out large hedges, or reacting to volatility triggers. - Market Sentiment Indicators:
While the data is purely transactional, the sheer volume of institutional involvement on certain days might indirectly hint at changing sentiment or strategic shifts.
In essence, a chart like this can lead you to hypothesize that institutional trading volumes are not constant or random but rather influenced by a mix of predictable calendar effects, major market events, liquidity considerations, risk management decisions, and strategic allocation shifts.
Top Institutional Order Flow By Sector By Week For The Past 90-Days
Top Institutional Order Flow In Equities
These are incredibly important charts to watch as they contains lots of nuanced suggestions at a thematic level. Watch these charts closely week-to-week to stay informed about where institutional money is flowing, adjust your strategies based on momentum, align your portfolio with macroeconomic and market trends, and manage risks more effectively by avoiding sectors losing institutional favor.
- Sector Rotation Insights: The chart highlights which sectors are attracting institutional activity and which are losing favor. Institutions often lead market trends, so tracking shifts in their focus can indicate sector rotations.
- Sentiment Analysis: The level of institutional activity reflects confidence in specific sectors. Rising activity in traditionally defensive sectors (e.g., healthcare, utilities) may indicate caution, while a surge in growth sectors (e.g., technology, consumer discretionary) could suggest optimism.
- Emerging Trends: Sudden spikes in a previously overlooked sector, like industrials or consumer staples, might hint at emerging opportunities or structural shifts.
- Macro Themes: Changes in sector activity often align with broader macroeconomic themes like inflation, interest rates, or geopolitical events. For instance:
- Increased activity in energy might indicate concerns about oil supply or rising prices.
- Growth in technology could align with innovations or favorable policies.
- Risk Management: Declining institutional activity in a sector might signal weakening fundamentals or heightened risks.
- Spotting Overcrowding: Excessive activity in a single sector over multiple weeks may suggest overcrowding, which could lead to heightened volatility if institutions begin to exit.
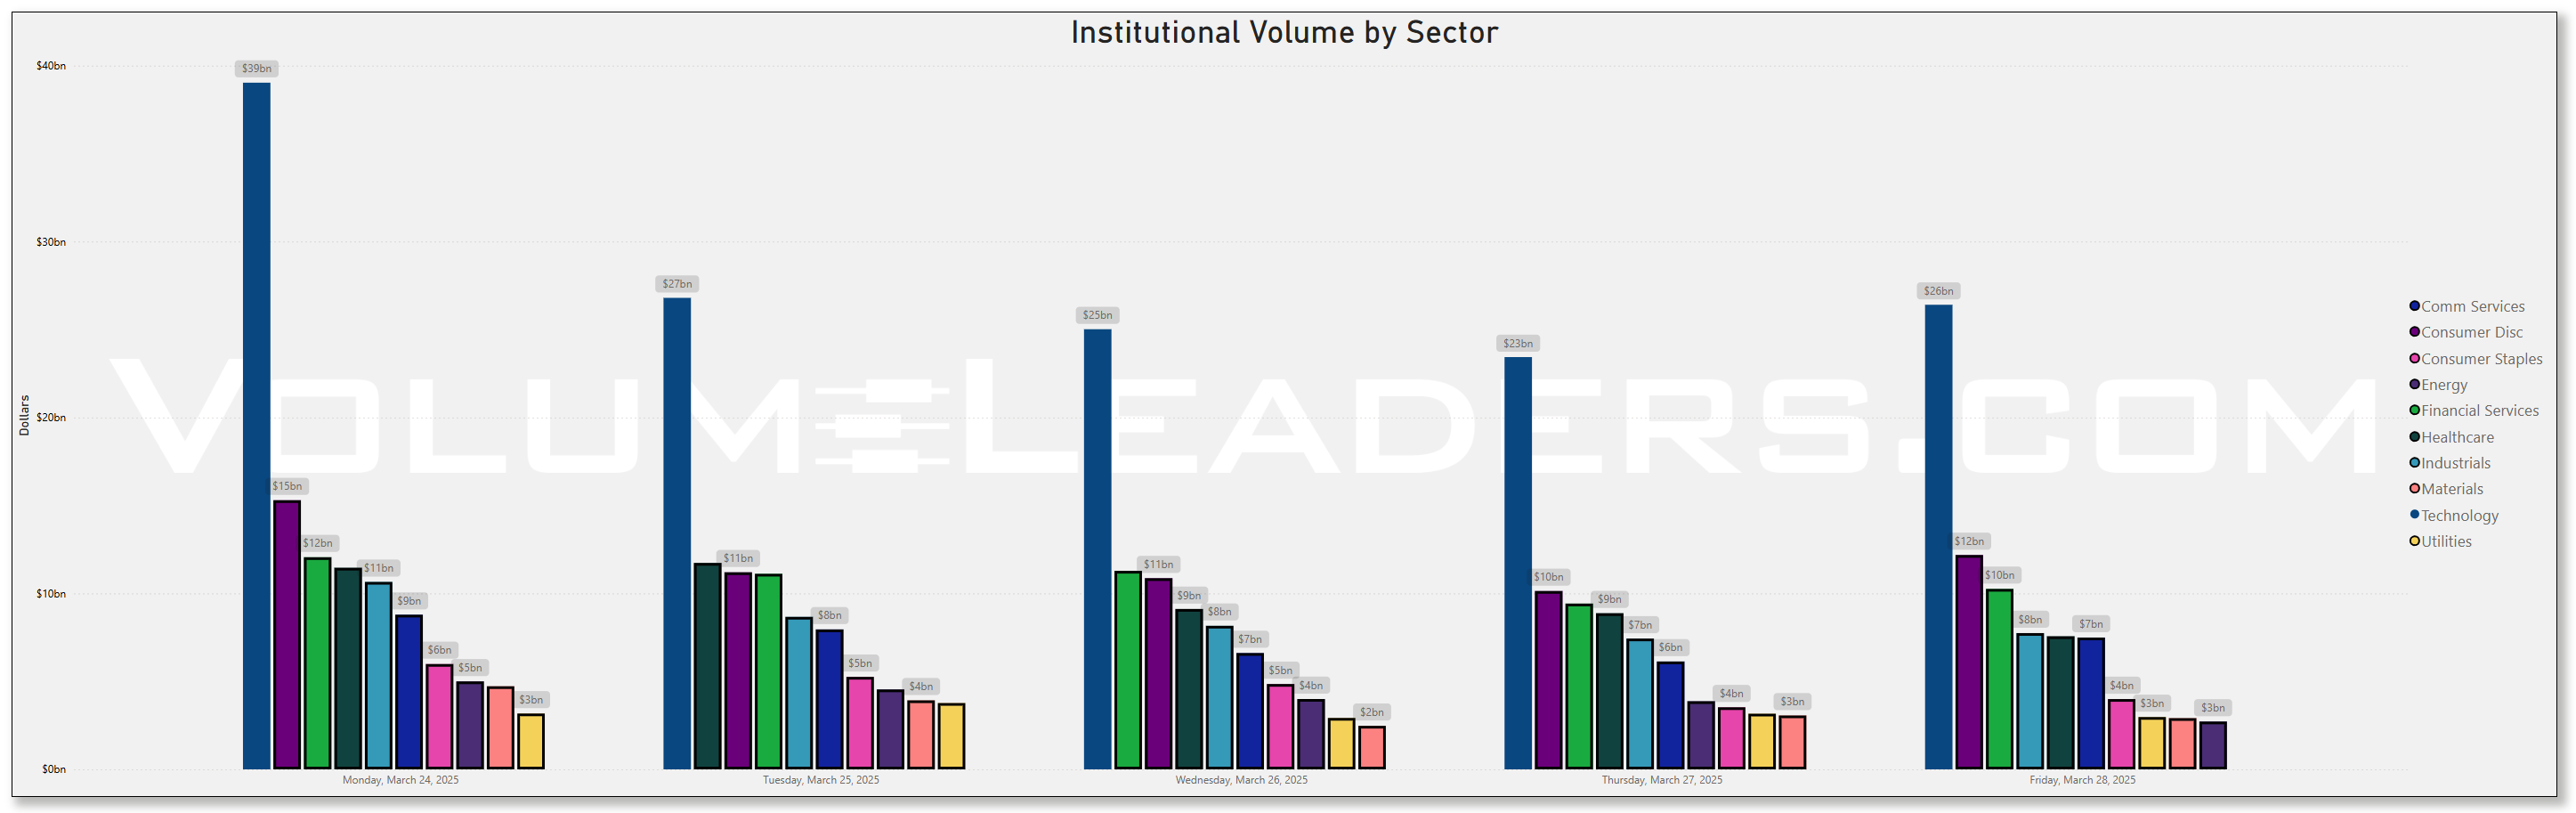
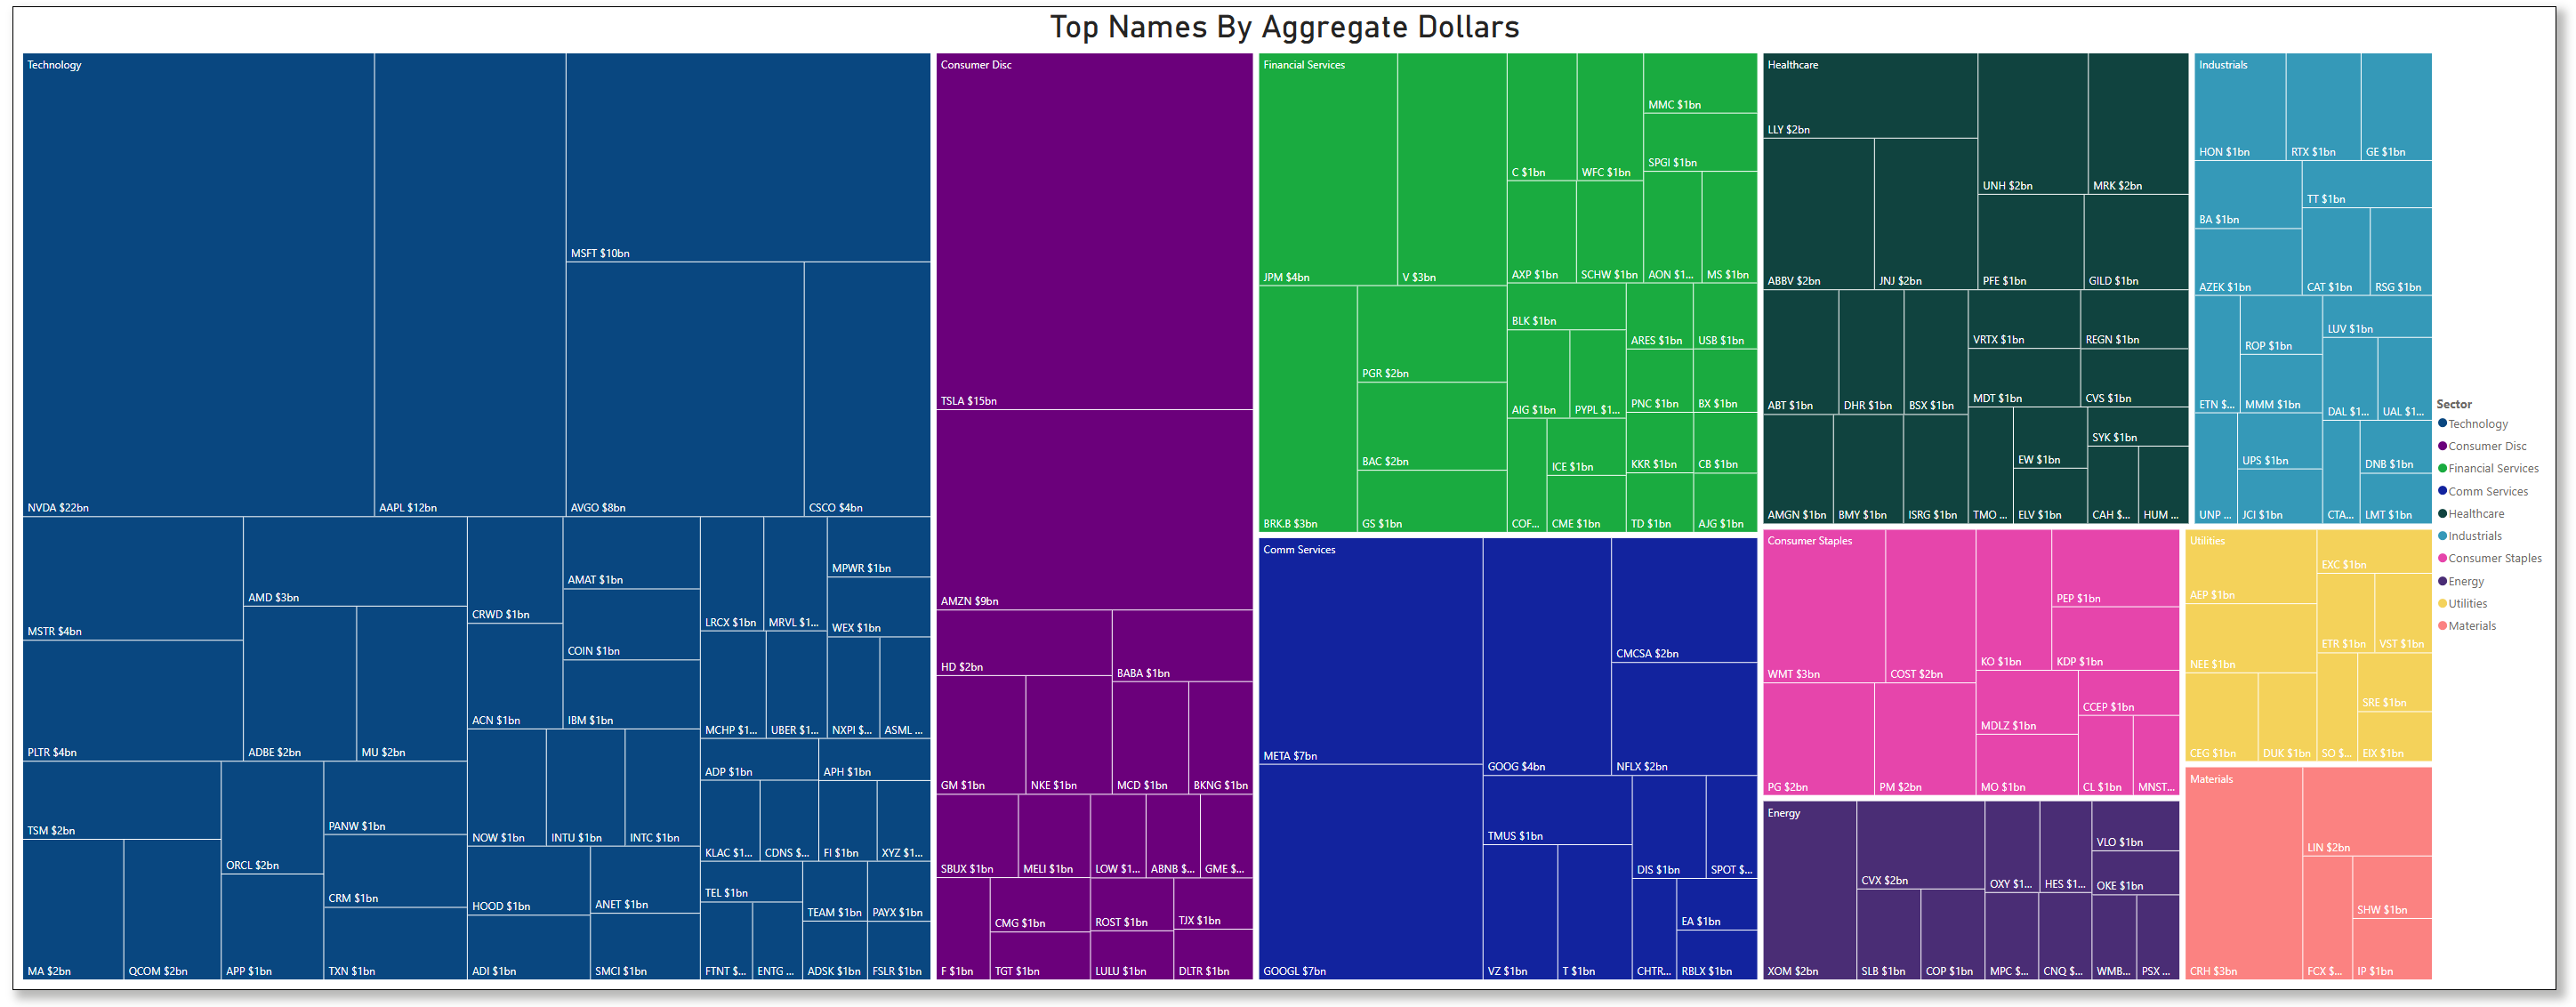
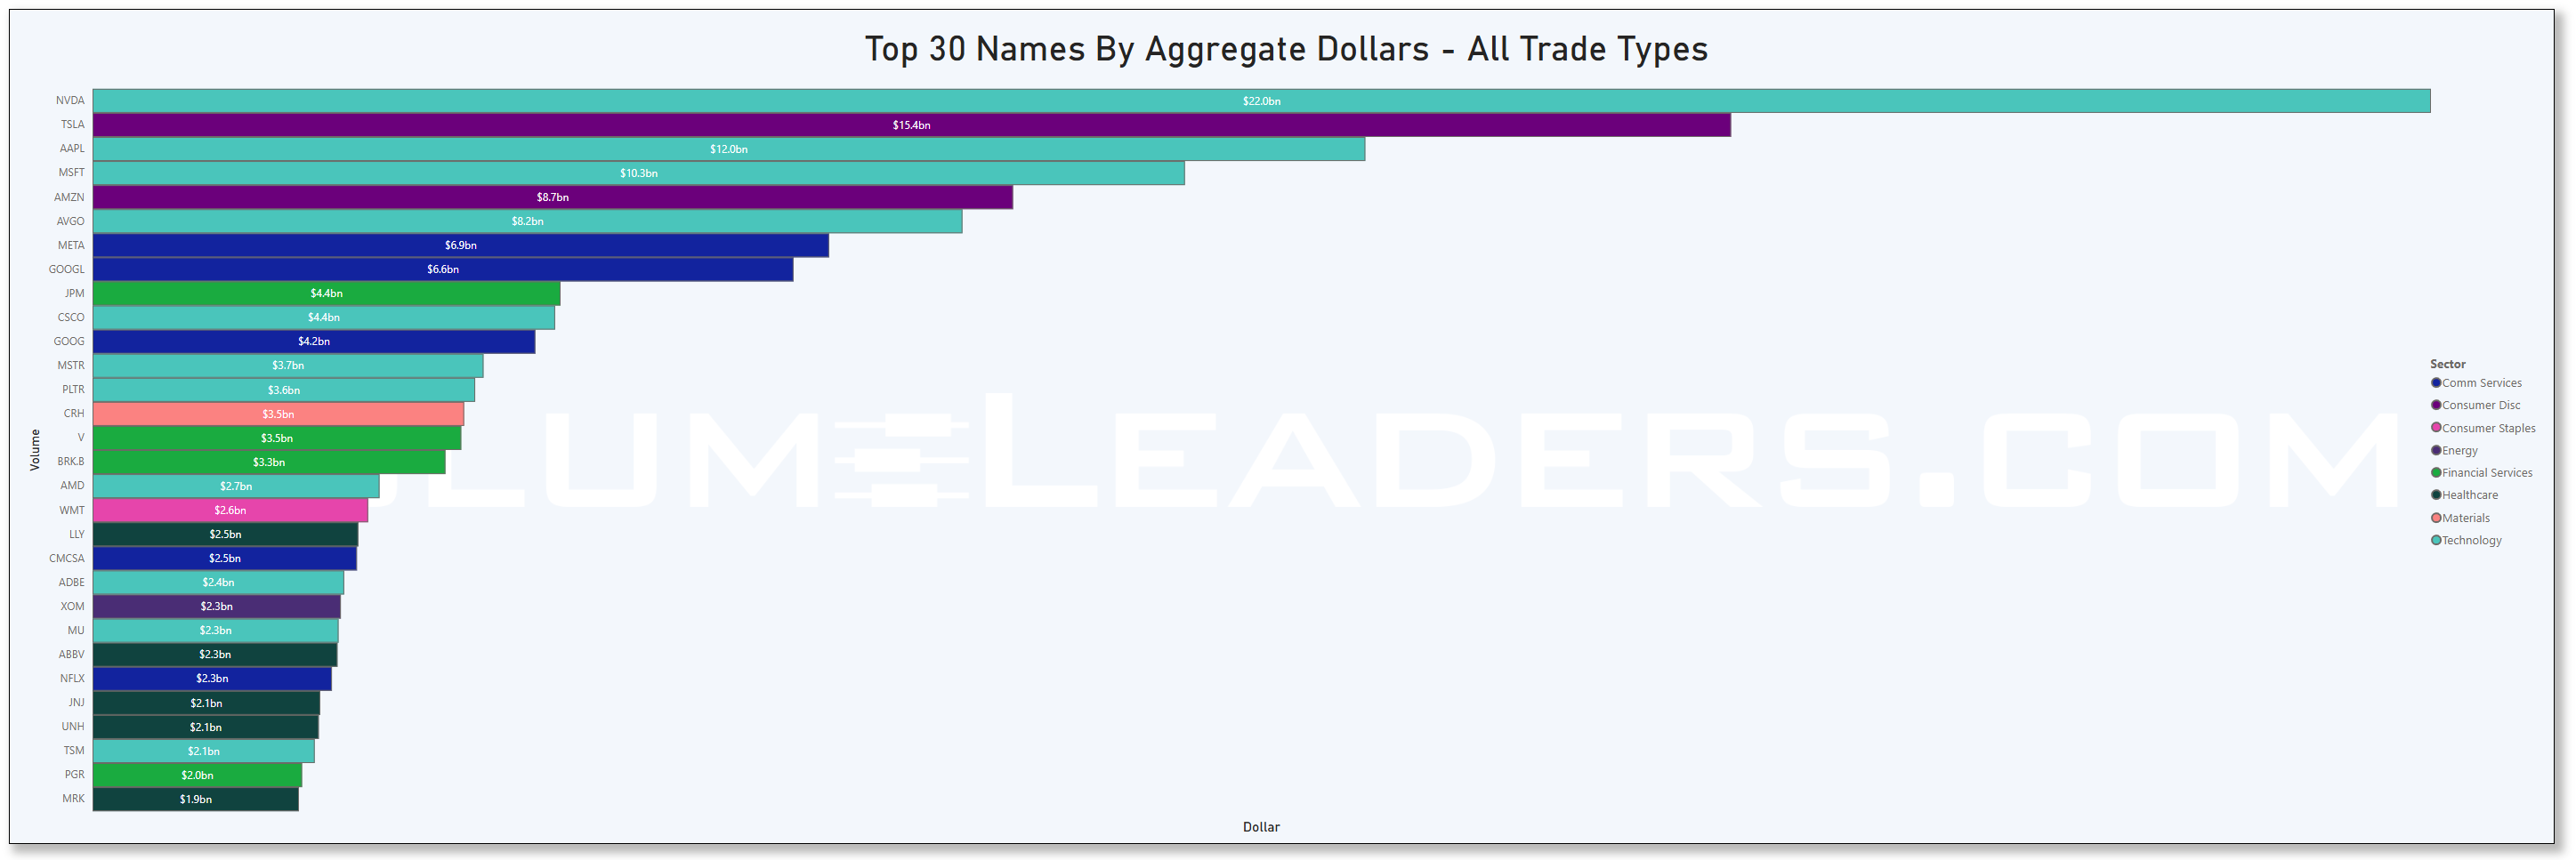
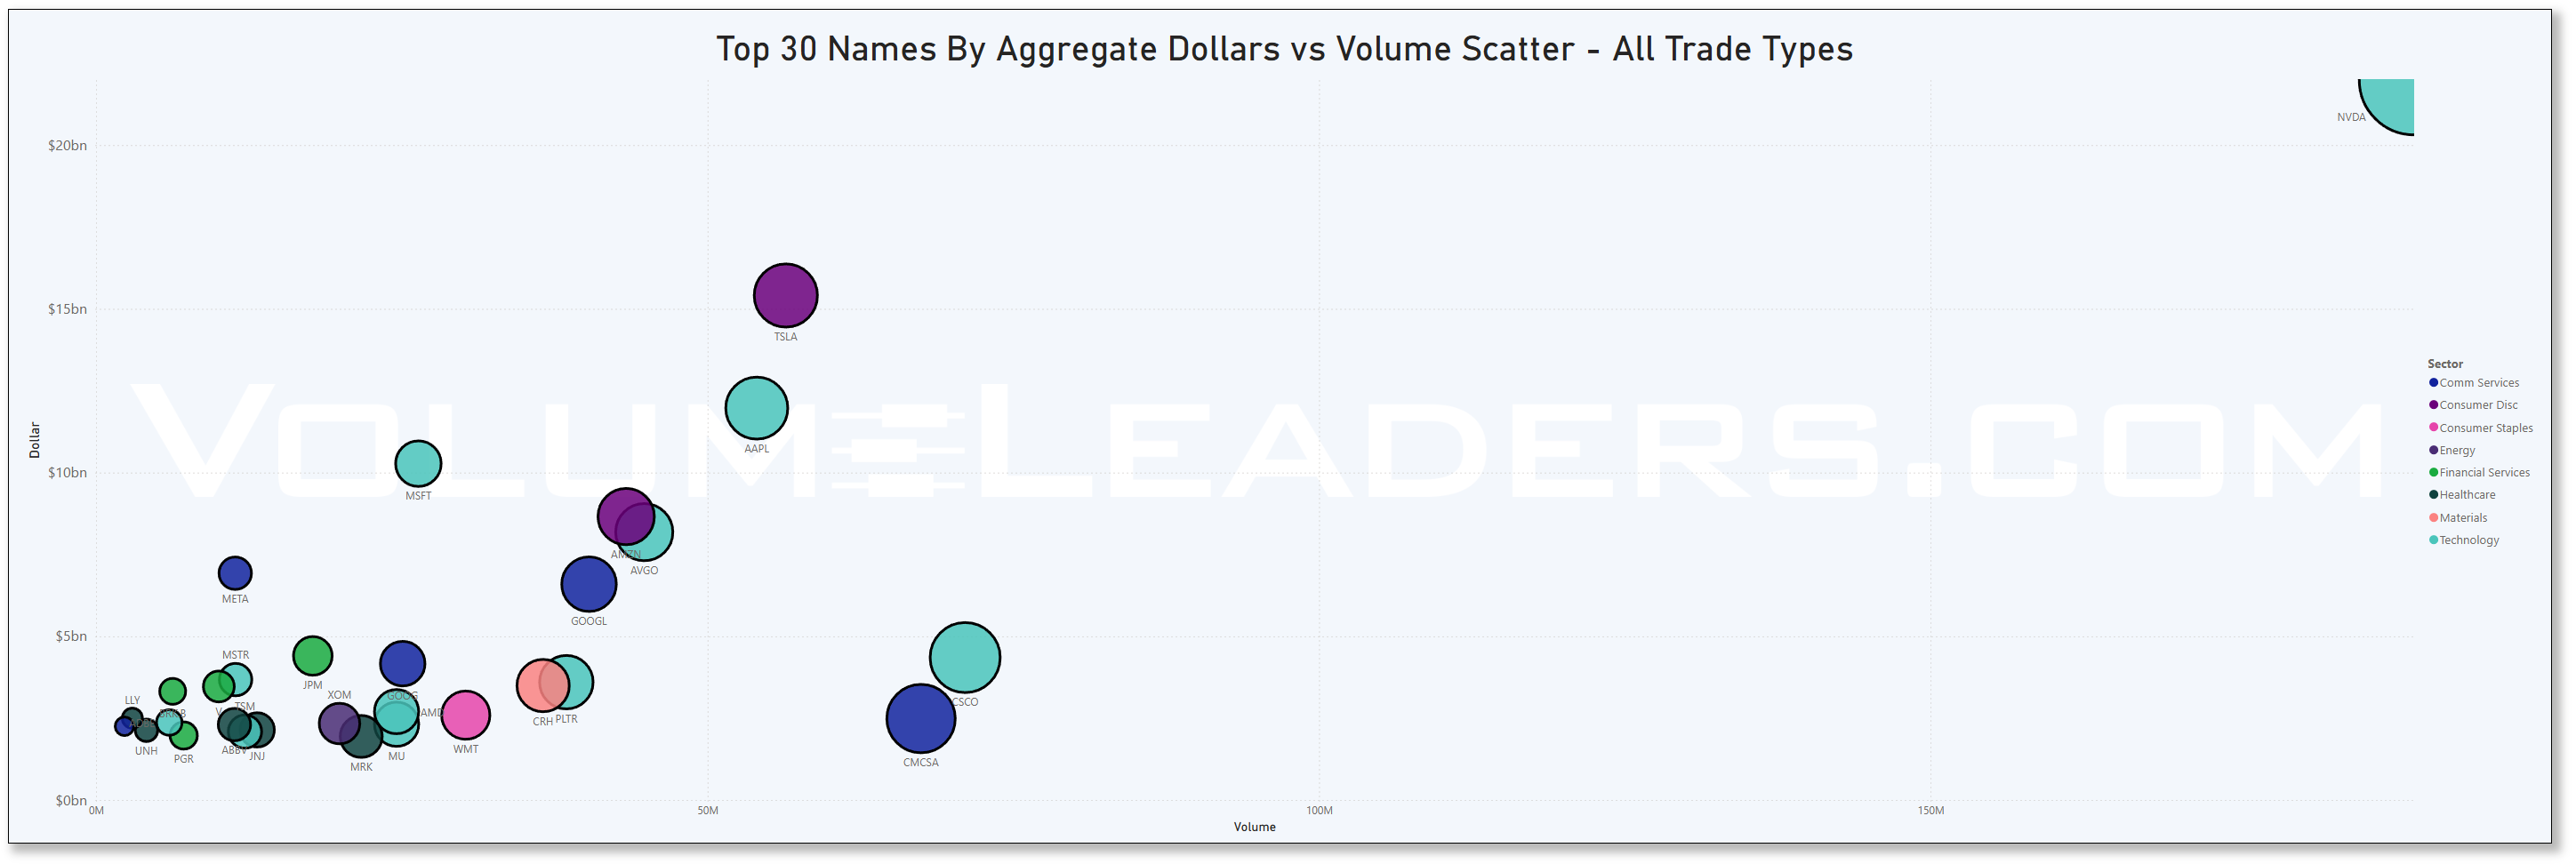
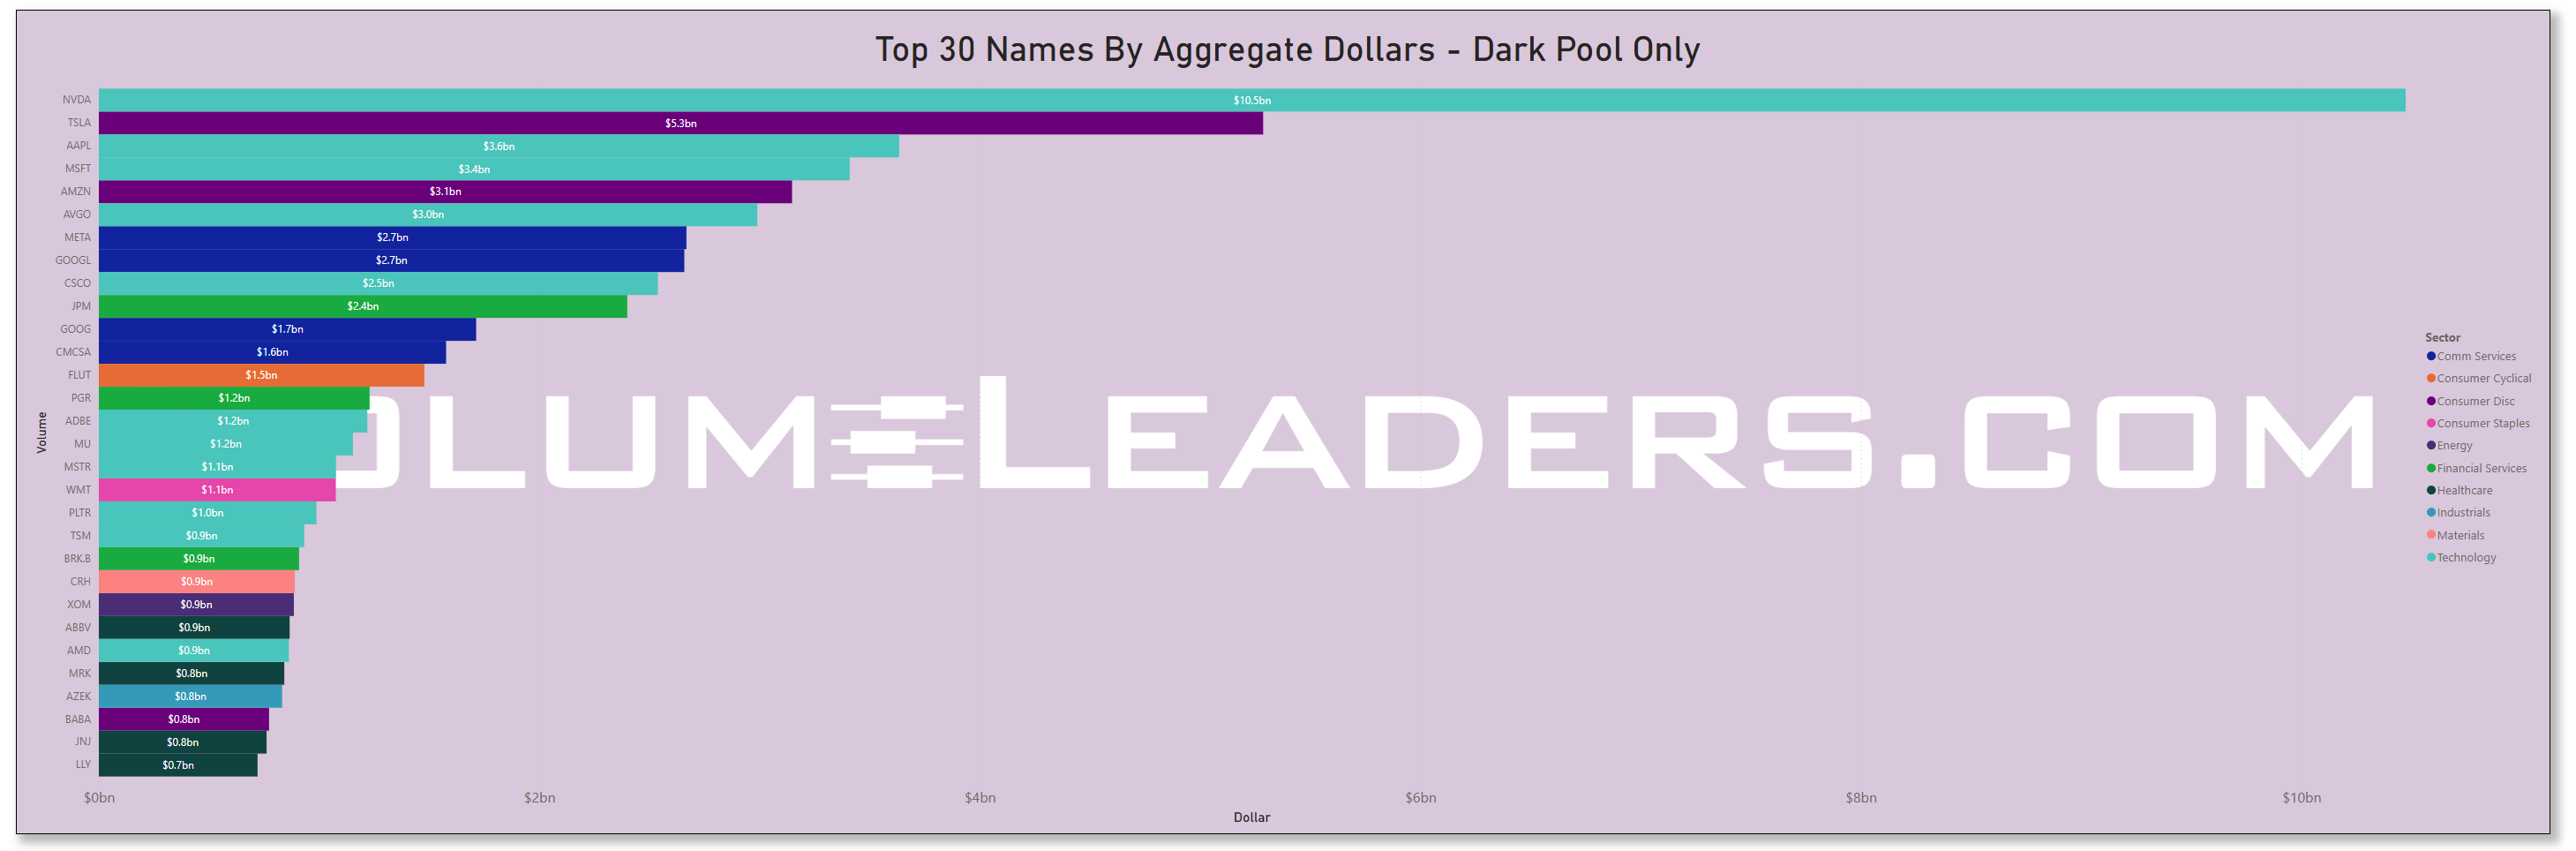
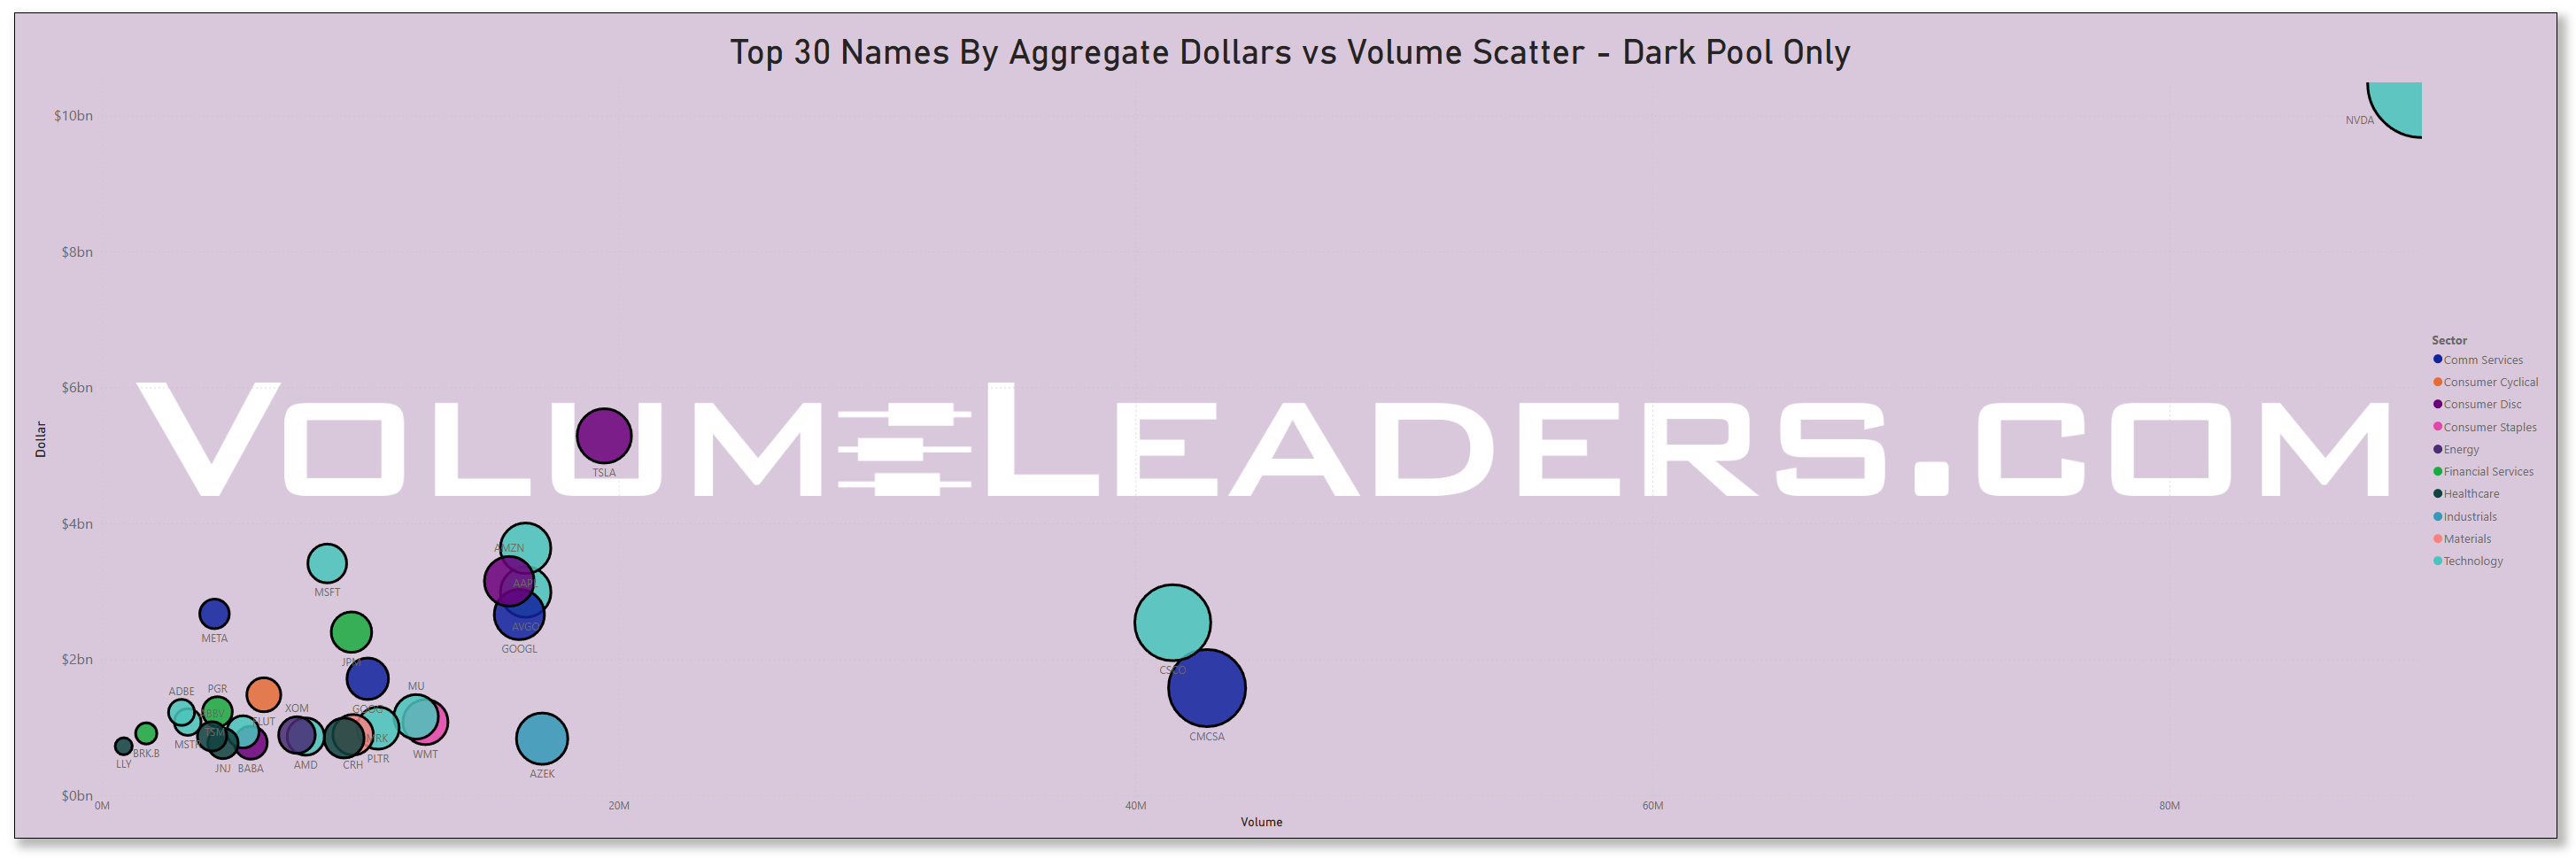
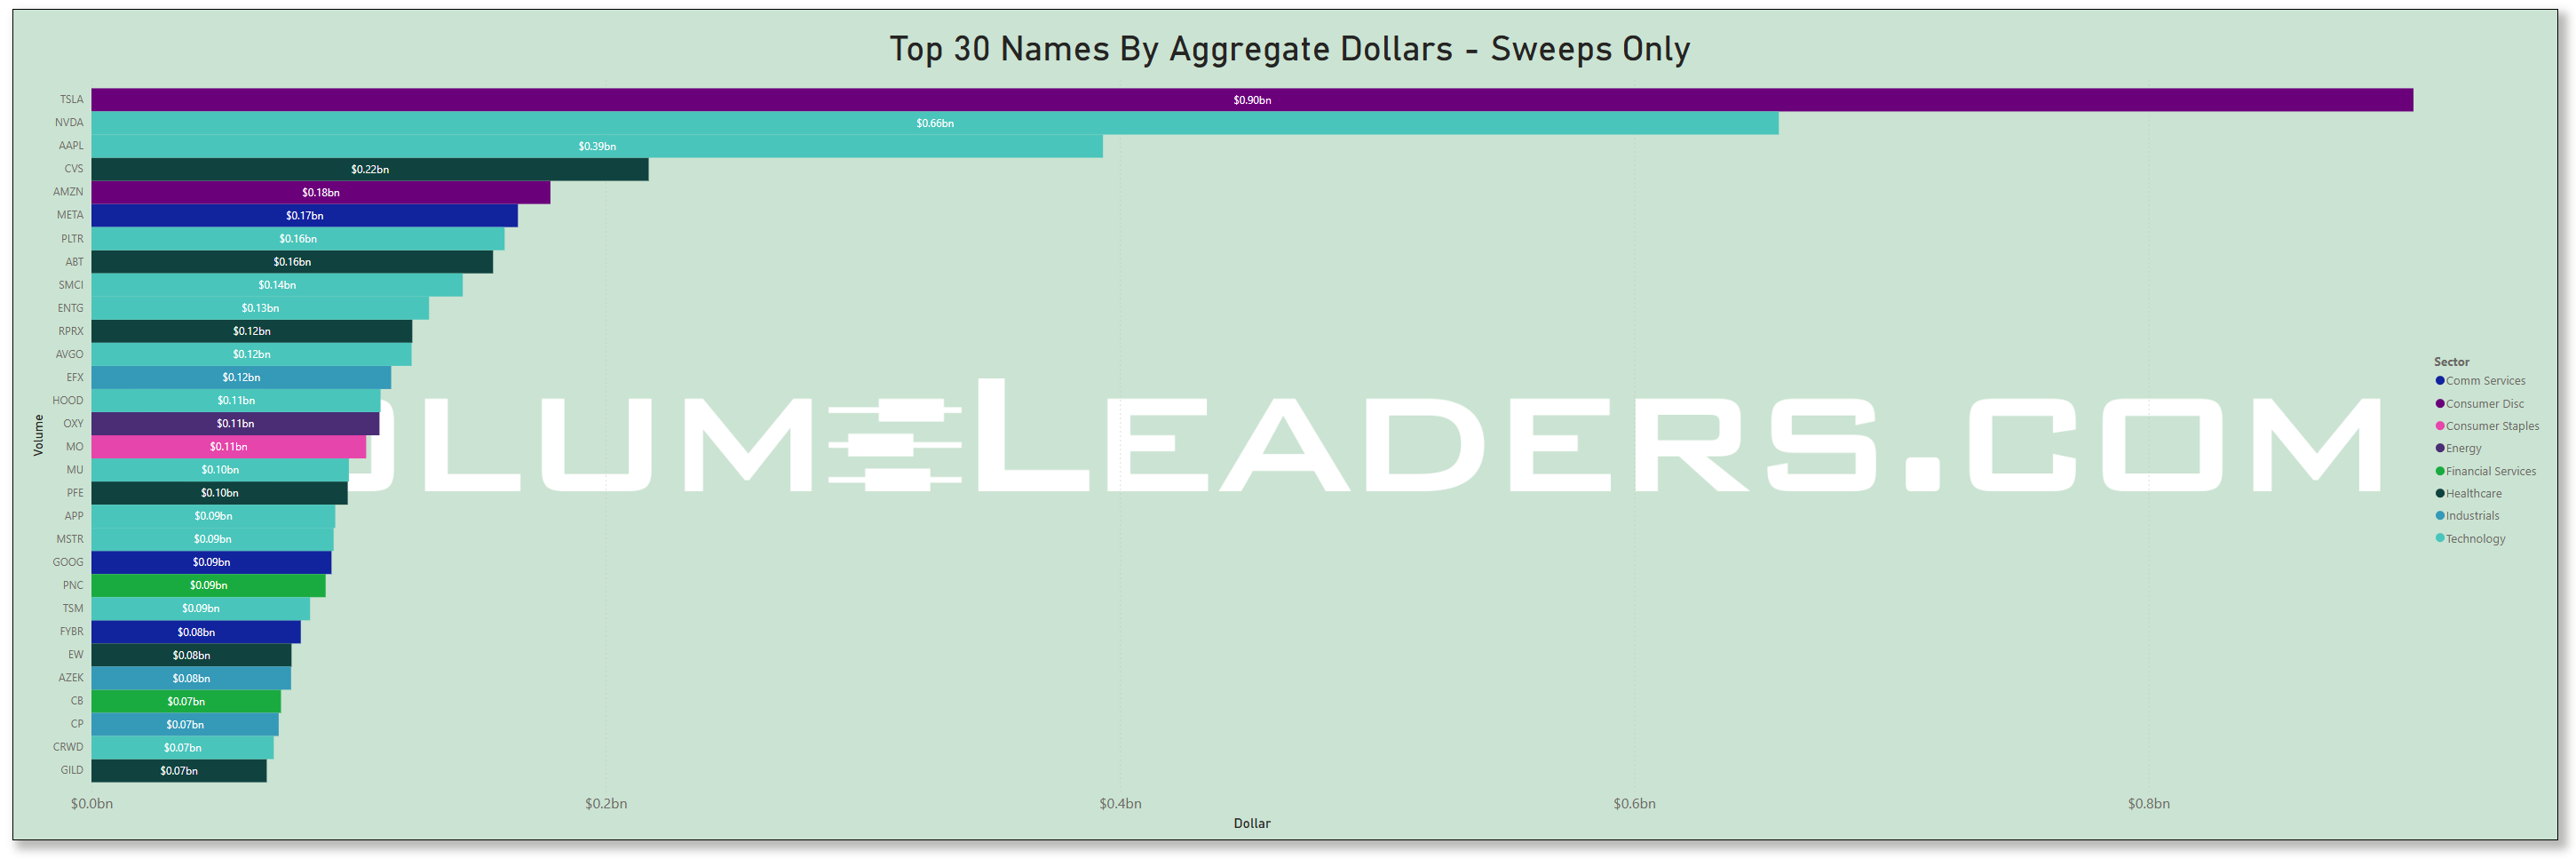
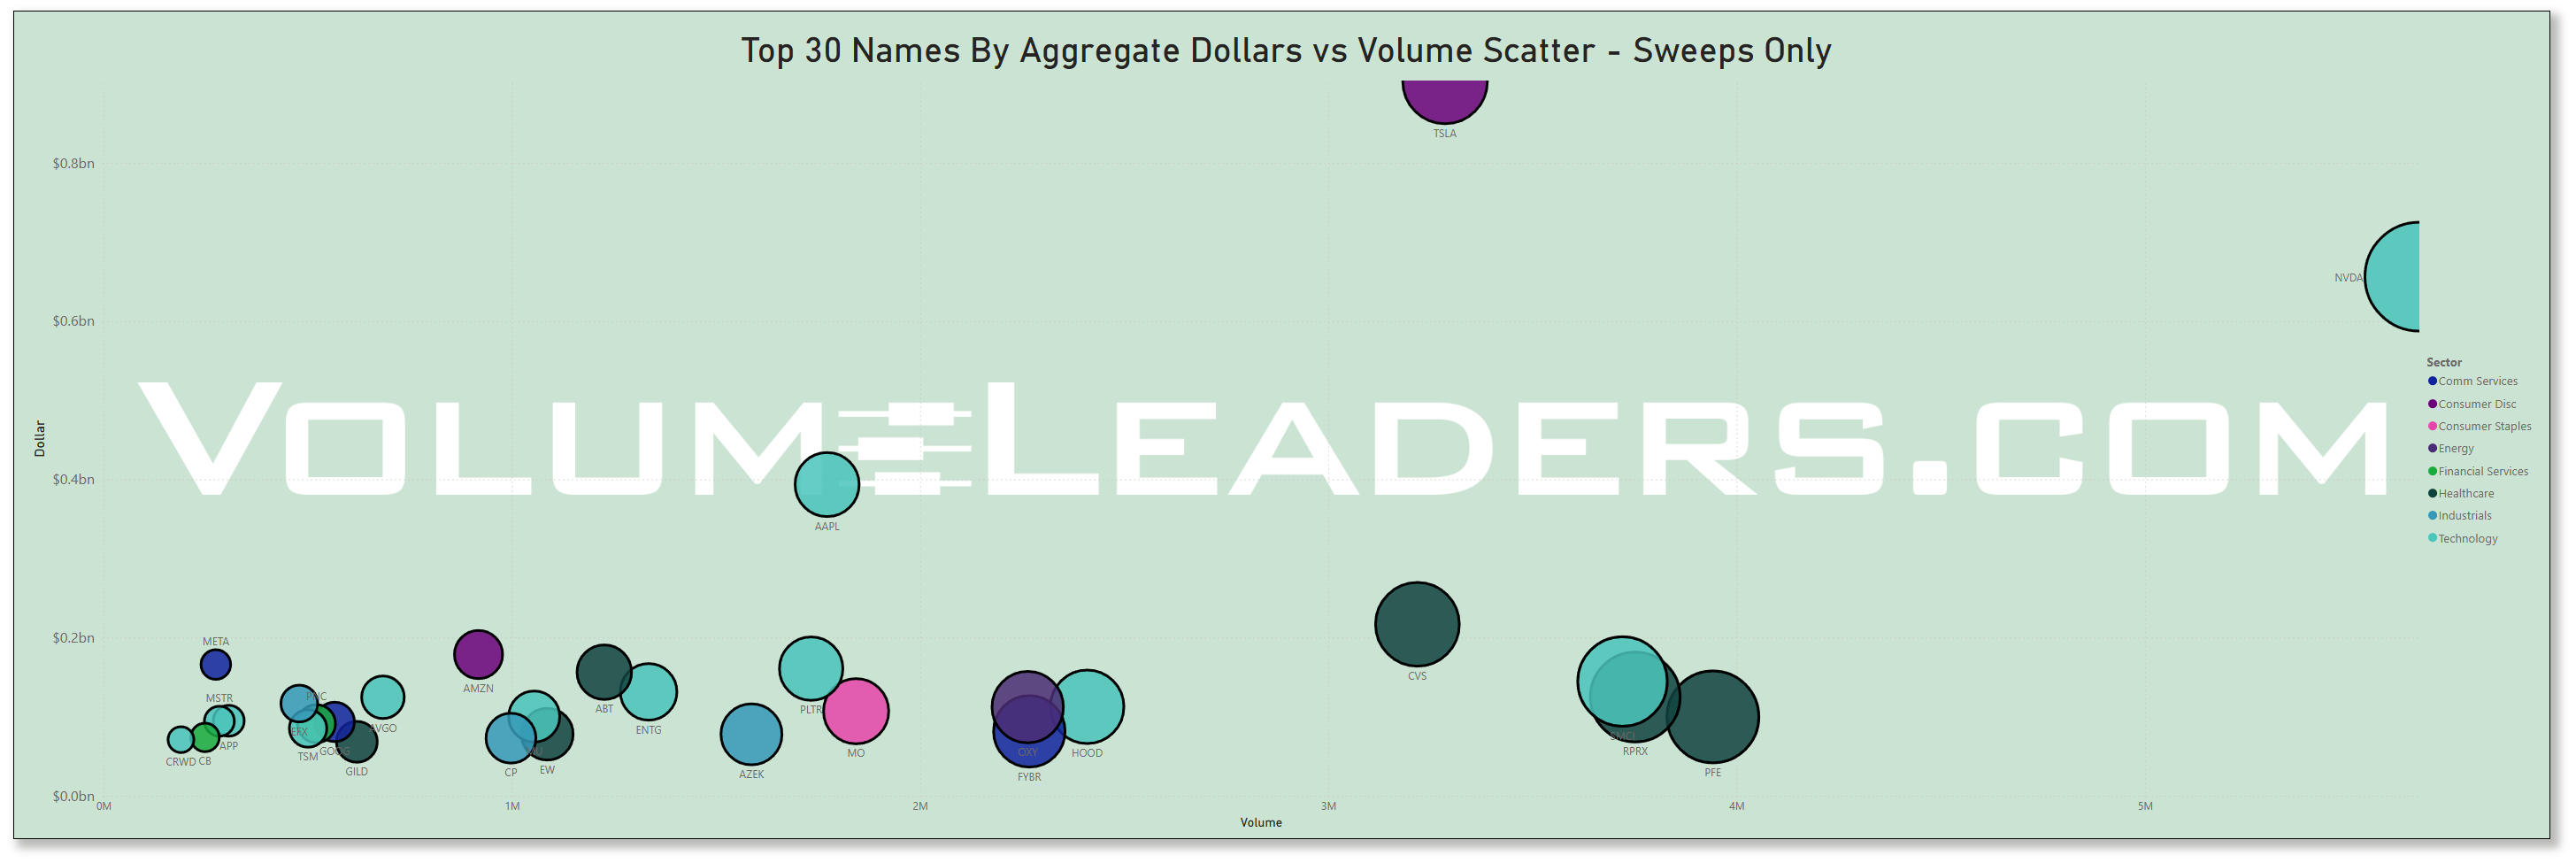
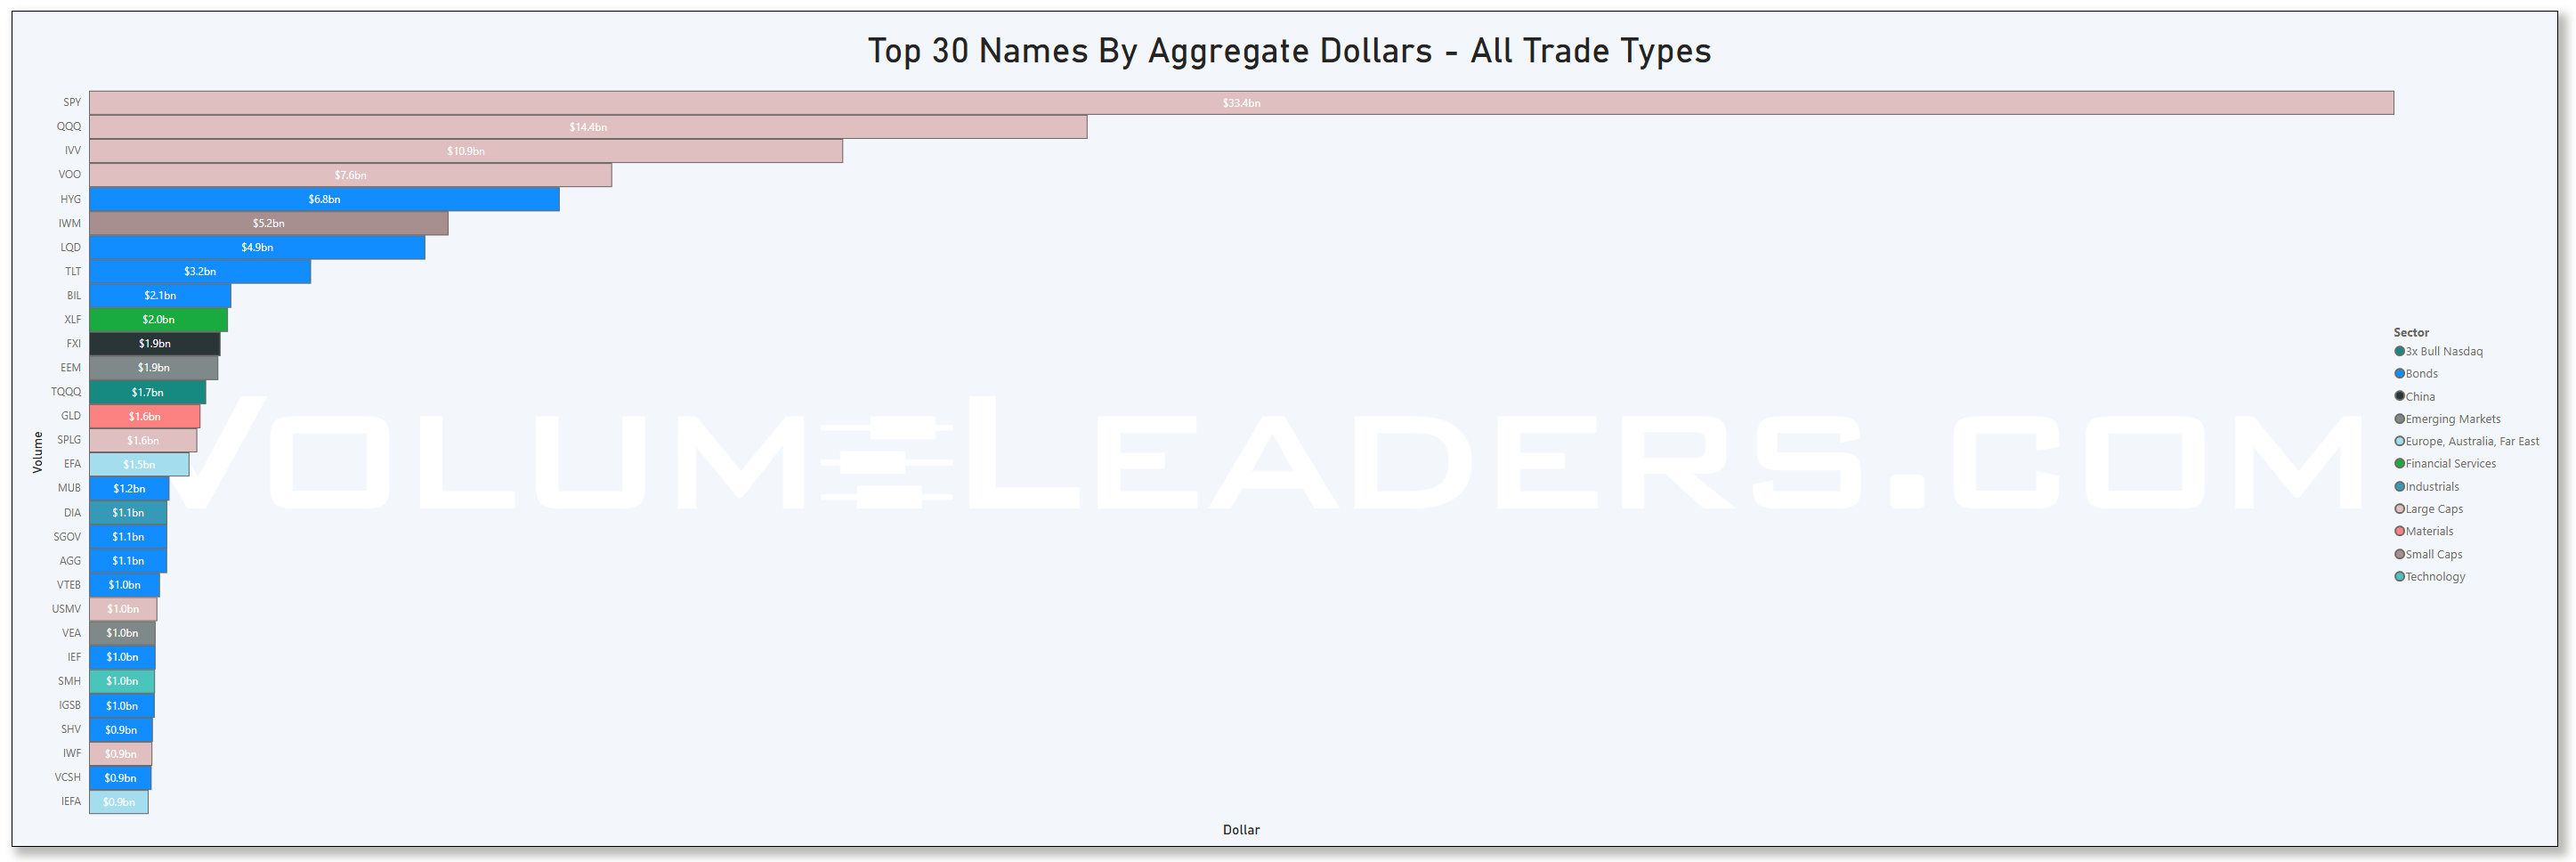
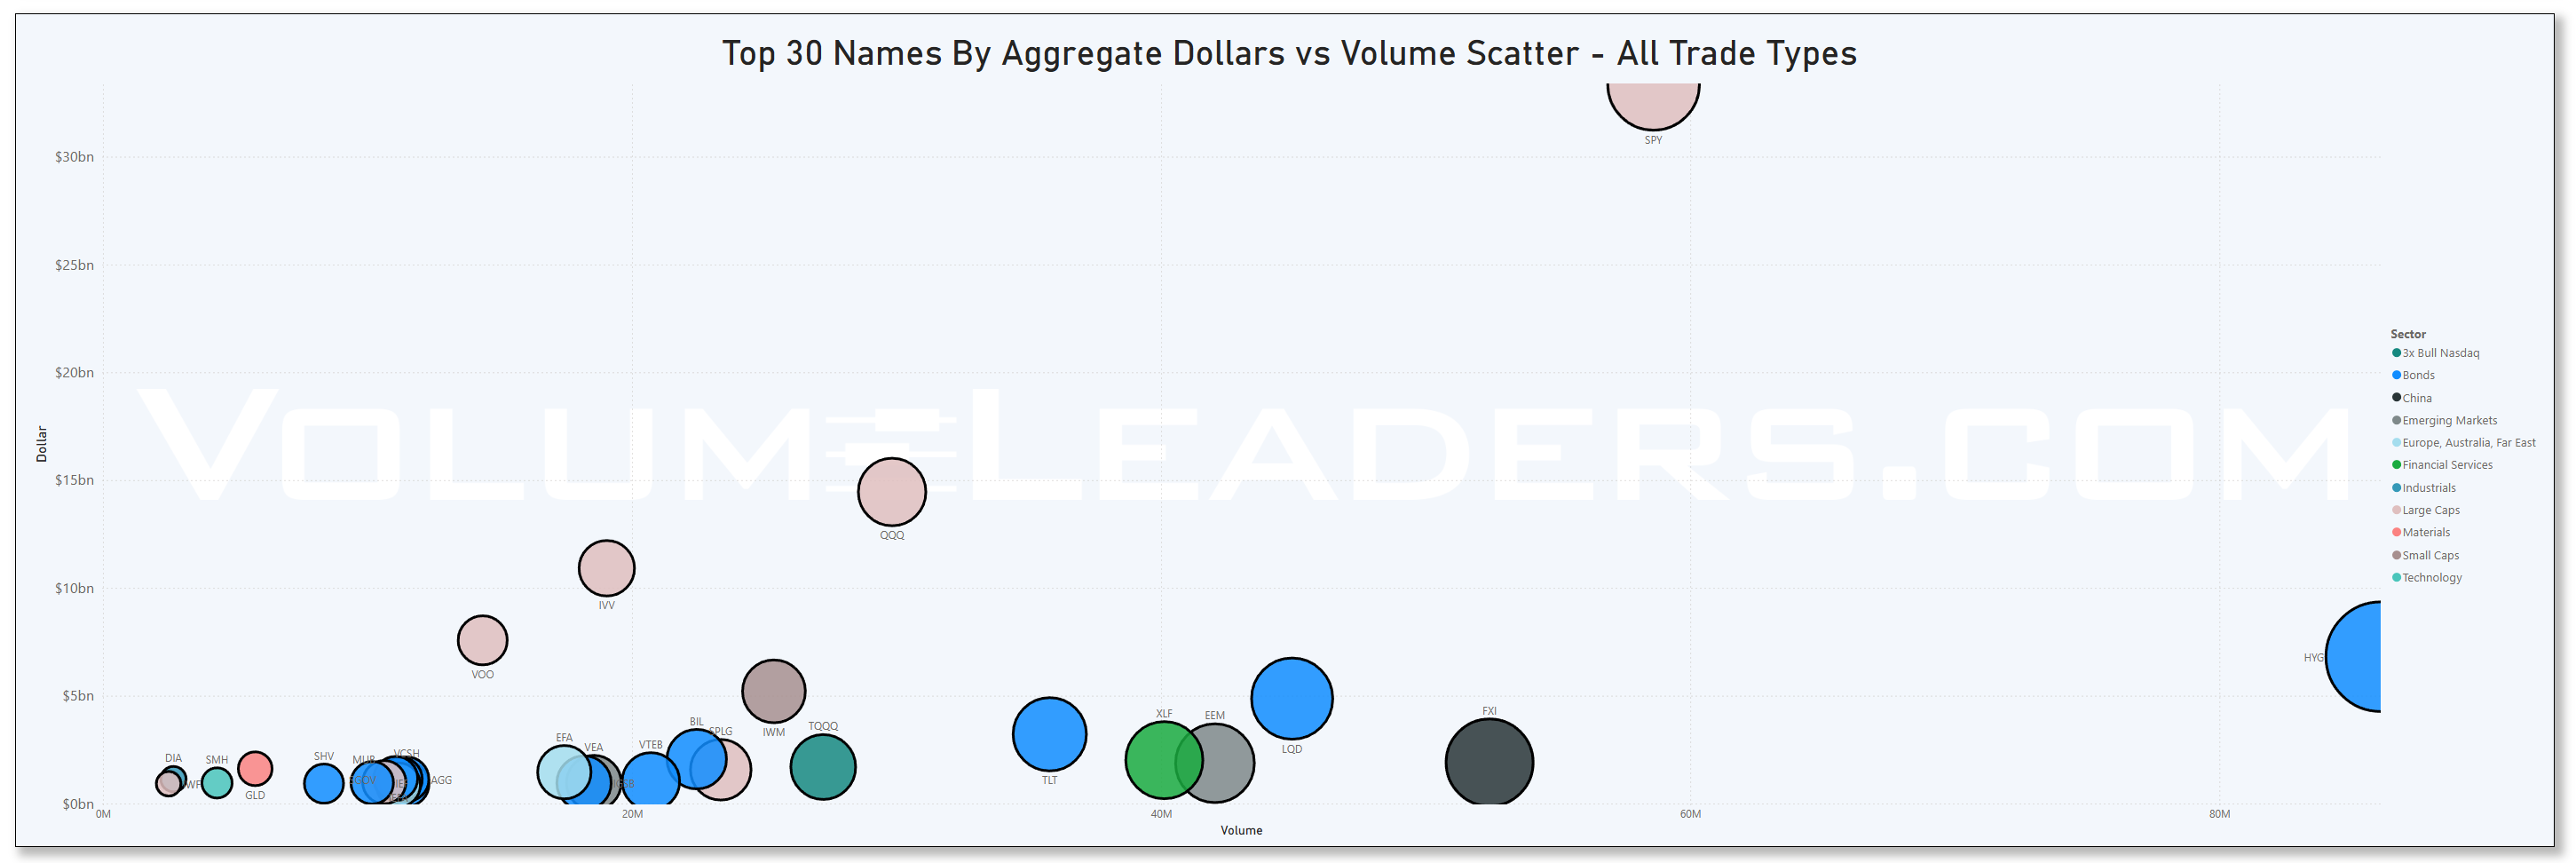
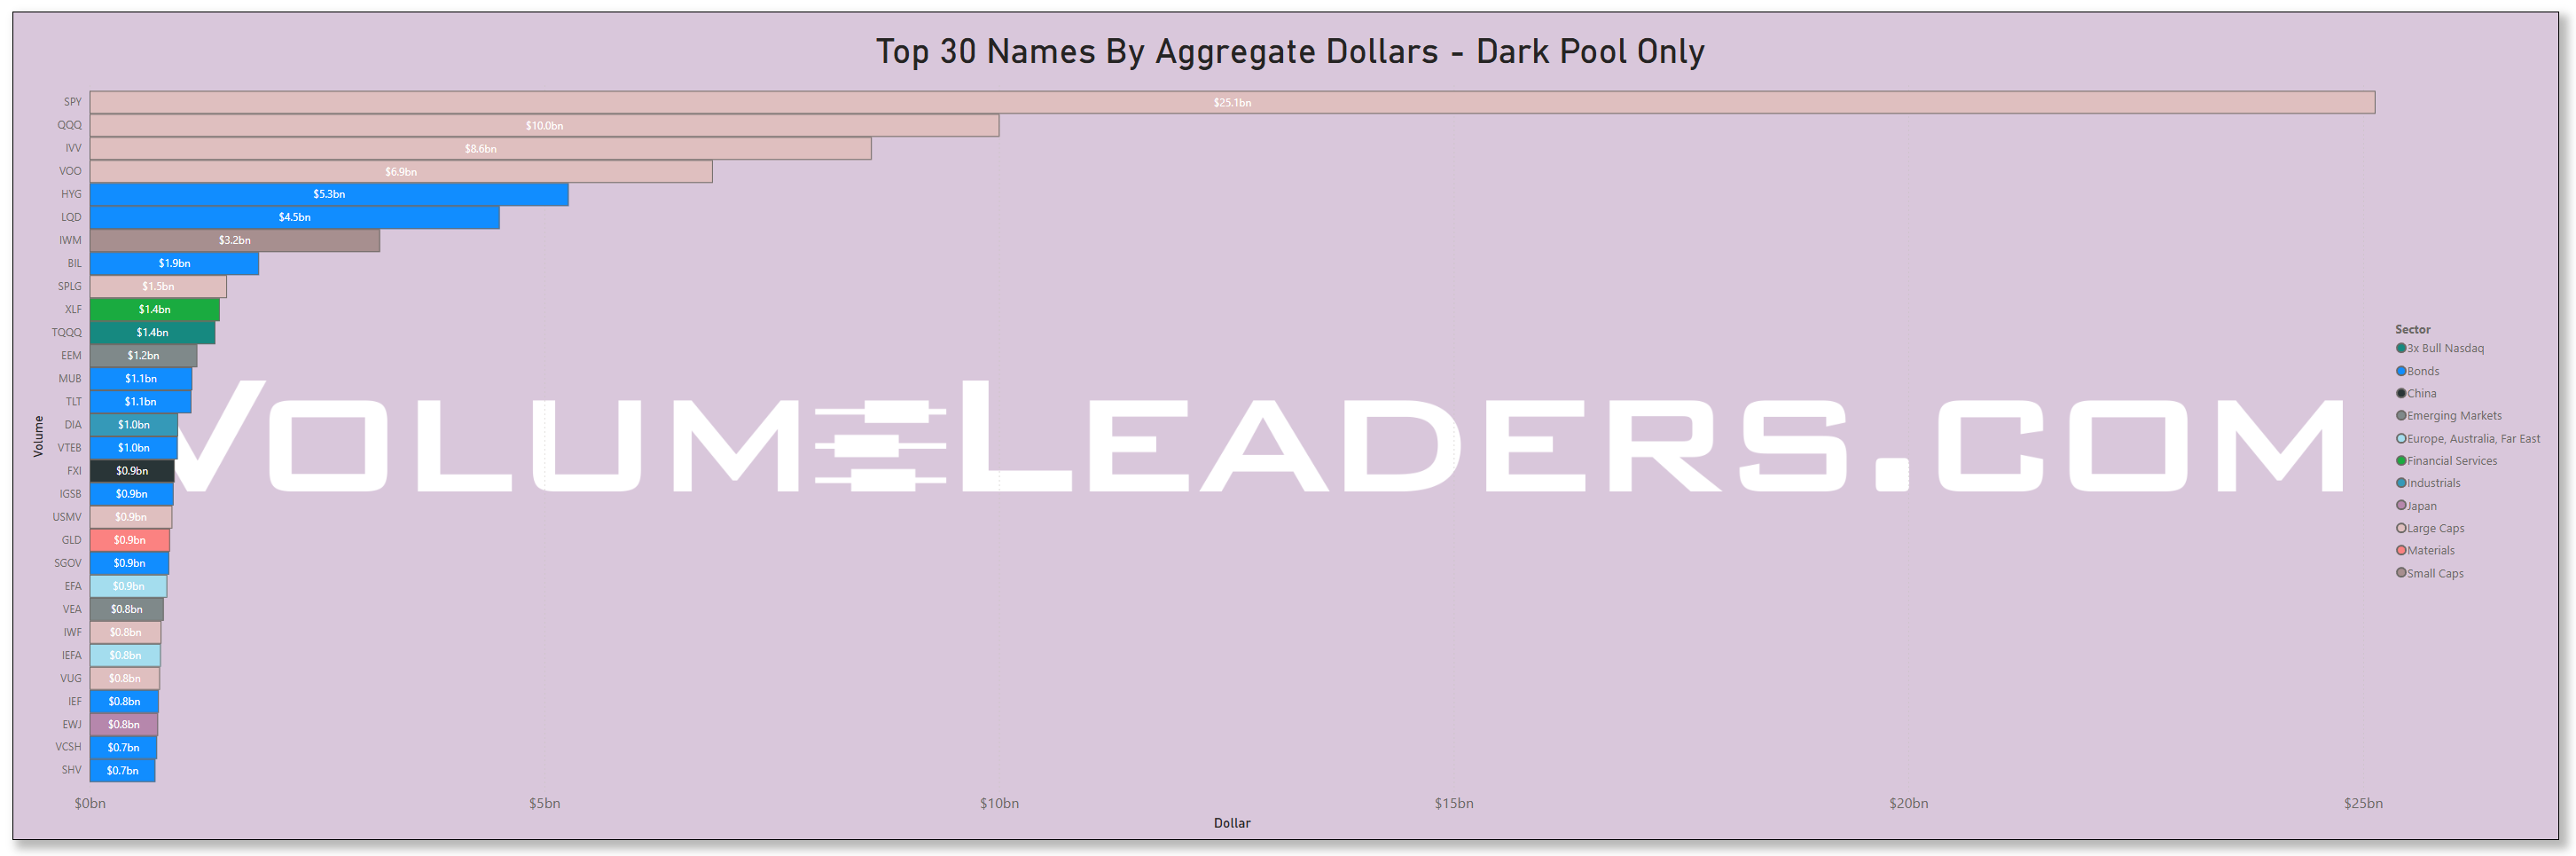
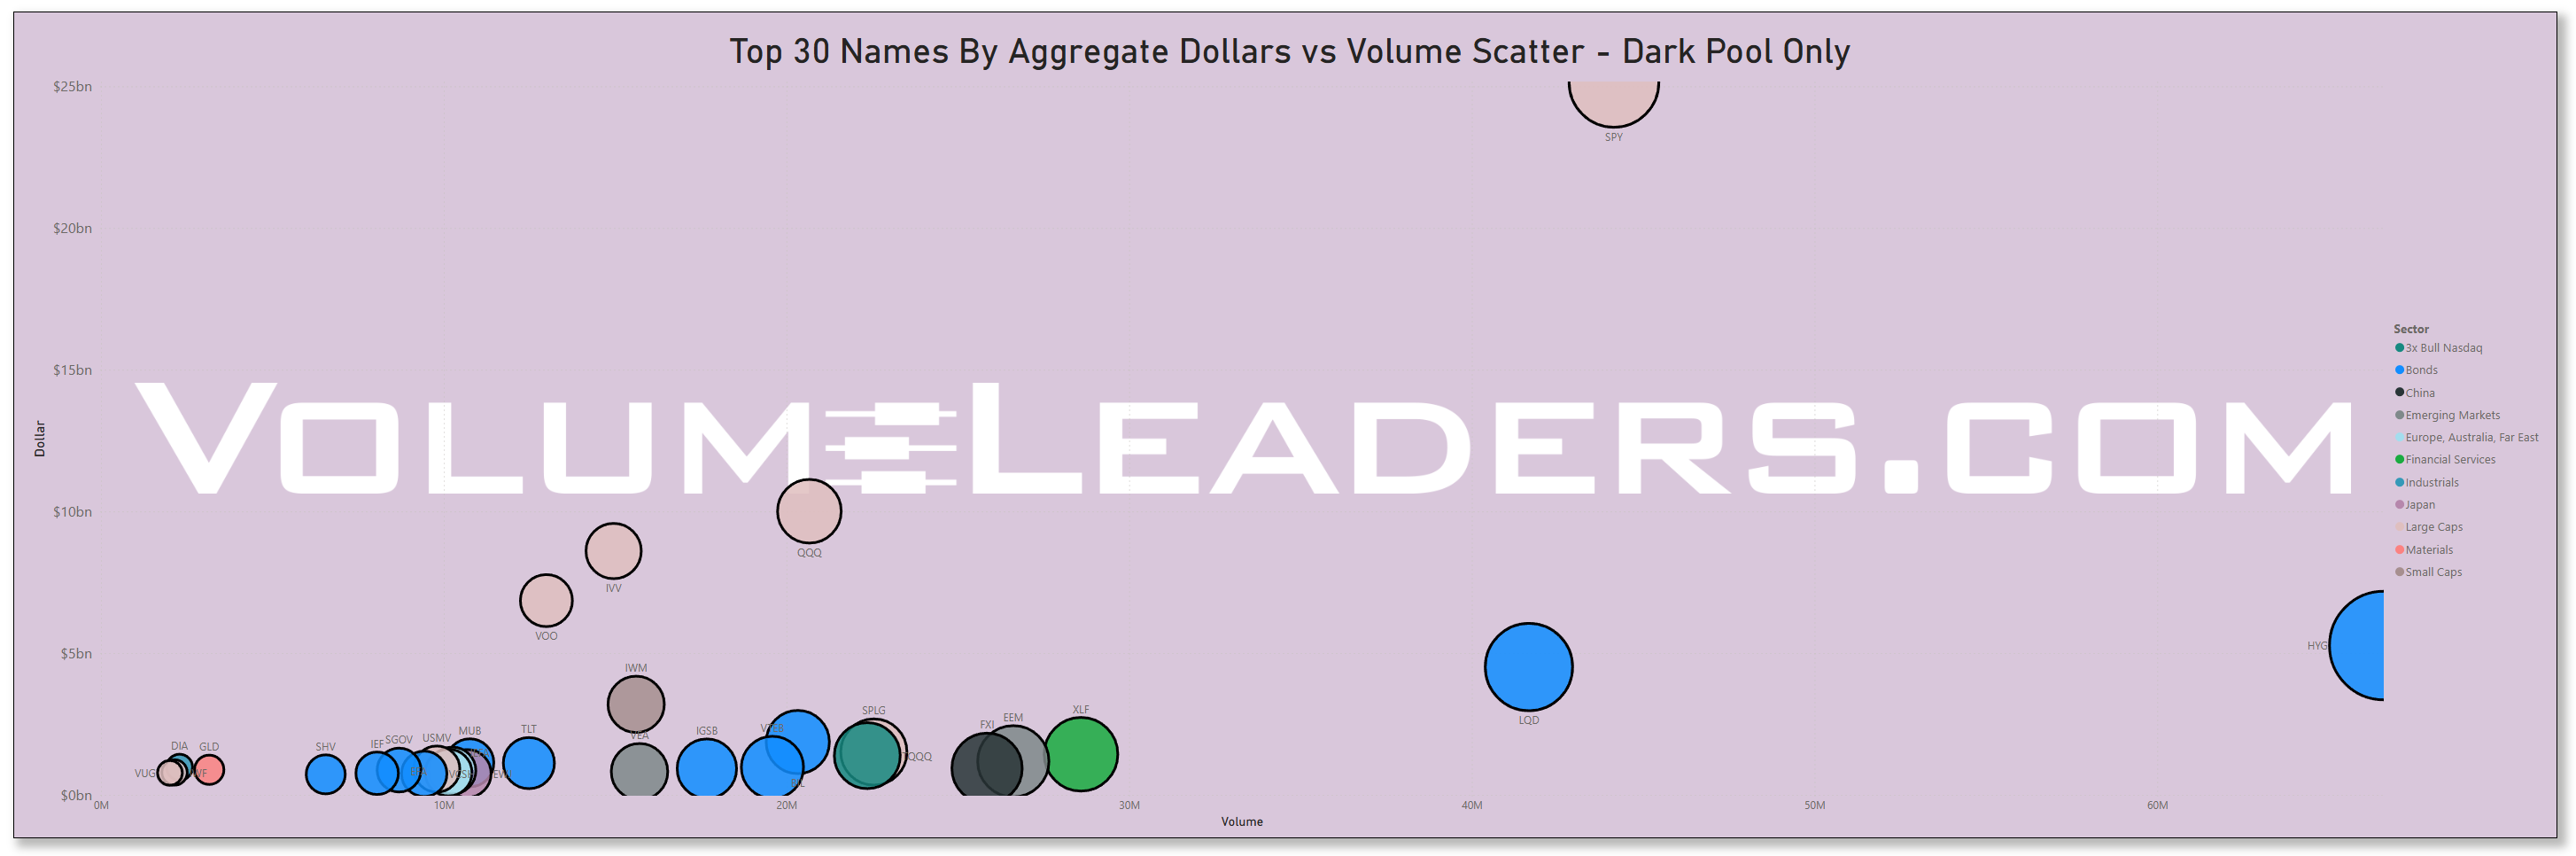
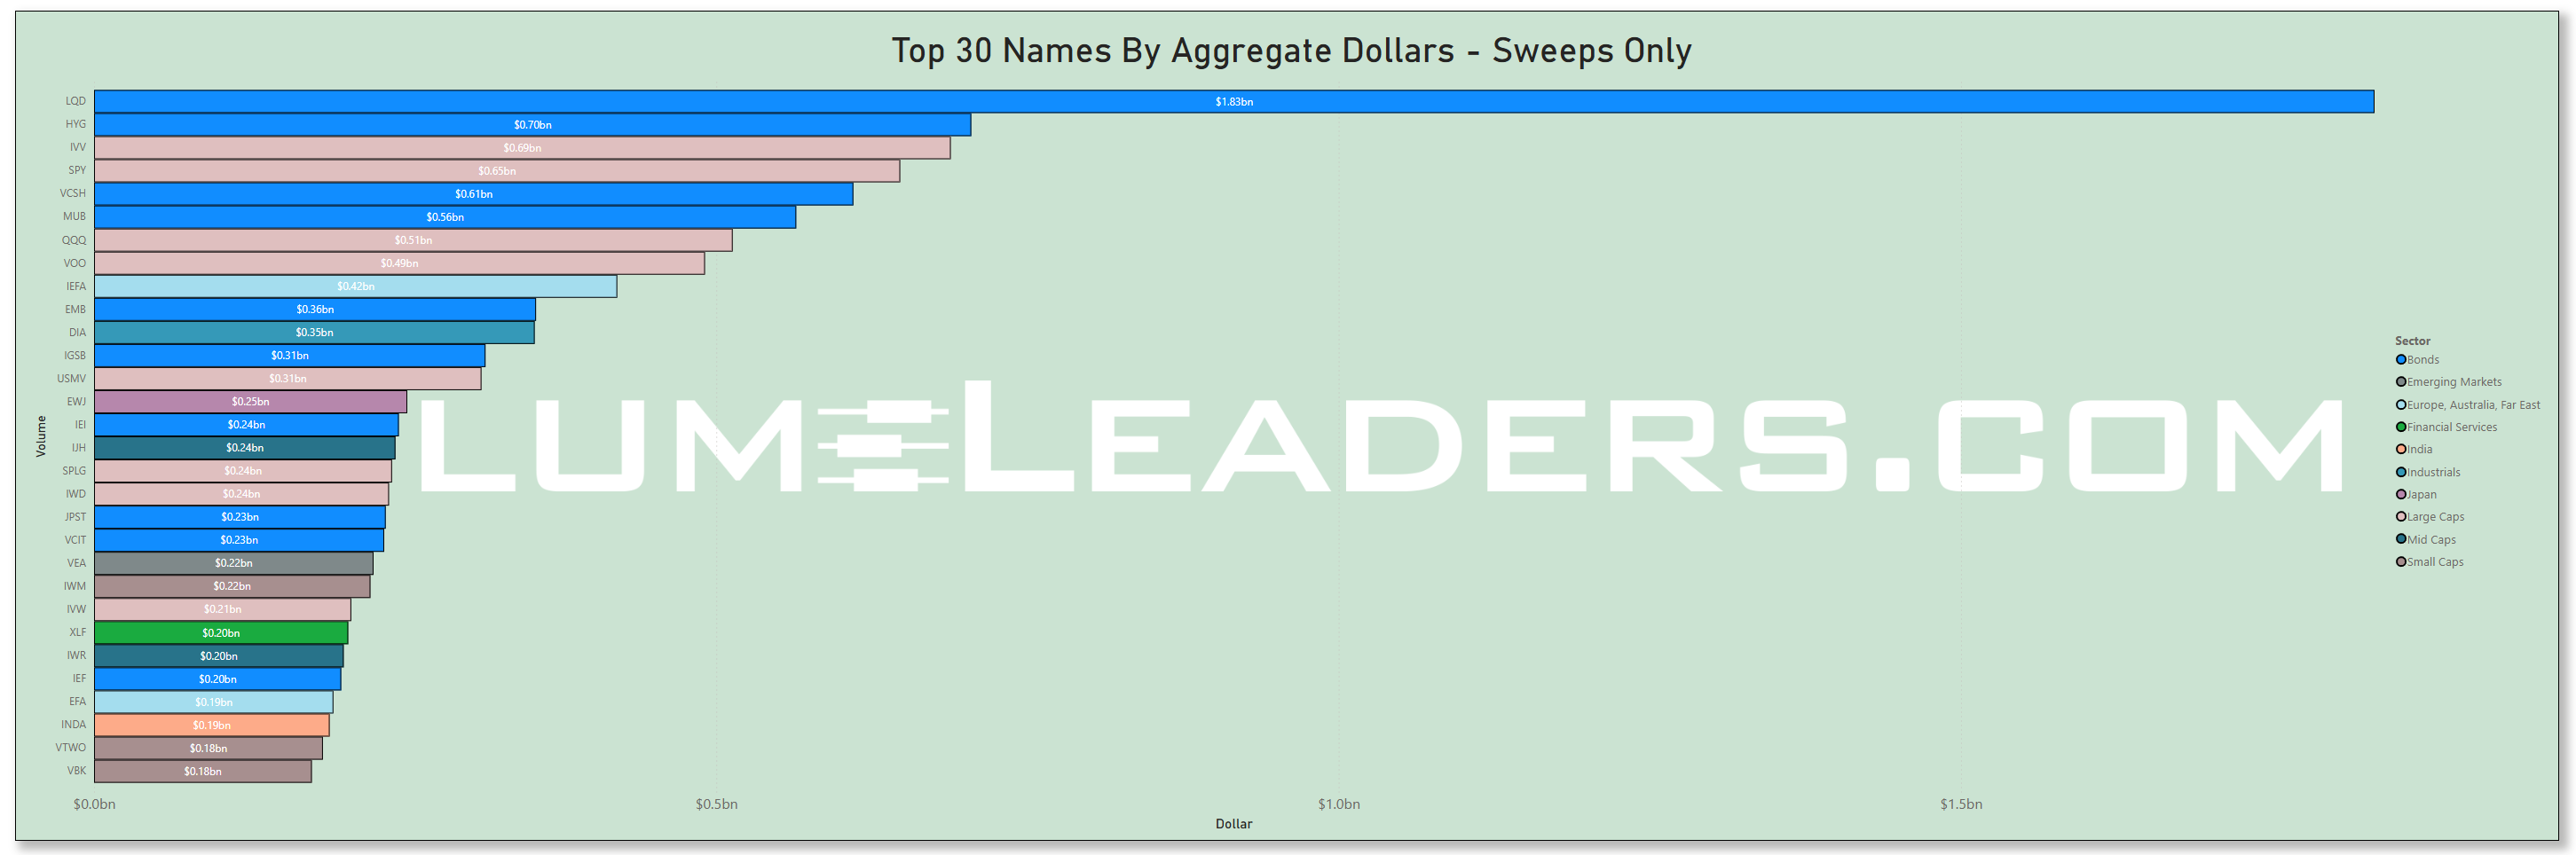
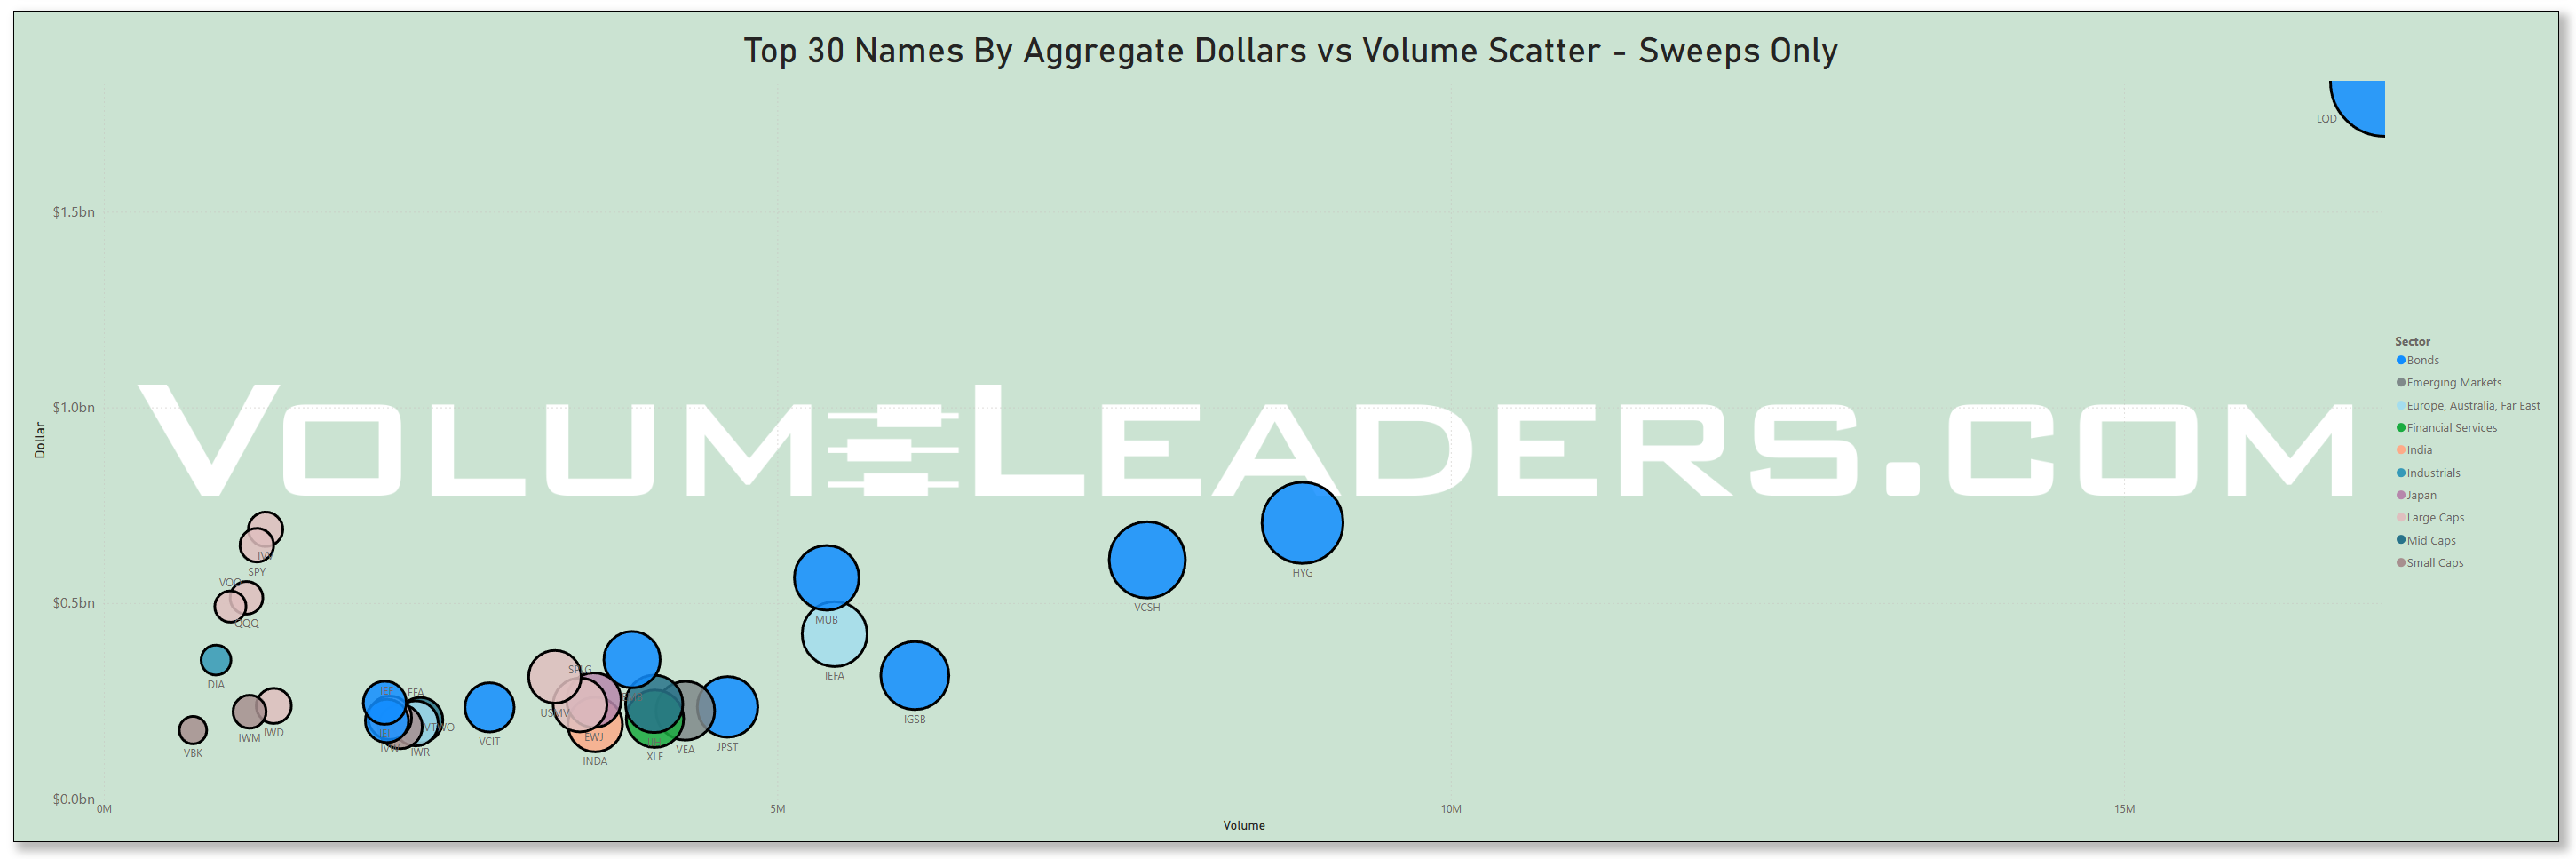
Many excellent trade ideas and sources of inspiration can be found in these prints below. While only the top 30 from each group are displayed, the complete results are accessible in VolumeLeaders.com for you to explore at your convenience any time. Remember to configure trade alerts within the platform to ensure institutional order flows that capture your interest or are significant to you aren't missed. The blue charts encompass all types of trades, including blocks on lit exchanges; the purple charts exclusively depict dark pool trades; and the green charts represent sweeps only.
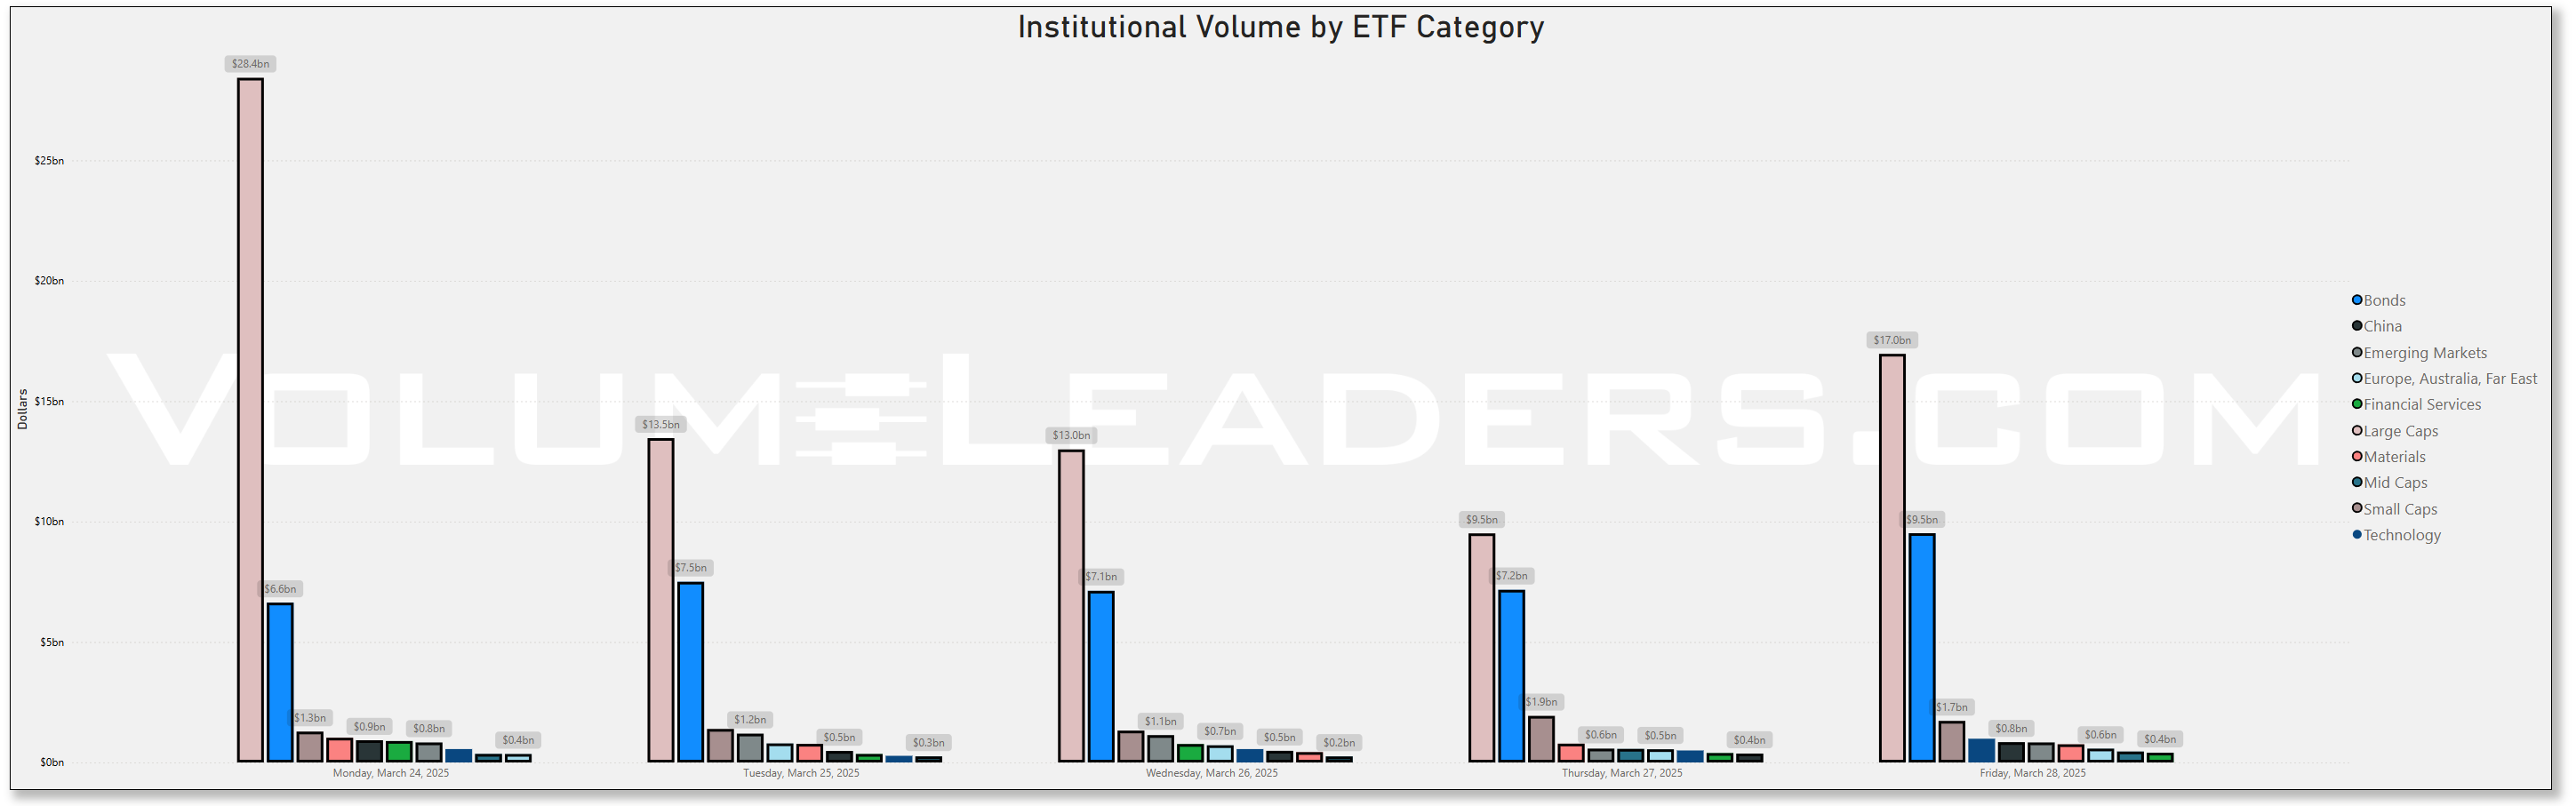
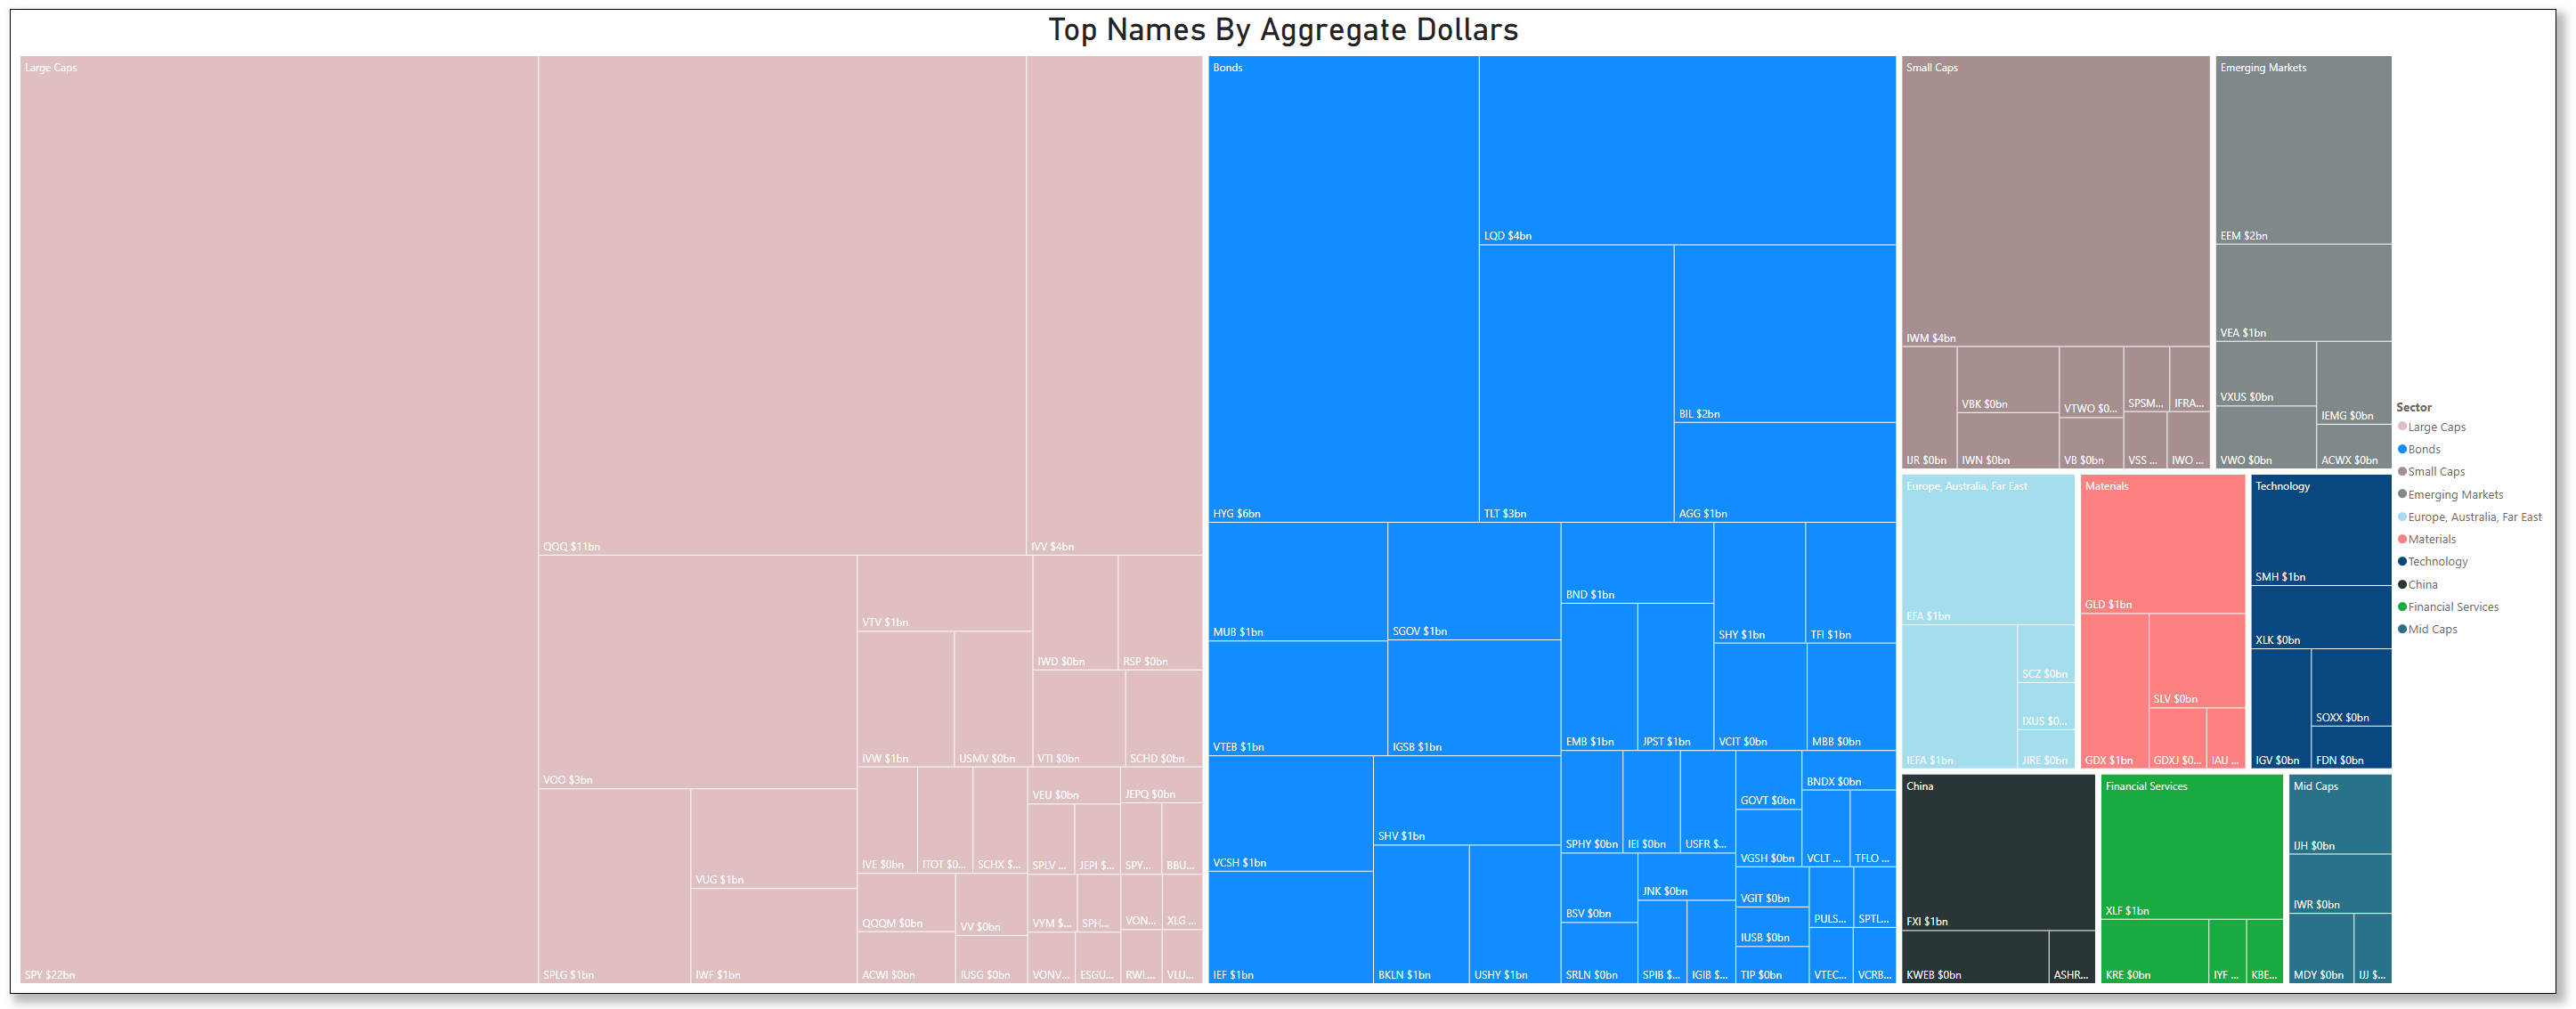
Top Institutional Order Flow In ETFs
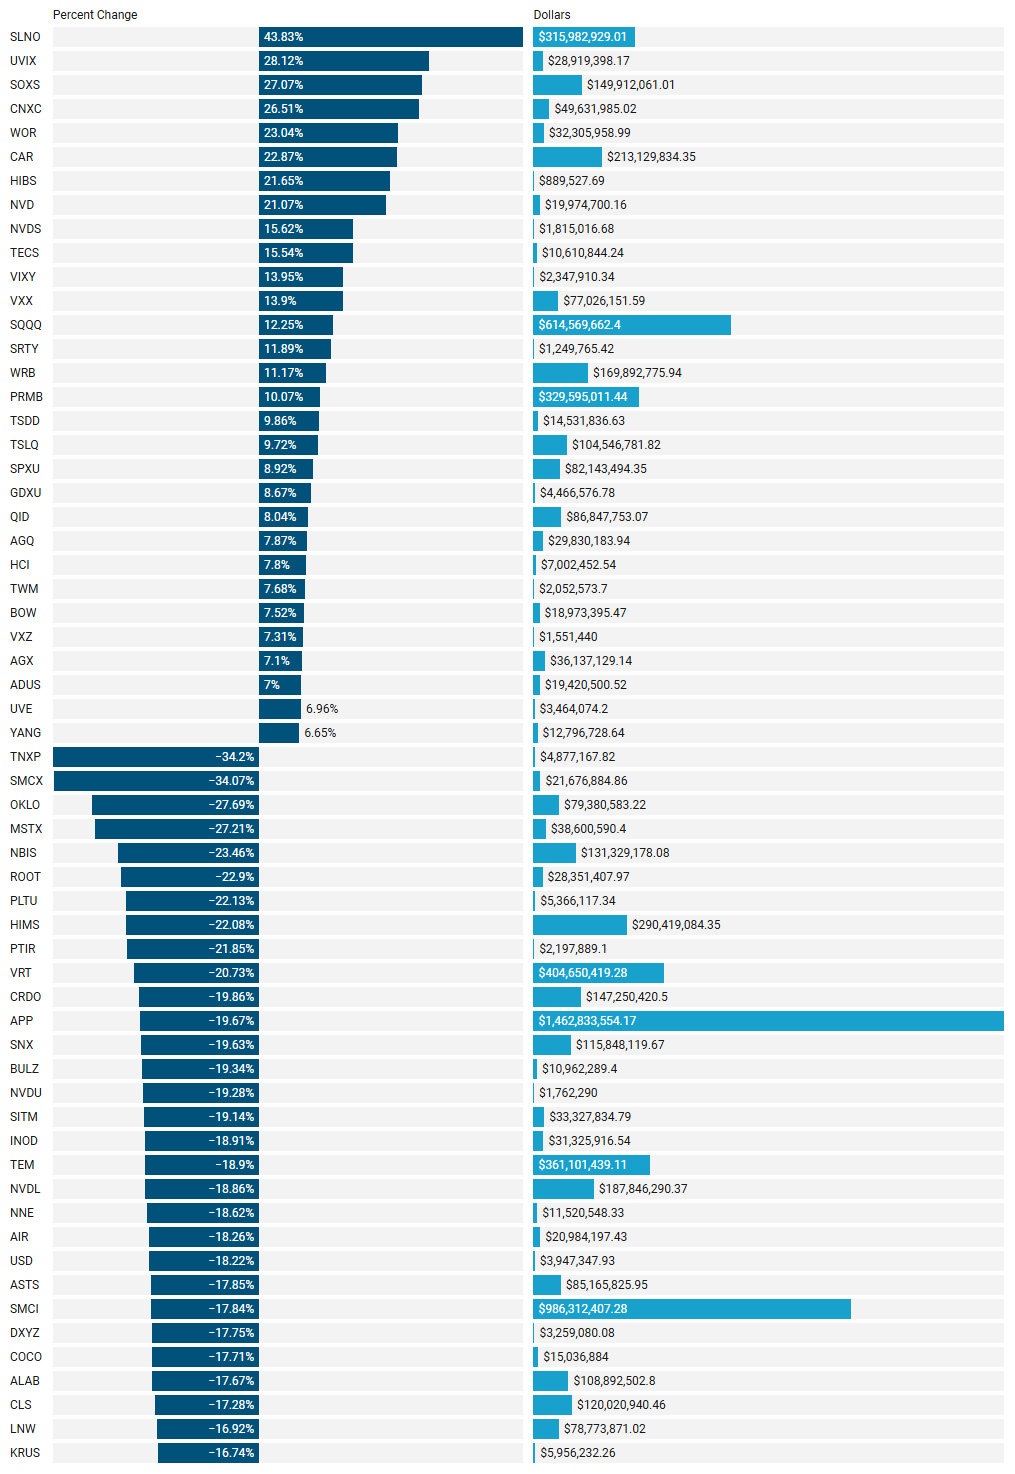
Last Week's Institutionally-Backed Gainers & Losers
If you're going to bet on a name, consider one that is officially endorsed by an institution! These are the top percent gainers (green) and percent losers (red) from this week's open-to-close that had a trade price greater than $20 and institutional involvement. Continue watching tickers from this and prior stacks as these names frequently turn into multi-leg trades with a lot of movement!
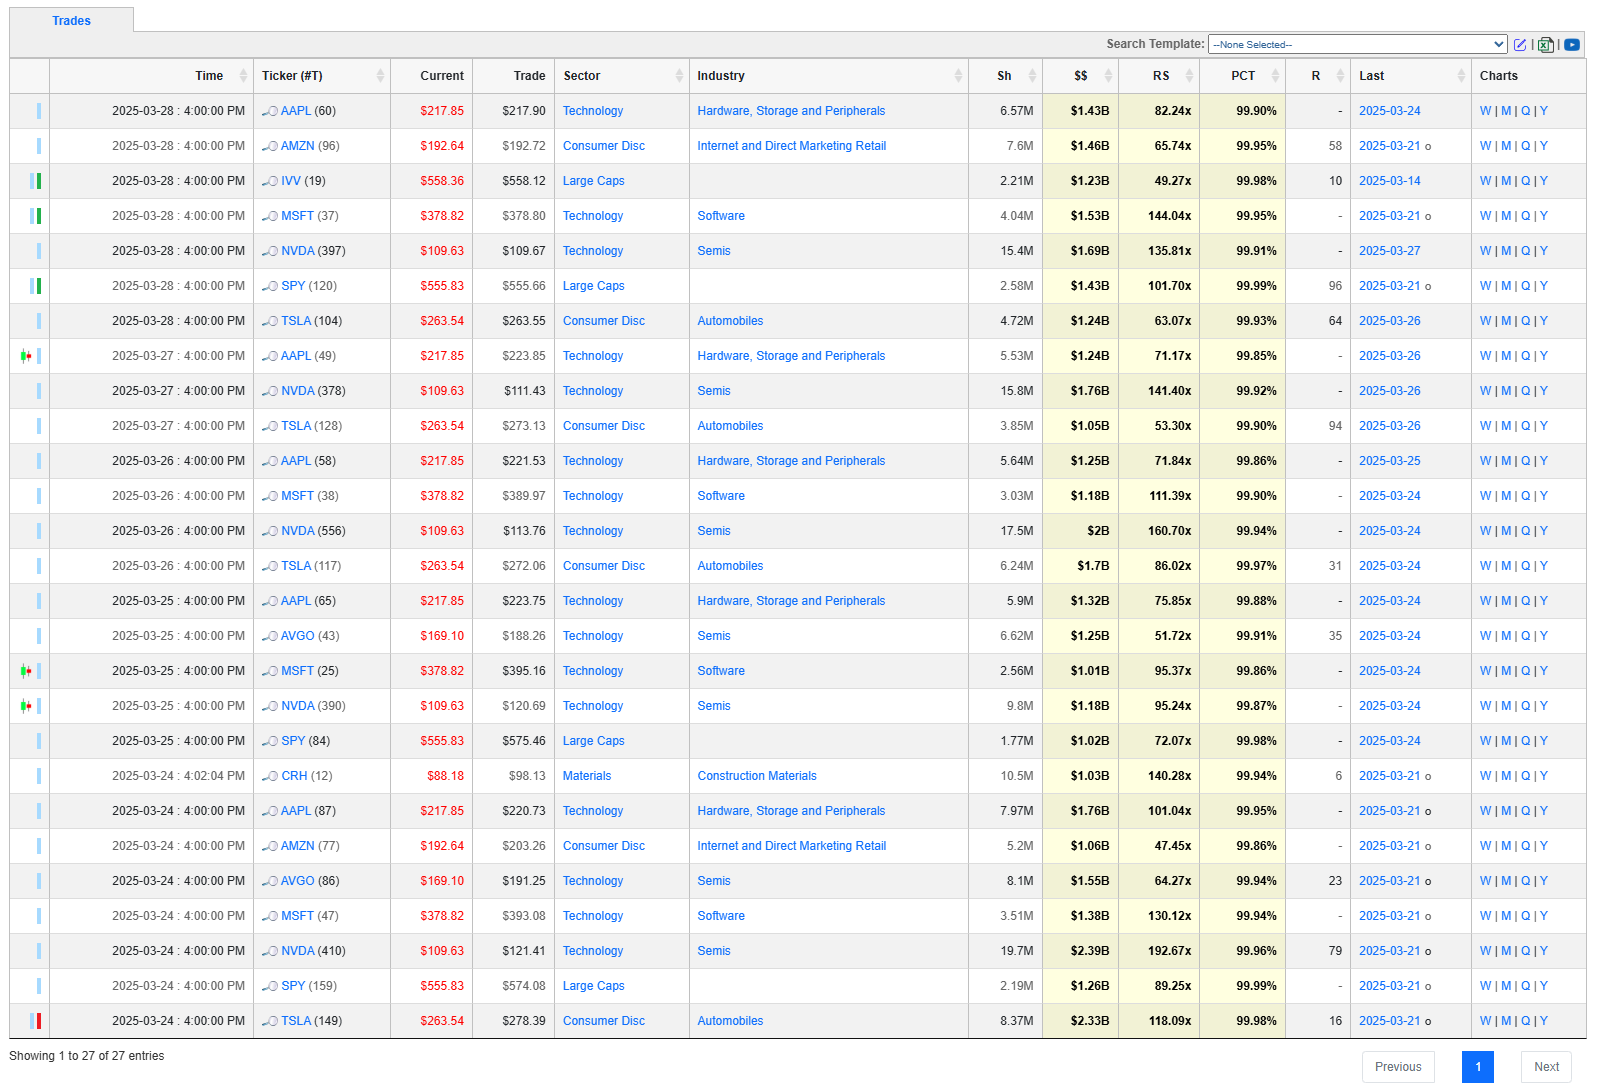
Last Week's Billion-Dollar Prints
Tickers that printed a trade worth at least $1B last week get a special shout-out. These are massive commitments by institutions that should not be ignored.
Statistical Analysis of This Week's Top Ranked Trades
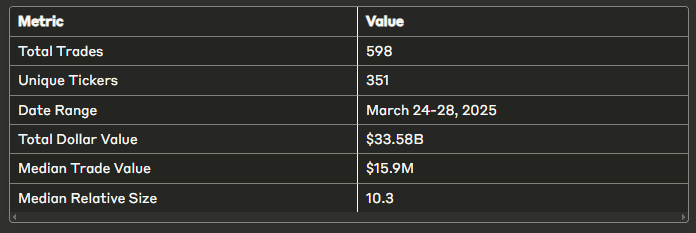
This report provides a detailed analysis of institutional trading activity based on the dataset covering March 24-28, 2025. The dataset contains 598 institutional trades ranked 25 or higher on a per-ticker basis (with 1 being the highest rank), representing significant capital deployment by institutional players.
This week, the analysis reveals concentrated institutional activity in Technology, Healthcare, and Financial Services sectors, with notable positioning in Software Infrastructure companies and Bond ETFs. Several tickers demonstrate consistent high-ranked trading across multiple days, potentially signaling coordinated institutional strategies rather than isolated transactions.
1. Overall Statistical Analysis
1.1 Dataset Overview
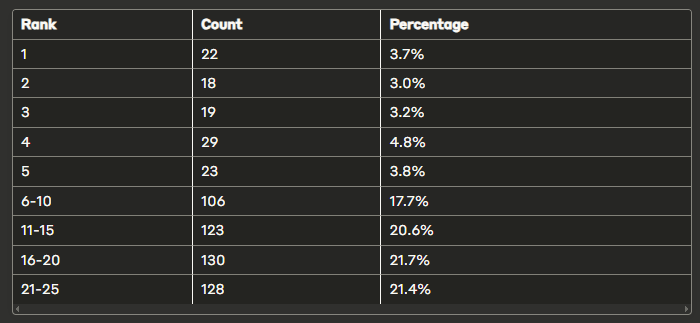
1.2 Trade Distribution by Rank
The distribution of trades by rank shows a relatively even distribution across ranks 1-25, with a slight concentration in ranks 18 and 21:
1.3 Trading Activity by Date
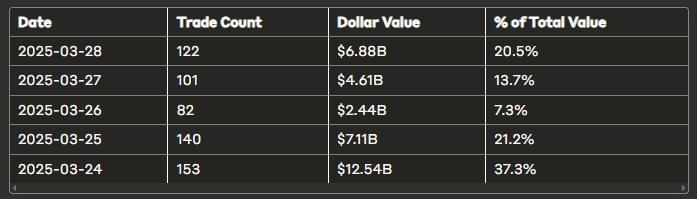
Monday (03-24) saw the highest activity with 37.3% of the week’s total dollar value.
1.4 Trading Activity by Time of Day
Institutional trading shows distinct patterns throughout the trading day:
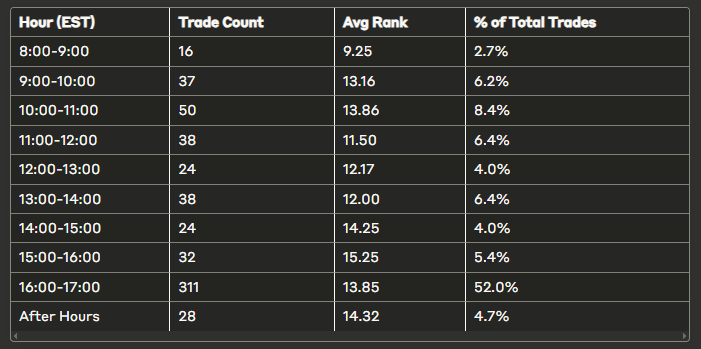
Key Insight: Over half (52%) of all institutional trades occur at market close (4:00-5:00 PM), with the highest-ranked trades concentrated in the pre-market (8:00-9:00 AM) period.
2. Sector Analysis
2.1 Overall Sector Distribution
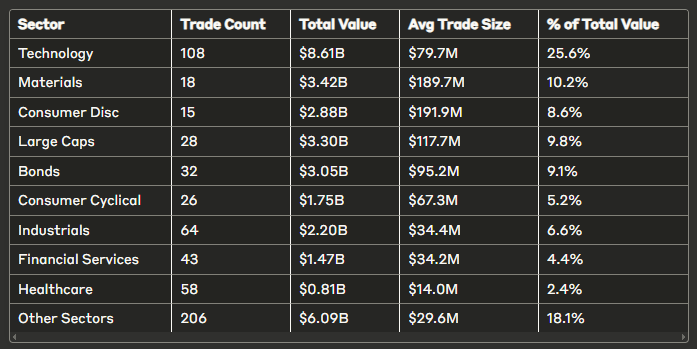
2.2 High-Ranked Trades by Sector (Rank ≤ 5)
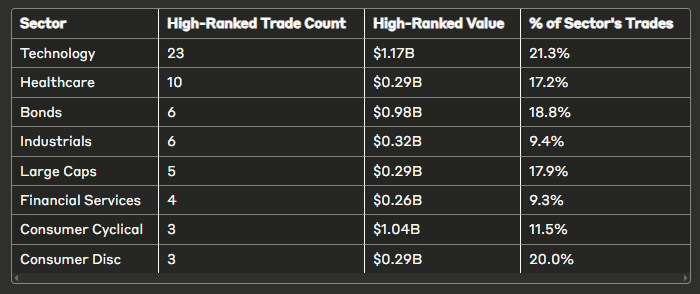
Key Insight: Technology accounts for both the highest number of trades and the highest number of high-conviction (high-ranked) trades, while Consumer Cyclical shows the highest dollar value concentration in top-ranked positions.
2.3 Sector Day-to-Day Trends
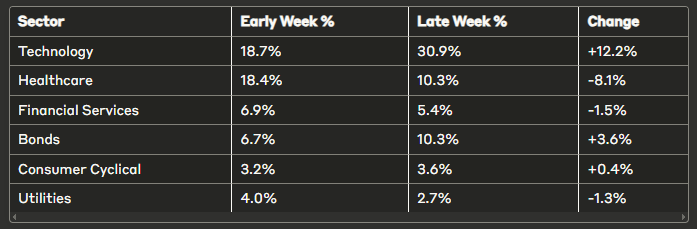
Significant shifts in sector positioning occurred between March 27 and March 28:
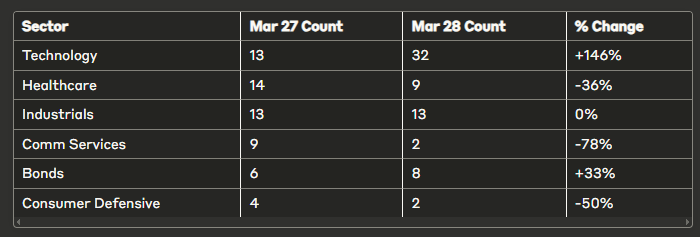
Key Insight: A dramatic change in positioning in Technology occurred on March 28, with institutional trades more than doubling from the previous day, while Communication Services saw a significant decrease.
3. Industry Analysis
3.1 Top Industries by Trade Count
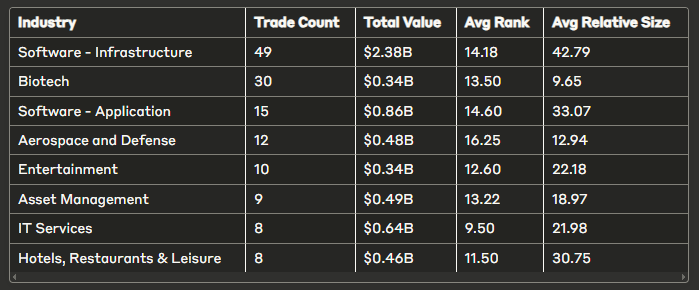
3.2 Industries with Highest Average Relative Size
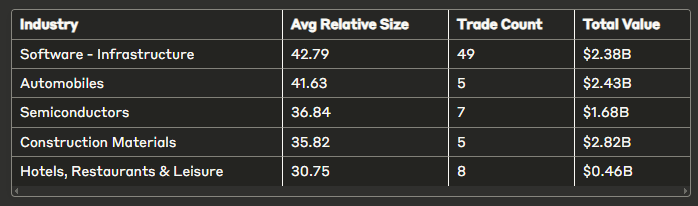
Key Insight: Software Infrastructure companies show the highest concentration of both trade count and relative size metrics, indicating particularly strong institutional conviction in this industry.
4. Ticker-Level Analysis
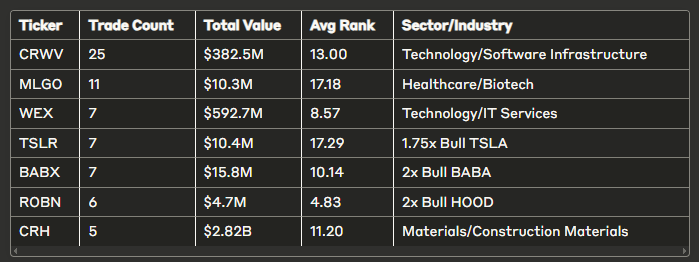
4.1 Most Actively Traded Tickers
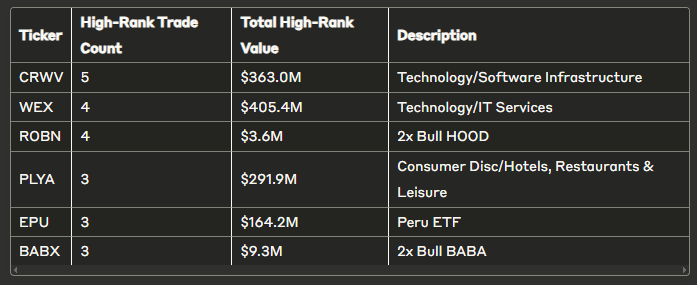
4.2 Tickers with Multiple High-Ranked Trades (Rank ≤ 5)
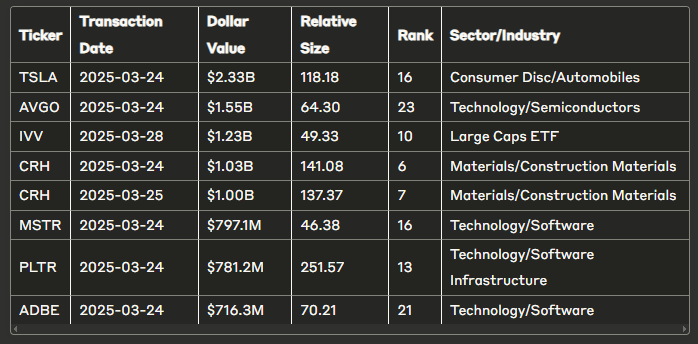
4.3 Largest Individual Positions by Dollar Value
4.4 Tickers with Highest Relative Size
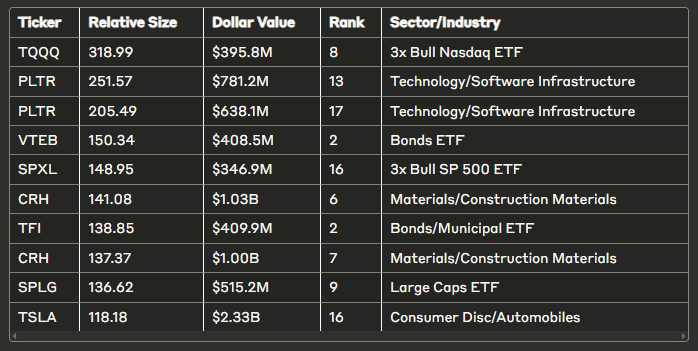
Key Insight: Leveraged ETFs (TQQQ, SPXL) and Technology stocks (PLTR) show exceptionally high relative size metrics, indicating significant institutional conviction or potentially tactical positioning.
4.5 Multi-Day Pattern Analysis
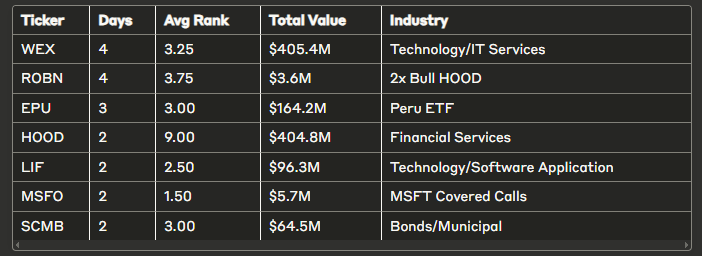
The following tickers showed consistent high-ranked (≤10) trading across multiple days, potentially indicating strategic position building:
5. Detailed Pattern Analysis
5.1 Sector Rotation Analysis
Comparing the first part of the week (Mon-Wed) with the latter part (Thu-Fri) reveals potential sector rotation:
6. Key Insights and Conclusions
6.1 Most Significant Patterns
- Technology Sector Dominance: Technology-related trades account for 25.6% of dollar value and 21.3% of high-ranked trades, with significant concentration in Software Infrastructure companies.
- Late-Week Rotation: A significant pivot involving Technology occurred on March 28th, with institutional trades more than doubling compared to the previous day.
- Leveraged ETF Positioning: Extremely high relative size metrics in leveraged ETFs (TQQQ, SPXL) suggest tactical institutional positioning ahead of anticipated market moves.
- Strategic Bond Positioning: Substantial high-ranked trades in Bond ETFs (VTEB, TFI) with large relative size metrics indicate potential hedging or defensive positioning alongside Technology exposure.
6.2 Notable Ticker Highlights
- CRWV: 25 separate transactions across various price points with 5 top-ranked trades suggests coordinated institutional accumulation strategy.
- WEX: Consistent high-ranked (≤5) trading across 4 consecutive days indicates strategic position building rather than opportunistic trading.
- CRH: Multiple billion-dollar positions with extremely high relative size metrics (>135x) suggest exceptional institutional conviction.
- PLTR: Positions with relative size exceeding 250 indicate potentially outsized conviction or anticipation of catalyst events.
- TQQQ: Extremely high relative size (318.99x) in this 3x leveraged ETF suggests tactical positioning ahead of anticipated market movement.
Investments In Focus: Bull vs Bear Arguments
Institutions leave footprints that VolumeLeaders.com can illustrate for you while providing context to assess things like institutional conviction and urgency. Theses and data given below are not financial advice, just personal observations that may be wrong; consult a certified financial advisor before making any investment decisions.
AIG 0.00%↑
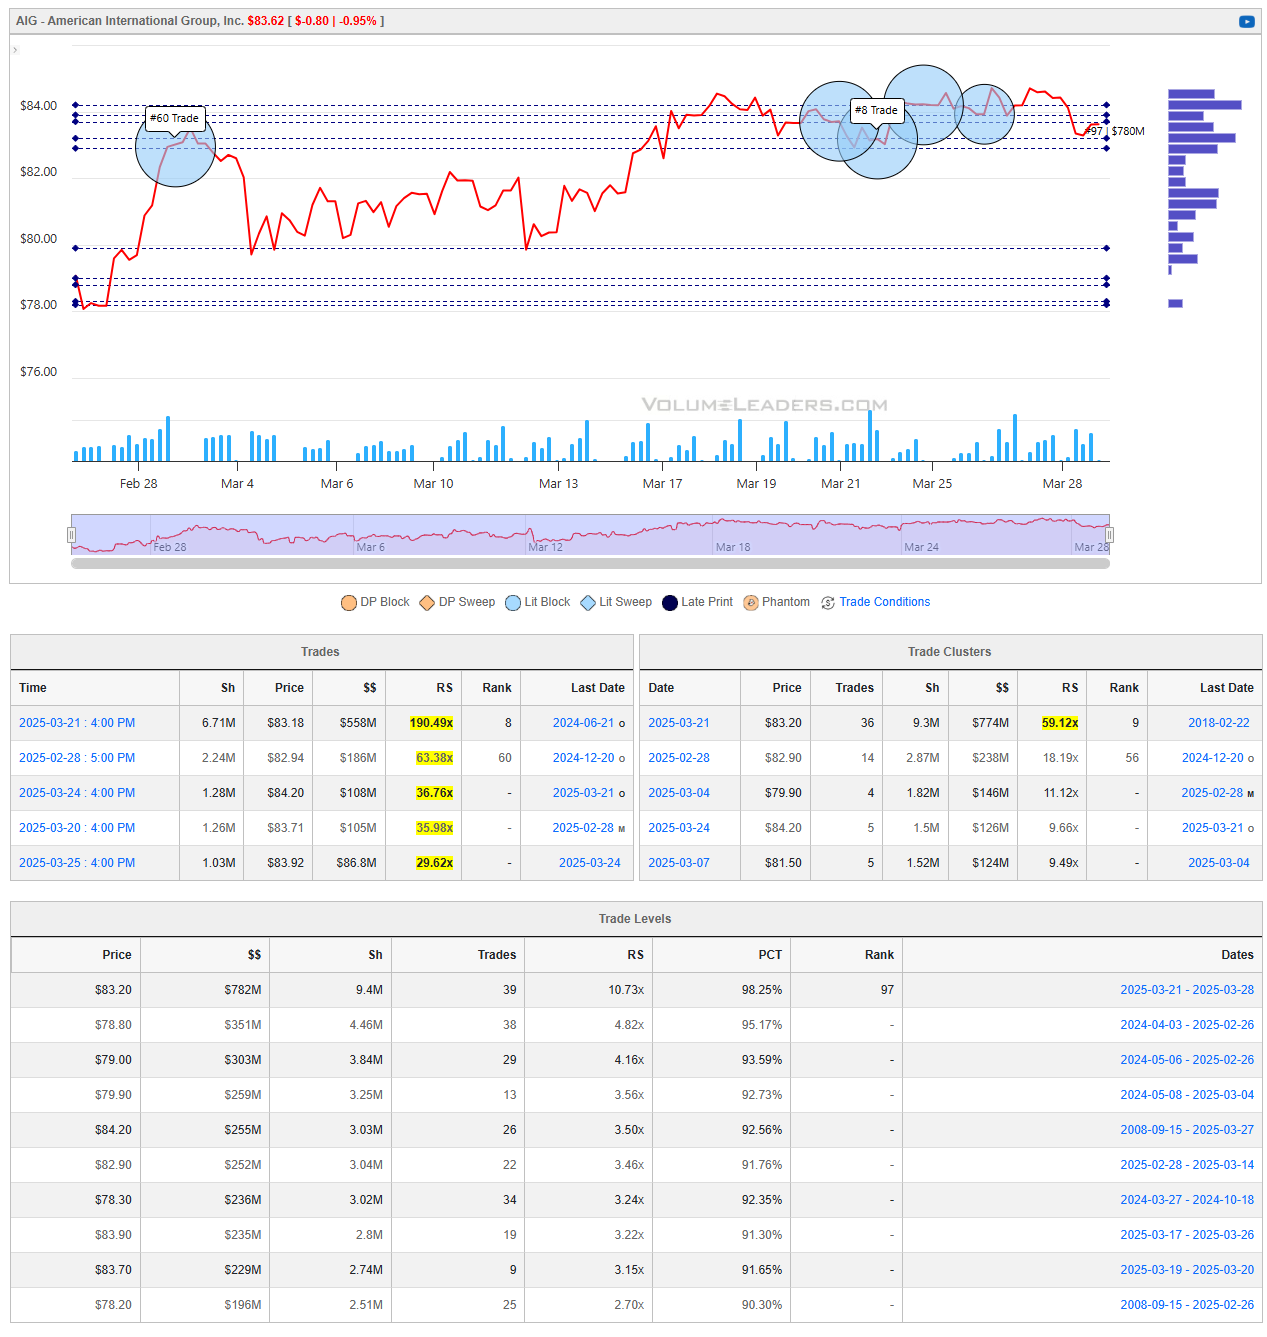
American International Group, Inc. (NYSE:AIG) is a global insurance company offering a wide range of property-casualty insurance, life insurance, retirement solutions, and other financial services to clients in over 200 countries and jurisdictions.
Recent Developments:
- Financial Performance:
- Fourth Quarter and Full Year 2024 Results: In February 2025, AIG reported outstanding financial results for the fourth quarter and full year ending December 31, 2024. The company highlighted significant accomplishments, including strengthening its capital structure and improving financial performance.
- Analyst Ratings:
- Keefe Analysts’ Outlook: On March 27, 2025, analysts at Keefe reiterated an “outperform” rating for AIG’s stock, setting a target price of $90.
- Stock Performance:
- Market Activity: As of March 29, 2025, AIG’s stock is trading at $83.62, reflecting recent market dynamics and investor sentiment.
Bullish Perspective:
- Strong Financial Results: AIG’s robust performance in 2024, marked by improved capital structure and financial metrics, demonstrates the company’s resilience and effective management strategies.
- Positive Analyst Outlook: The reaffirmation of an “outperform” rating with a $90 target price by Keefe analysts suggests confidence in AIG’s growth prospects and market position.
- Market Position: As a leading global insurer, AIG’s diversified portfolio across various insurance and financial services sectors positions it well to capitalize on emerging market opportunities.
Bearish Perspective:
- Exposure to Catastrophic Events: AIG, like other insurers, faces potential losses from natural disasters. For instance, in February 2025, major insurers, including AIG, anticipated significant claims due to wildfires in Los Angeles, with combined losses estimated around $3.7 billion.
- Market Volatility: The insurance industry is susceptible to market fluctuations and economic downturns, which can impact investment returns and underwriting profitability.
- Regulatory Challenges: As a global entity, AIG must navigate complex regulatory environments across different jurisdictions, which can pose operational and compliance challenges.
In summary, AIG’s strong financial performance and positive analyst ratings underscore its solid market position. However, potential risks from catastrophic events, market volatility, and regulatory complexities warrant careful consideration by investors.
EBAY 0.00%↑
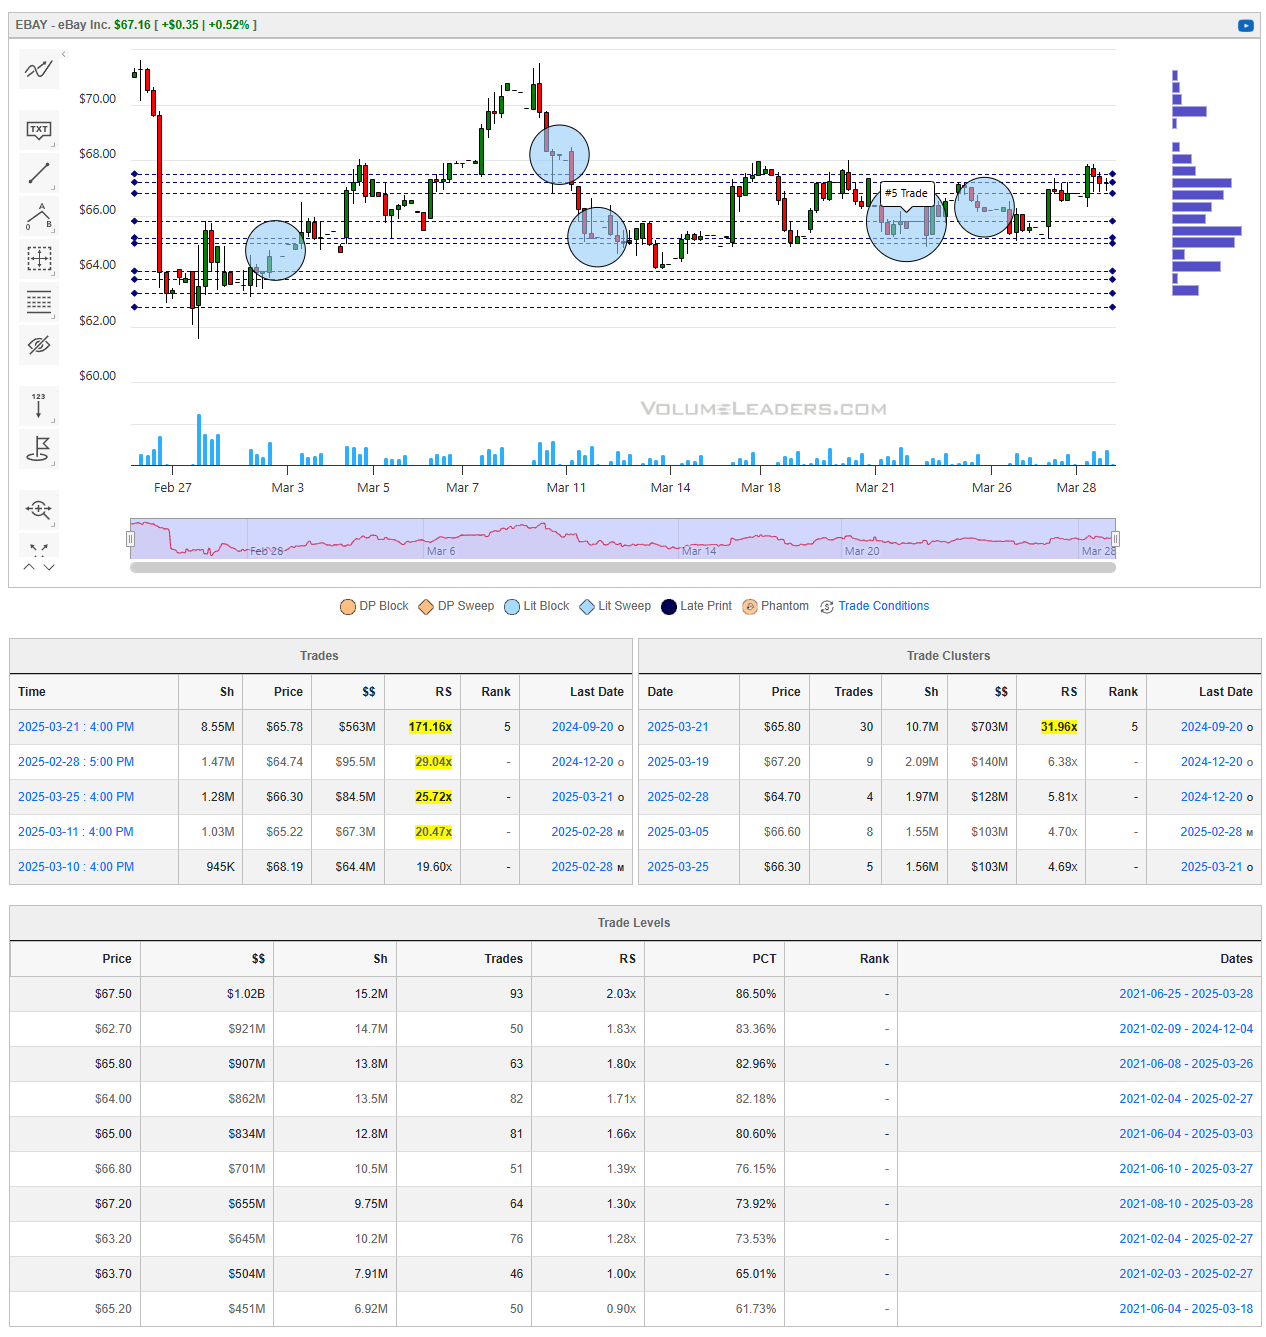
eBay Inc. (NASDAQ:EBAY) is a global e-commerce corporation that facilitates consumer-to-consumer and business-to-consumer sales through its online platform.
Recent Developments:
- Financial Performance:
- Q4 2024 Results: eBay reported revenue of $2.6 billion, marking a 1% increase both on an as-reported and foreign exchange (FX)-neutral basis. Adjusted earnings per share (EPS) were $1.25, surpassing analysts’ expectations.
- Future Outlook:
- Q1 2025 Guidance: eBay forecasts revenue between $2.52 billion and $2.56 billion, slightly below analysts’ expectations of $2.59 billion. Gross merchandise volume (GMV) is projected to range from $18.3 billion to $18.6 billion, also under the anticipated $18.8 billion.
- Strategic Initiatives:
- Partnership with Meta Platforms: eBay has collaborated with Meta to display certain listings on Facebook Marketplace, aiming to expand seller reach and audience engagement.
Bullish Perspective:
- Resilient Financial Performance: eBay’s ability to achieve revenue growth and exceed EPS expectations demonstrates operational strength and effective cost management.
- Strategic Partnerships: Collaborations, such as the integration with Facebook Marketplace, enhance eBay’s visibility and could drive increased sales through expanded audience reach.
- Analyst Confidence: The consensus among analysts is a “Buy” rating, with an average 12-month price target of $65.17, indicating optimism about eBay’s market position and future performance.
Bearish Perspective:
- Soft Revenue and GMV Outlook: The company’s Q1 2025 guidance falls short of analyst expectations, suggesting potential challenges in maintaining growth momentum amid economic uncertainties.
- Competitive Pressures: Intense competition from major players like Amazon and Alibaba may impact eBay’s market share and profitability.
- Market Sensitivity: eBay’s performance is susceptible to broader economic conditions, including consumer spending patterns influenced by inflation and interest rates.
In summary, eBay Inc. exhibits a blend of strategic initiatives and financial resilience, positioning it for potential growth. However, cautious guidance and competitive dynamics warrant careful consideration by investors evaluating the company’s future prospects.
TXRH 0.00%↑
Texas Roadhouse, Inc. (NASDAQ:TXRH) is a casual dining restaurant chain known for its hand-cut steaks, ribs, and Southwestern-inspired cuisine. The company operates and franchises restaurants under the Texas Roadhouse, Bubba’s 33, and Jaggers brands across the United States and internationally.
Recent Developments:
- Financial Performance:
- Fiscal Year 2024 Results: Texas Roadhouse reported revenue of $5.37 billion, a 16.01% increase compared to the previous year. Earnings reached $433.59 million, marking a 42.22% rise.
- Analyst Ratings:
- Price Targets: As of March 28, 2025, 24 analysts have an average 12-month price target of $192.13 for TXRH, indicating a potential upside of approximately 12.32% from the current stock price. The consensus rating is “Buy.”
- Dividend Information:
- Dividend Growth: Texas Roadhouse has been growing its dividend for 2 years, with a 5-year compound annual growth rate (CAGR) of 14.78%. The most recent quarterly dividend was $0.68 per share, with an ex-dividend date of March 18, 2025.
Bullish Perspective:
- Strong Financial Growth: The company’s significant revenue and earnings increases demonstrate robust operational performance and effective management strategies.
- Positive Analyst Outlook: The consensus “Buy” rating and favorable price targets suggest confidence in the company’s future growth prospects.
- Dividend Growth: Consistent dividend increases reflect financial health and a commitment to returning value to shareholders.
Bearish Perspective:
- Market Volatility: The stock has experienced fluctuations, with a 52-week range between $146.75 and $206.04, indicating potential volatility.
- Insider Selling: Recent reports indicate significant insider selling over the past three months, which may raise concerns about internal perspectives on the company’s valuation.
- Competitive Industry: The casual dining sector is highly competitive, and maintaining market share requires continuous innovation and customer engagement.
In summary, Texas Roadhouse exhibits strong financial performance and positive analyst sentiment, supported by consistent dividend growth. However, potential investors should consider market volatility, insider selling activities, and the competitive landscape when evaluating the stock.
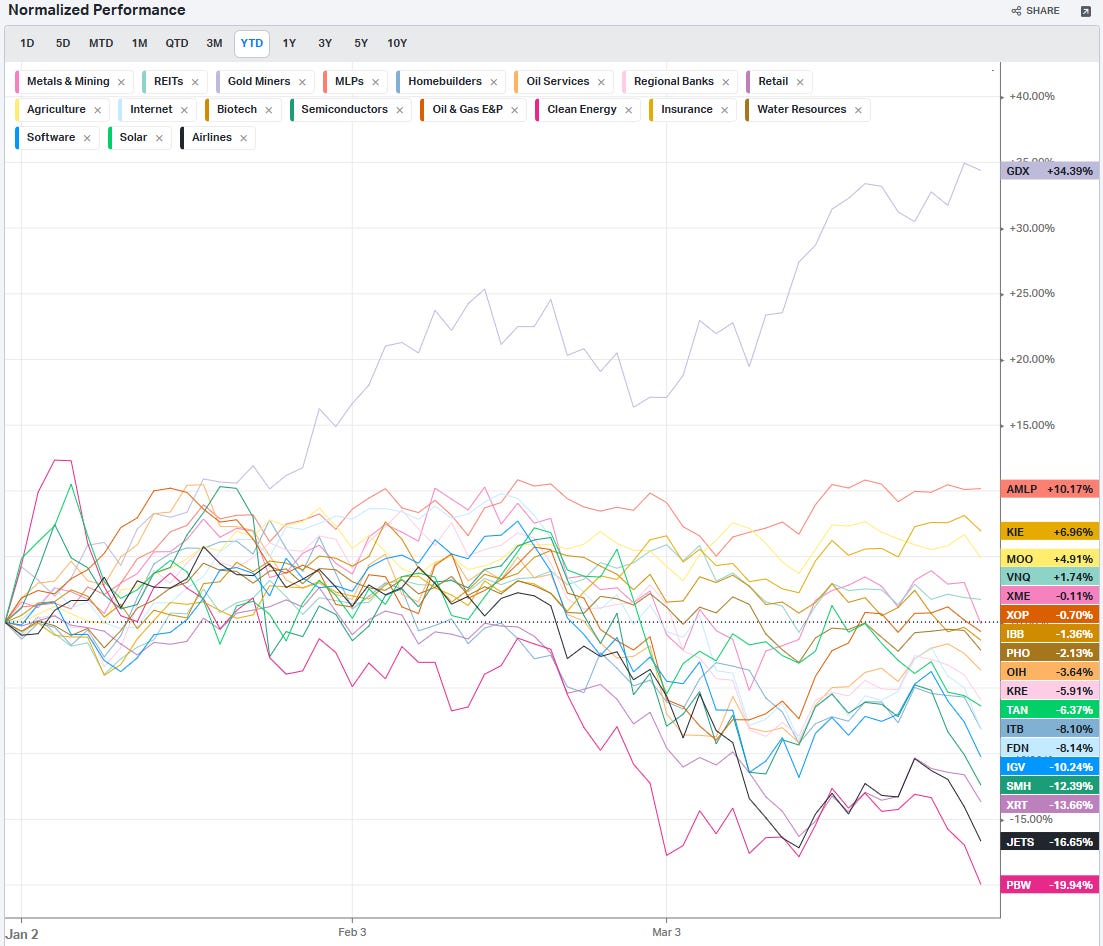
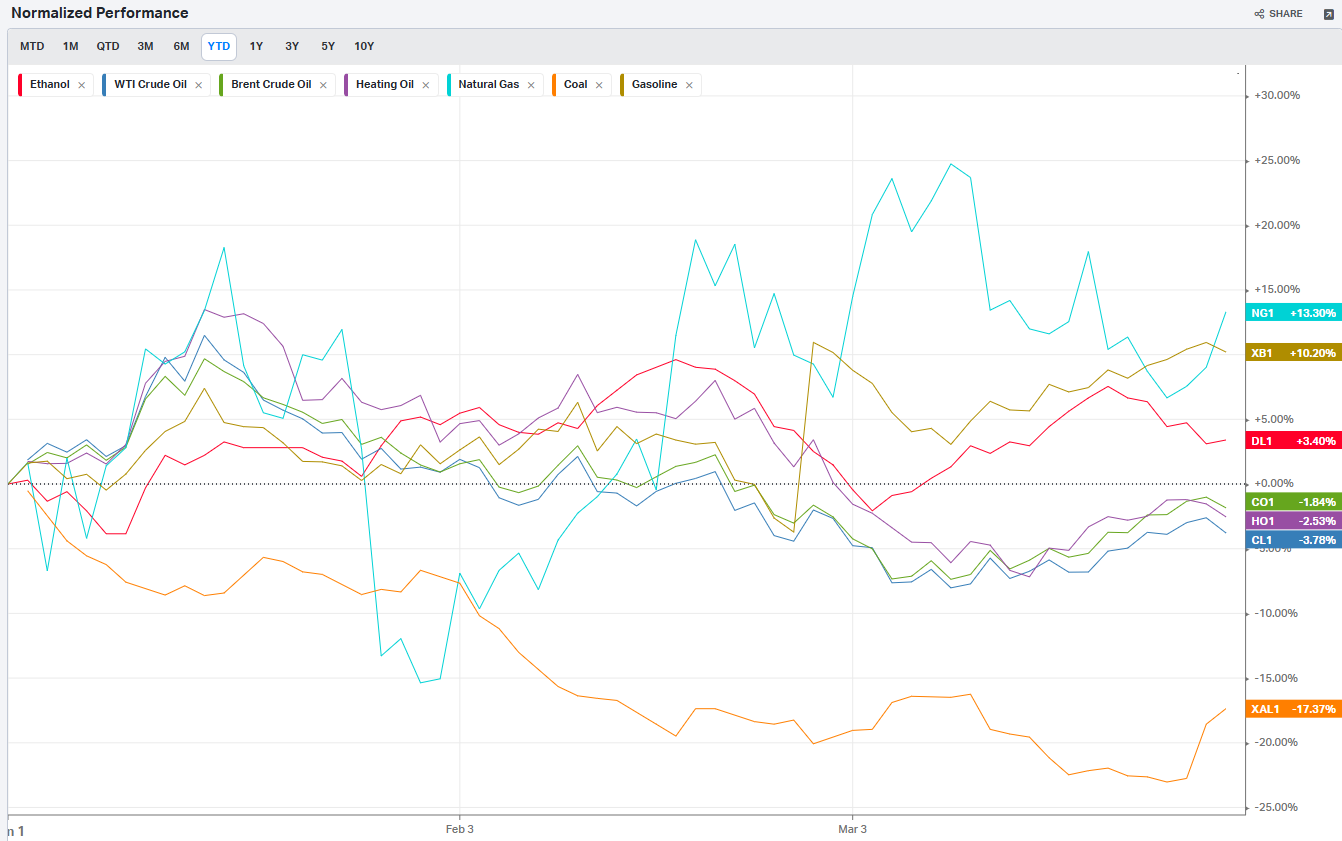
Summary Of Thematic Performance YTD
VolumeLeaders.com provides a lot of pre-built filters for thematics so that you can quickly dive into specific areas of the market. These performance overviews are provided here only for inspiration. Consider targeting leaders and/or laggards in the best and worst sectors, for example.
S&P By Sector
S&P By Industry
Commodities: Energy
Commodities: Metals
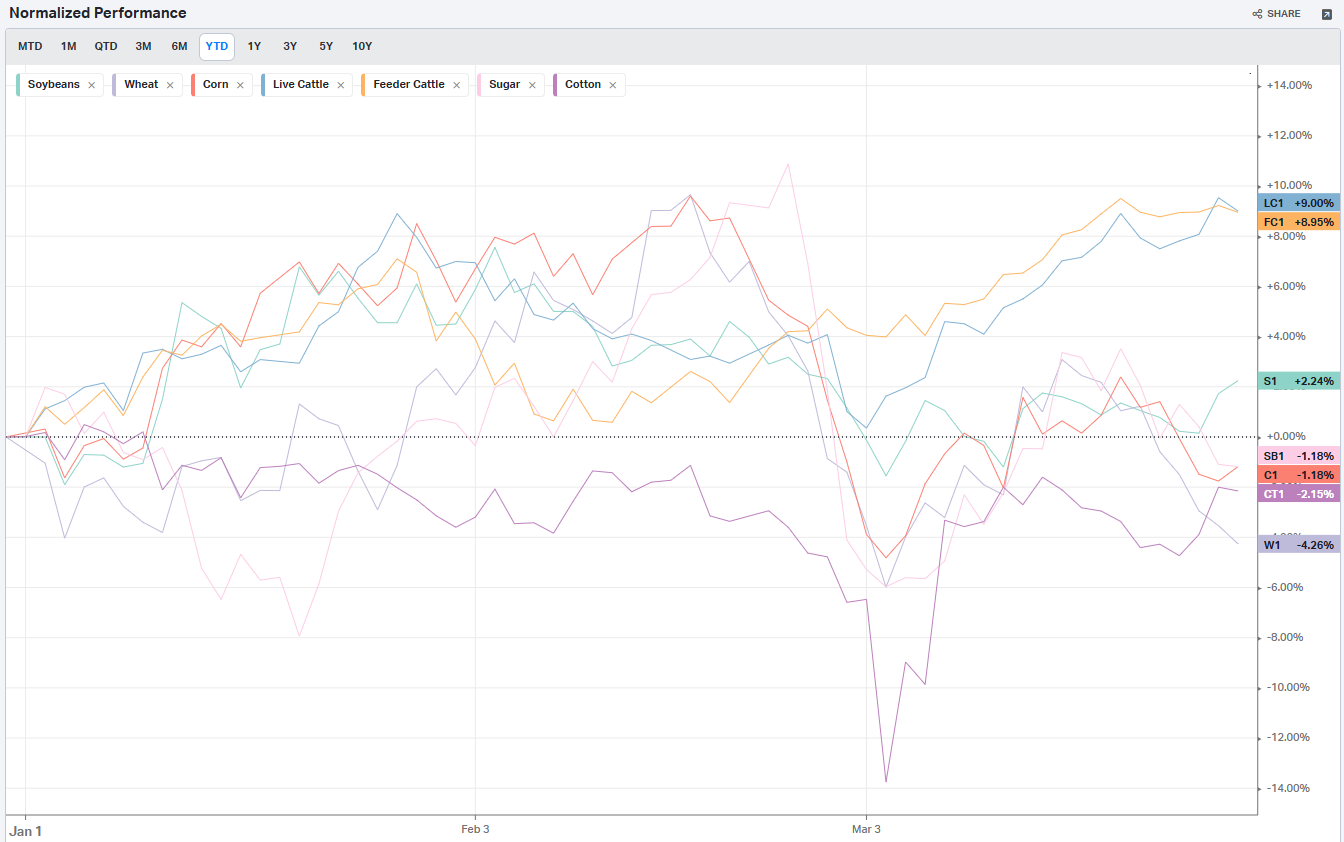
Commodities: Agriculture
Country ETFs
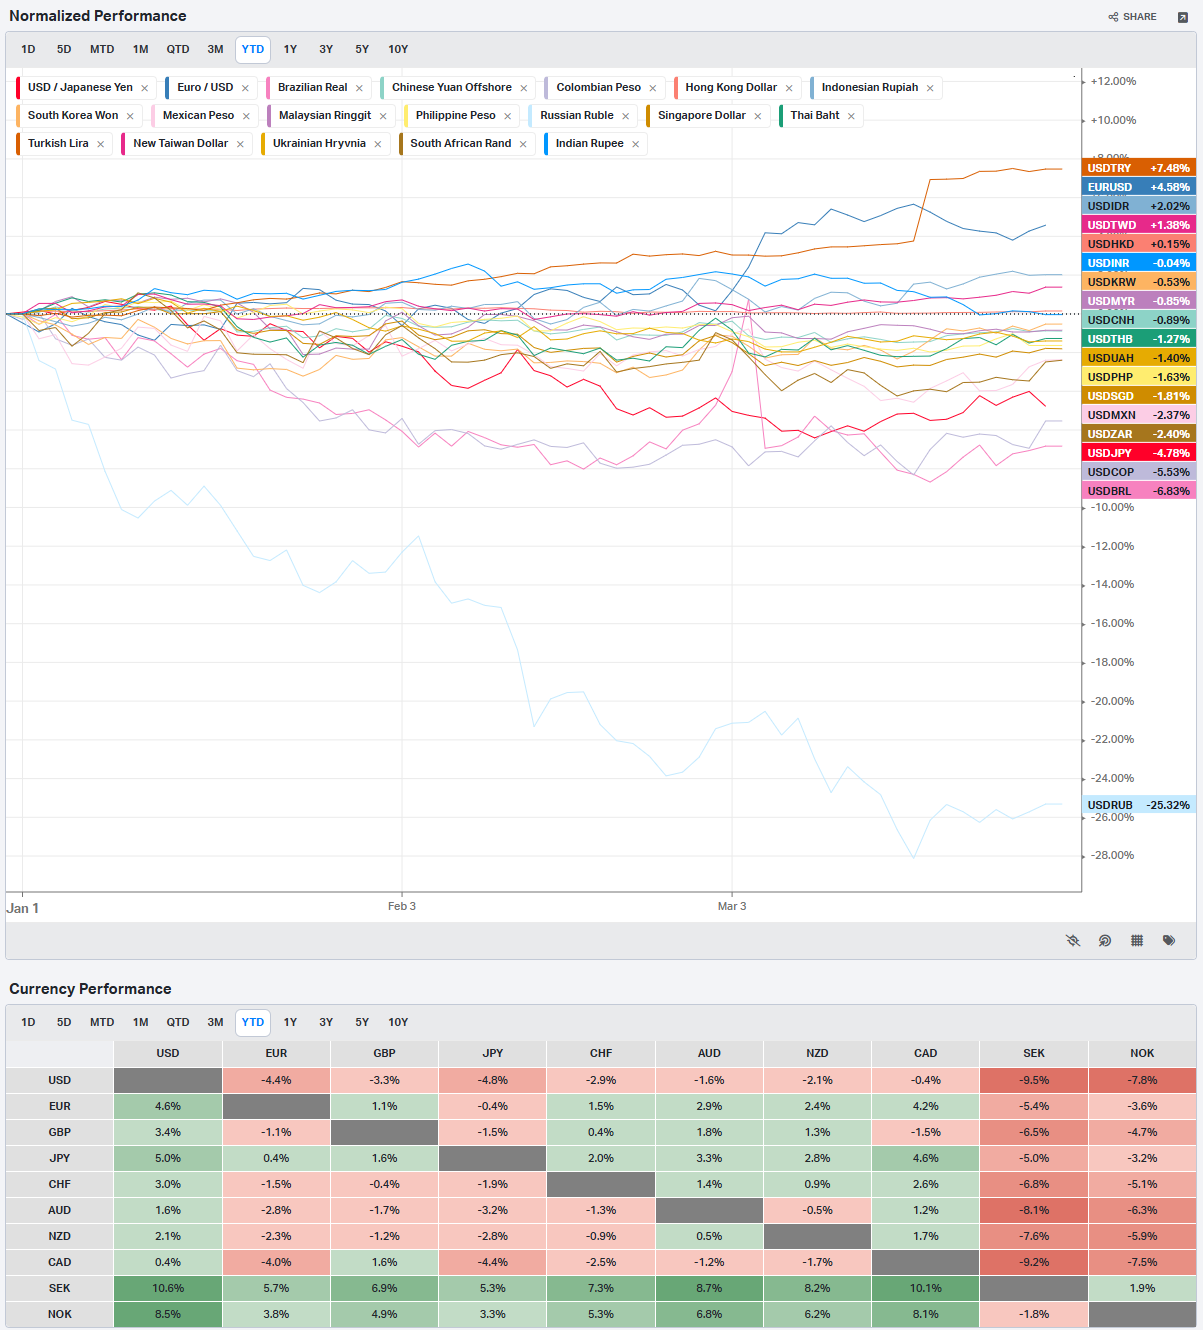
Currencies
Global Yields
Factors: Style
Factors: Size vs Value
Factors: Qualitative
Social Media Favs
Analyzing social sentiment can provide valuable insights for investment strategies by offering a pulse on public perception, mood, and market sentiment that traditional financial indicators might not capture. Here's how social sentiment analysis can enhance investment decisions:
- Market Momentum: Positive or negative social sentiment can signal impending momentum shifts. When public opinion on a stock, sector, or asset class changes sharply, it can create buying or selling pressure, especially if that sentiment becomes widespread.
- Early Detection of Trends: Social sentiment data can help investors spot trends before they show up in technical or fundamental data. For example, increased positive chatter around a particular company or sector might indicate growing interest or excitement, which could lead to price appreciation.
- Gauge Retail Investor Impact: With the rise of retail investor platforms, collective sentiment on social media can lead to significant price movements (e.g., meme stocks). Understanding how retail investors view certain stocks can help in identifying high-volatility opportunities.
- Event Reaction Monitoring: Social sentiment can provide real-time reactions to news events, product releases, or earnings reports. Investors can use this information to gauge market reaction quickly and adjust their strategies accordingly.
- Complementing Quantitative Models: By adding a social sentiment layer to quantitative models, investors can enhance predictions. For example, a model that tracks historical price and volume data might perform even better when factoring in sentiment trends as a measure of market psychology.
- Risk Management: Negative sentiment spikes can be a signal of potential downturns or increased volatility. By monitoring sentiment, investors might avoid or hedge against investments in companies experiencing a public relations crisis or facing negative perceptions.
- Long-Term Sentiment Trends: Sustained sentiment trends, whether positive or negative, often mirror longer-term market cycles. Tracking sentiment trends over time can help identify shifts in investor psychology that could affect longer-term investments or sector rotations.
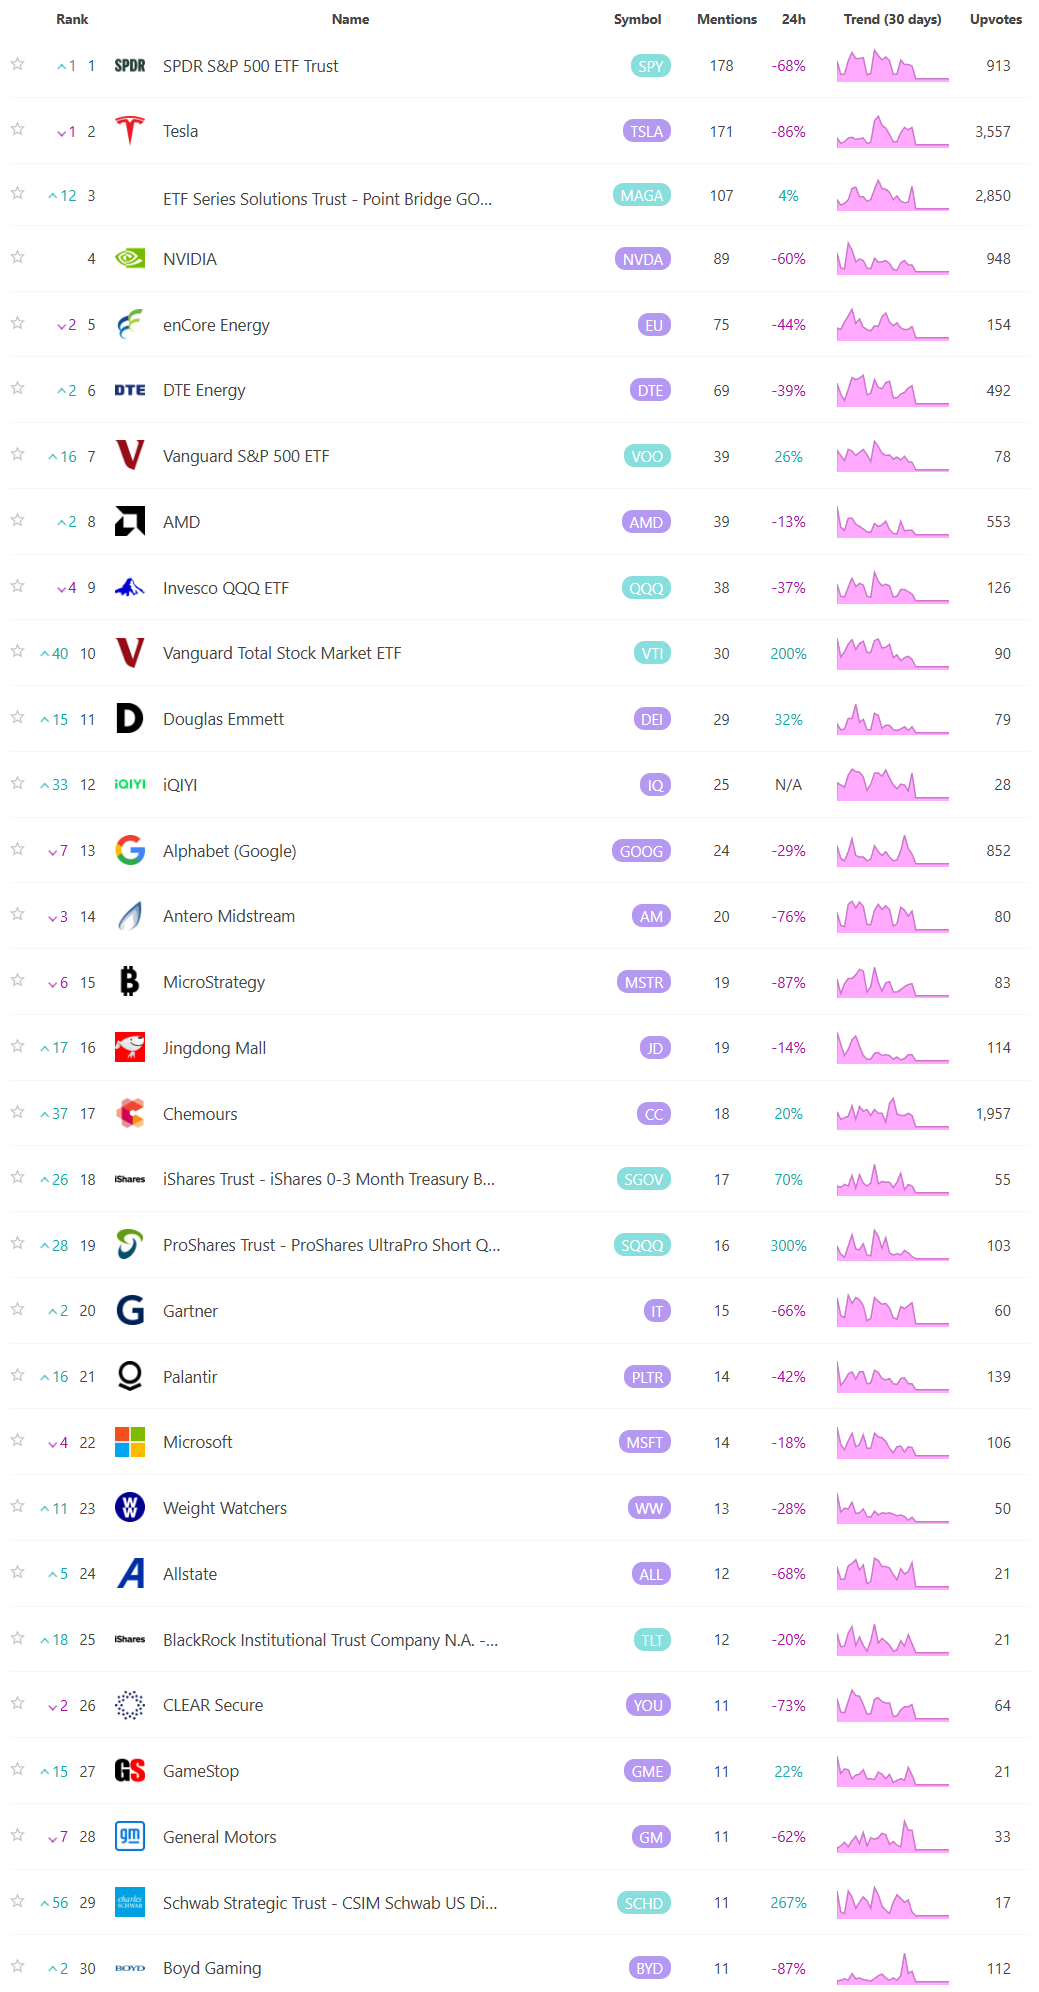
For these reasons, sentiment analysis, when combined with other tools, can provide a comprehensive view of both immediate market reactions and underlying investor attitudes, helping investors position themselves strategically across various time frames. Here are the most mentioned/discussed tickers on Reddit from some of the most active Subreddits for trading:
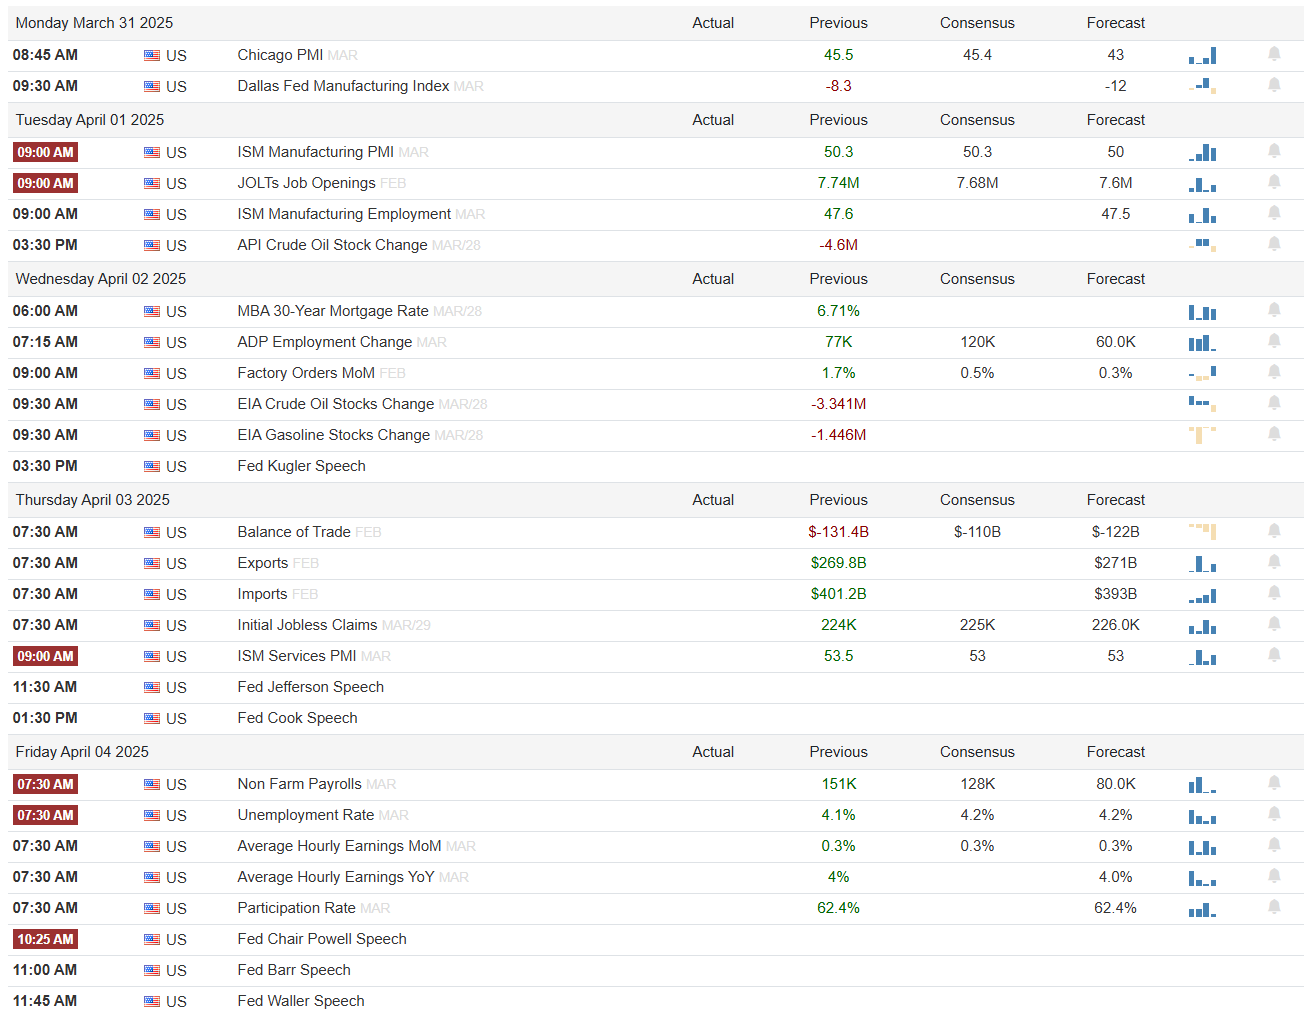
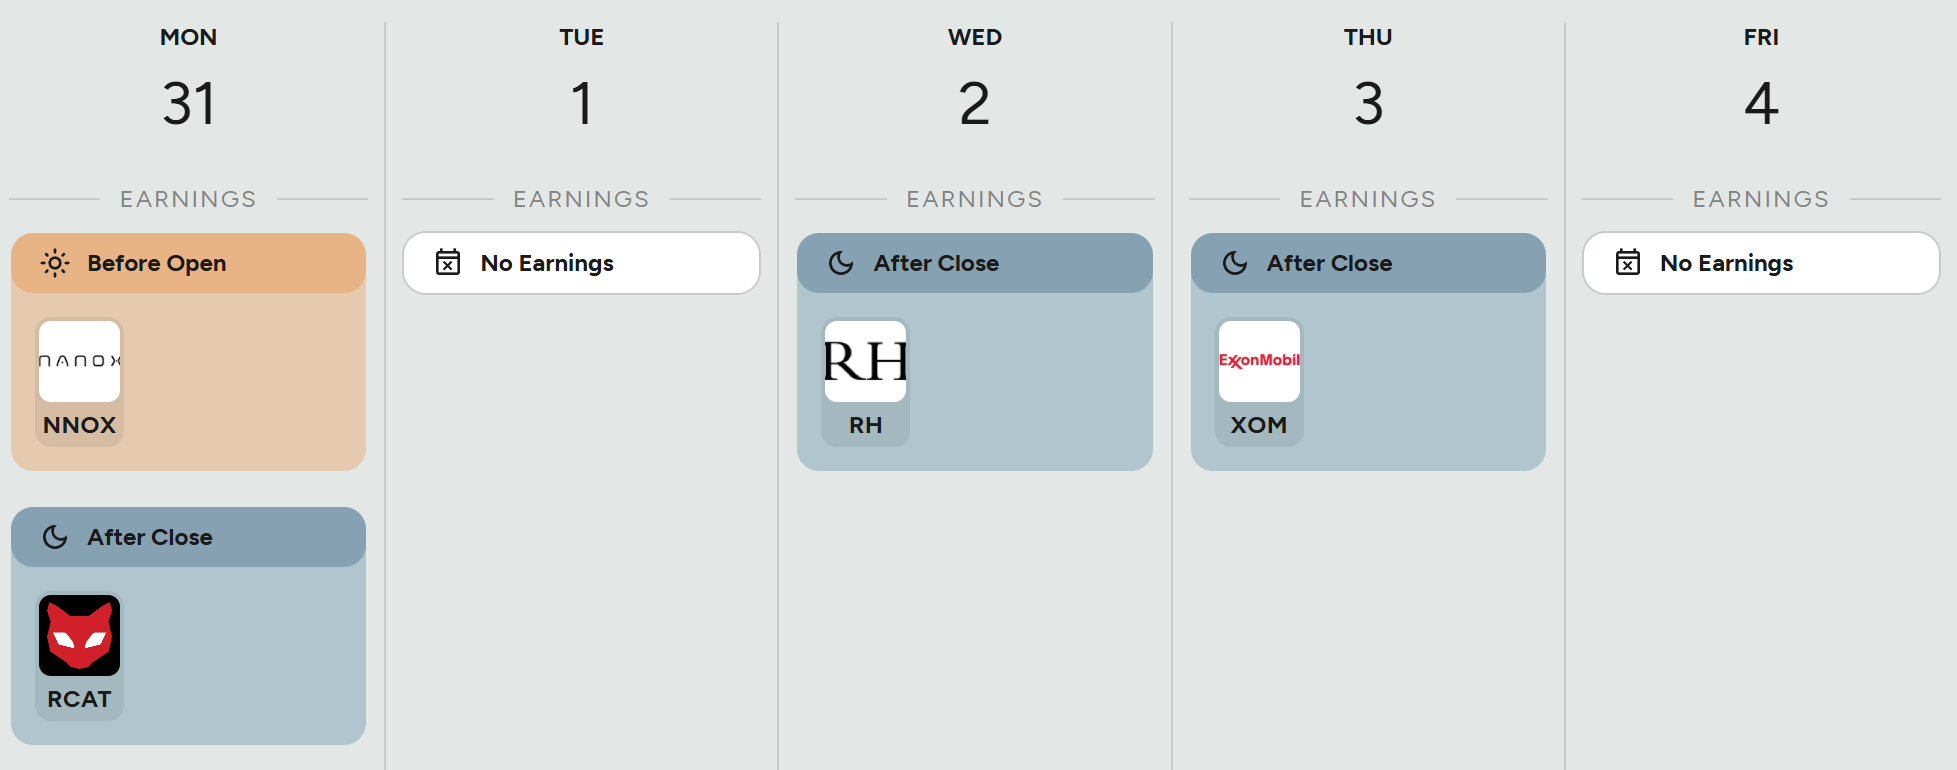
Events On Deck This Week
Here are key events happening this week that have the potential to cause outsized moves in the market or heightened short-term volatility.
Econ Events By Day of Week
Anticipated Earnings By Day of Week
Thank you for being part of our community and for taking the time to read this publication. Your engagement and insights mean a great deal to all of us, and we’re genuinely grateful to share this space with such dedicated and thoughtful readers. Wishing you a productive and successful week ahead in the markets. May the coming days bring clarity and great opportunities. Happy trading!
© 2025 Benzinga.com. Benzinga does not provide investment advice. All rights reserved.