


Target Corp. TGT shares are trading lower Wednesday, but look to be bouncing off an area of support.
The stock is moving after the company released third-quarter revenue. The revenue came in at $25.65 billion, which beat the analyst consensus of $24.78 billion.
Target was down 4.86% at $253.33 at press time.
See Also: Target Q3 Earnings Beat Estimates, Margin Shrinks; Racks Up Inventory
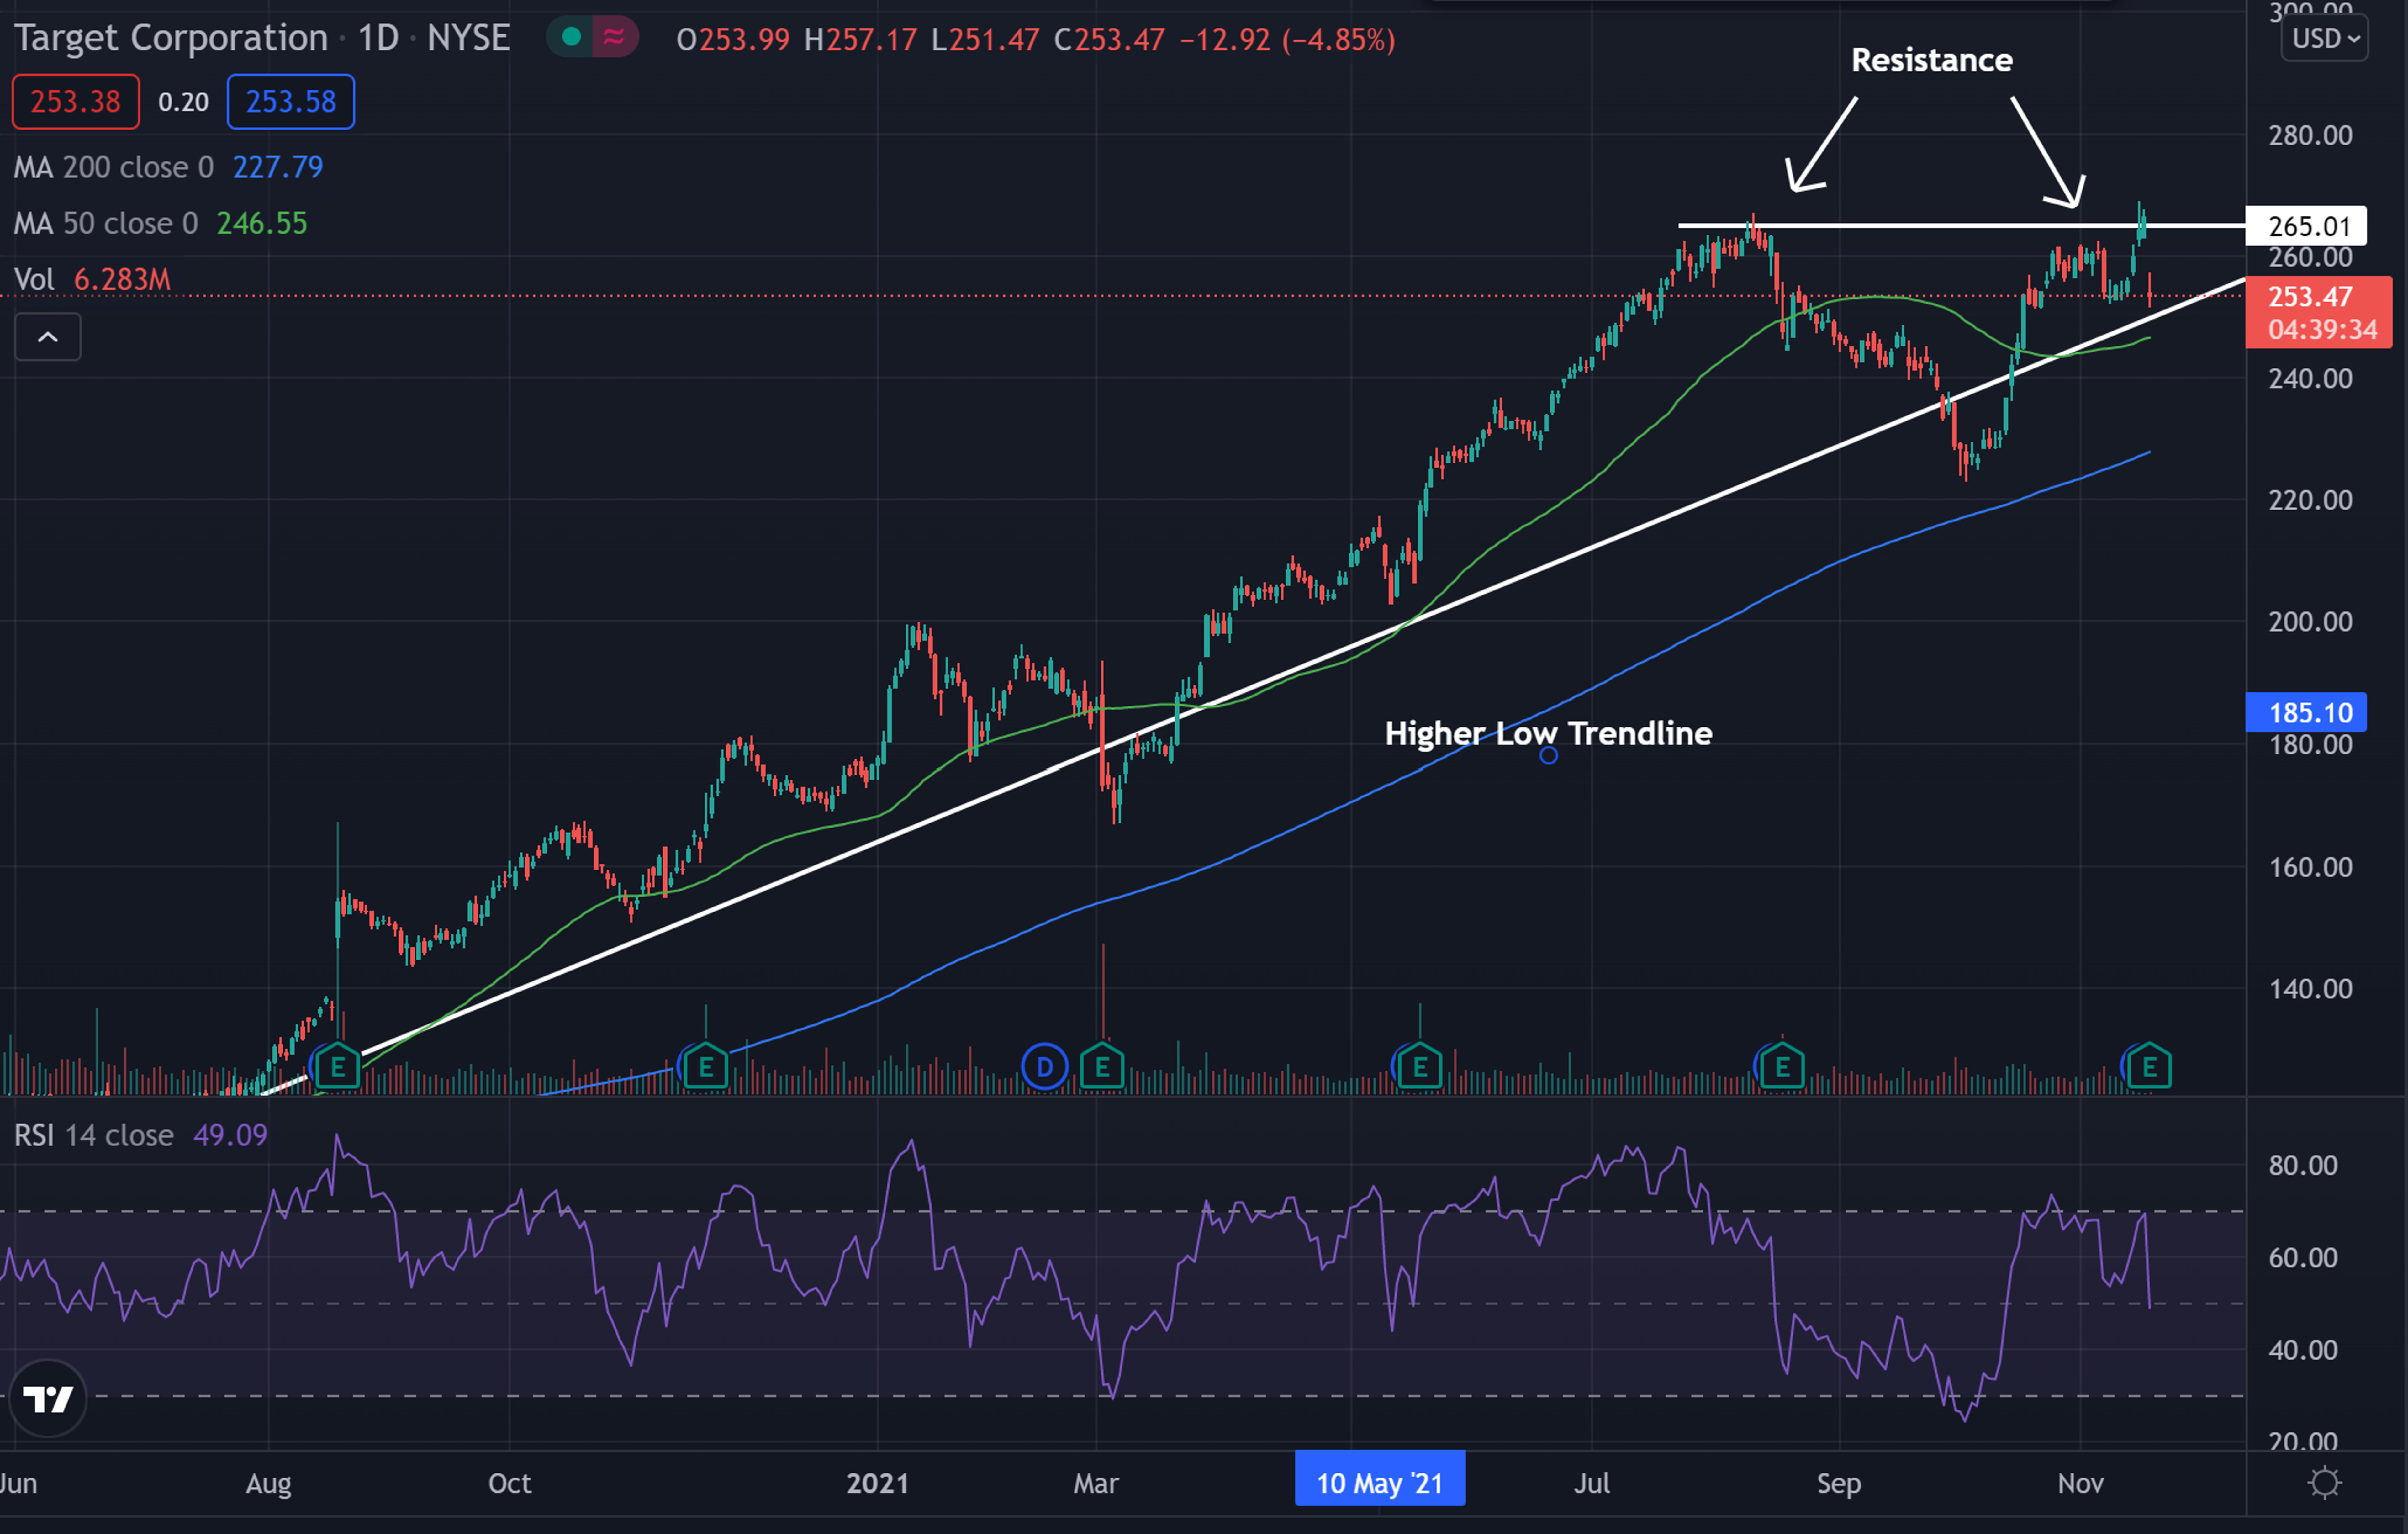
Target Daily Chart Analysis
- The stock looks to have bounced off of support in what technical traders call an ascending triangle pattern.
- The $265 price level is an area where the stock has struggled to cross above in the past, while the stock has been able to find support near the higher low trendline. These levels may continue to hold in the future.
- The stock trades above both the 50-day moving average (green) and the 200-day moving average (blue), indicating the sentiment in the stock is likely bullish.
- Each of these moving averages may hold as a potential area of support in the future.
- The Relative Strength Index (RSI) has dipped lower the past couple of days and now sits at 48. This shows recently, the stock has seen more selling pressure than buying pressure.

What’s Next For Target?
Bulls want to see the stock bounce off the support level and push up toward resistance. Bulls then want to see the stock break above resistance and consolidate for a time for a possible bullish push higher.
Bears want to see the stock fall below the higher low trendline to possibly see a trend change. Below this trendline with a period of consolidation could see the start of a downward trend.
Edge Rankings
Price Trend
© 2025 Benzinga.com. Benzinga does not provide investment advice. All rights reserved.
Trade confidently with insights and alerts from analyst ratings, free reports and breaking news that affects the stocks you care about.

