


Zinger Key Points
- The massive amount of volatility in the funds appears to have somewhat subdued over the past few trading days, although on Friday, YINN was soaring about 17% higher and YANG was falling about 16% lower.
- Over the coming trading days, it is likely that both funds will enter into consolidation patterns before continuing in the trends YINN and YANG have developed into on their charts.
- Ready to turn the market’s comeback into steady cash flow? Grab the top 3 stocks to buy right here.
Direxion Daily FTSE China Bull 3X Shares YINN and Direxion Daily FTSE China Bear 3X Shares YANG are ETFs tracking the direct or inverse results of the FTSE China 50 Index by 300% and have experienced high levels of volatility over recent weeks.
The increasing volatility began on Feb. 23 following Russia’s invasion of Ukraine, which stirred fear China could become at least partly involved in the crisis.
The Asian country has also been battling with a new wave of the omicron COVID-19 virus, and on March 11 Chinese officials announced a lockdown for the city of Changchun, which has a population of nine million people.
The latest news has only accelerated the decline of Chinese stocks, which have plummeted over the past many months amid regulatory fears amid China’s crackdown on its native companies. Alibaba Group Holdings Ltd - ADR BABA, the second-largest holding in the FTSE China 50 Index with a weighting of 8.48%, plunged about 77% from Oct. 27, 2020, all-time high of $319.32 to reach a multi-year low of $73.28 on March 15.
On March 16, YINN and YANG reversed course after The China Securities Regulatory Commission said it would work with U.S. regulators to find a solution over audit supervision, which has put some China-based stocks in risk of being delisted from U.S. stock exchanges.
YINN, a triple leveraged fund that is designed to outperform the China 50 Index by three times, plummeted more than 63% between Feb. 23 and March 15 before beginning to rebound. YANG, which is inversely correlated to the FTSE China 50 and delivers three times its decline, soared 144% higher over that same time period before suffering a massive sell-off.
The massive amount of volatility in the funds appears to have somewhat subdued over the past few trading days, although on Friday, YINN was soaring about 17% higher and YANG was falling about 16% lower.
Over the coming trading days, it is likely that both funds will enter into consolidation patterns before continuing in the trends YINN and YANG have developed into on their charts.
It should be noted that events affecting the general markets, negative or positive reactions to earnings prints and news headlines can quickly invalidate patterns and breakouts. As the saying goes, "The trend is your friend until it isn't," and any trader in a position should have a clear stop set in place and manage their risk versus reward.
See Also: Here's Why Alibaba And Other Chinese Stocks Are Trading Higher Premarket
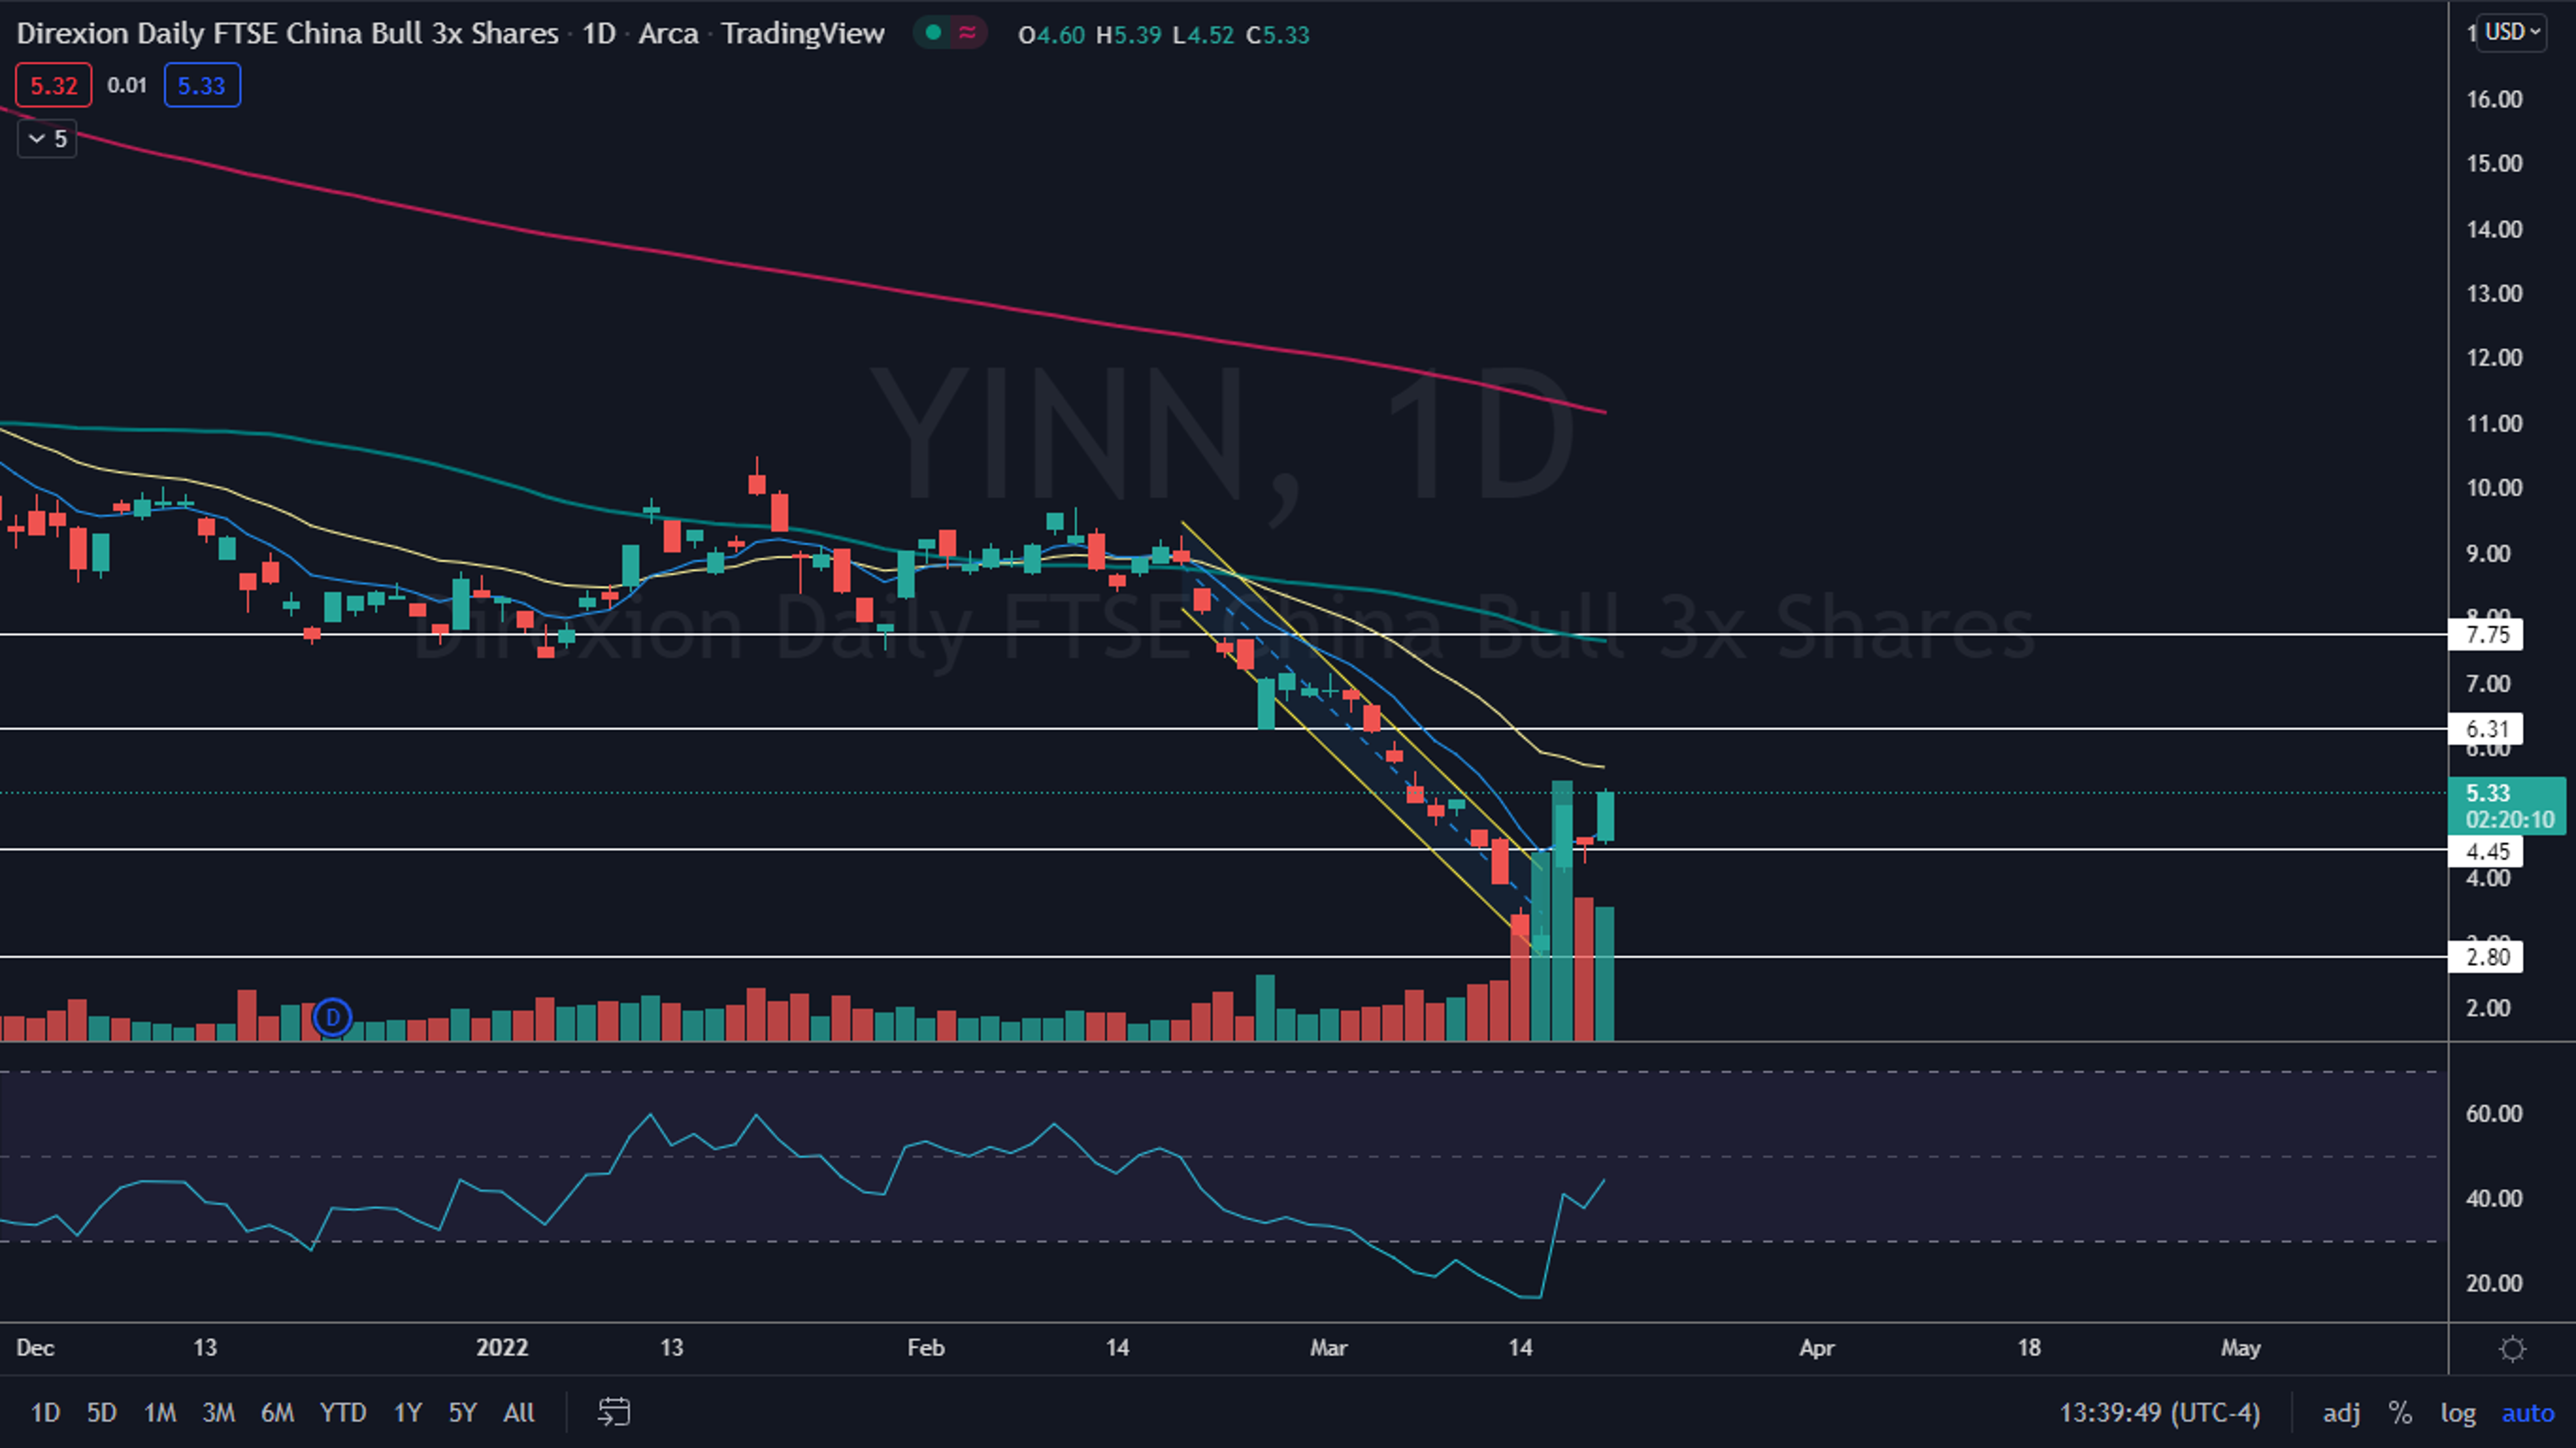
The YINN Chart: In YINN’s decline, the fund formed into a falling channel between two parallel trendlines and on March 16, YINN gapped up about 25% on the open, which represented a bullish break from the channel. A falling channel is considered to be a bearish pattern until a stock or ETF breaks up from the upper descending trendline of the pattern on higher-than-average volume.
- YINN consolidated on Thursday with a bullish inside bar pattern and on Friday, the fund broke up bullishly from the pattern.
- The fund may be forming an uptrend but will need to print a higher low above $2.80 in order to confirm the pattern. Bullish traders may choose to take a position when the higher low is confirmed by a reversal candlestick such as a doji or hammer.
- YINN is trading on higher-than-average volume again on Friday, which indicates there is a high level of bullish interest in the fund.
- There is resistance above at $6.31 and $7.75 and support below at $4.45 and $2.80.
Want direct analysis? Find me in the BZ Pro lounge! Click here for a free trial.

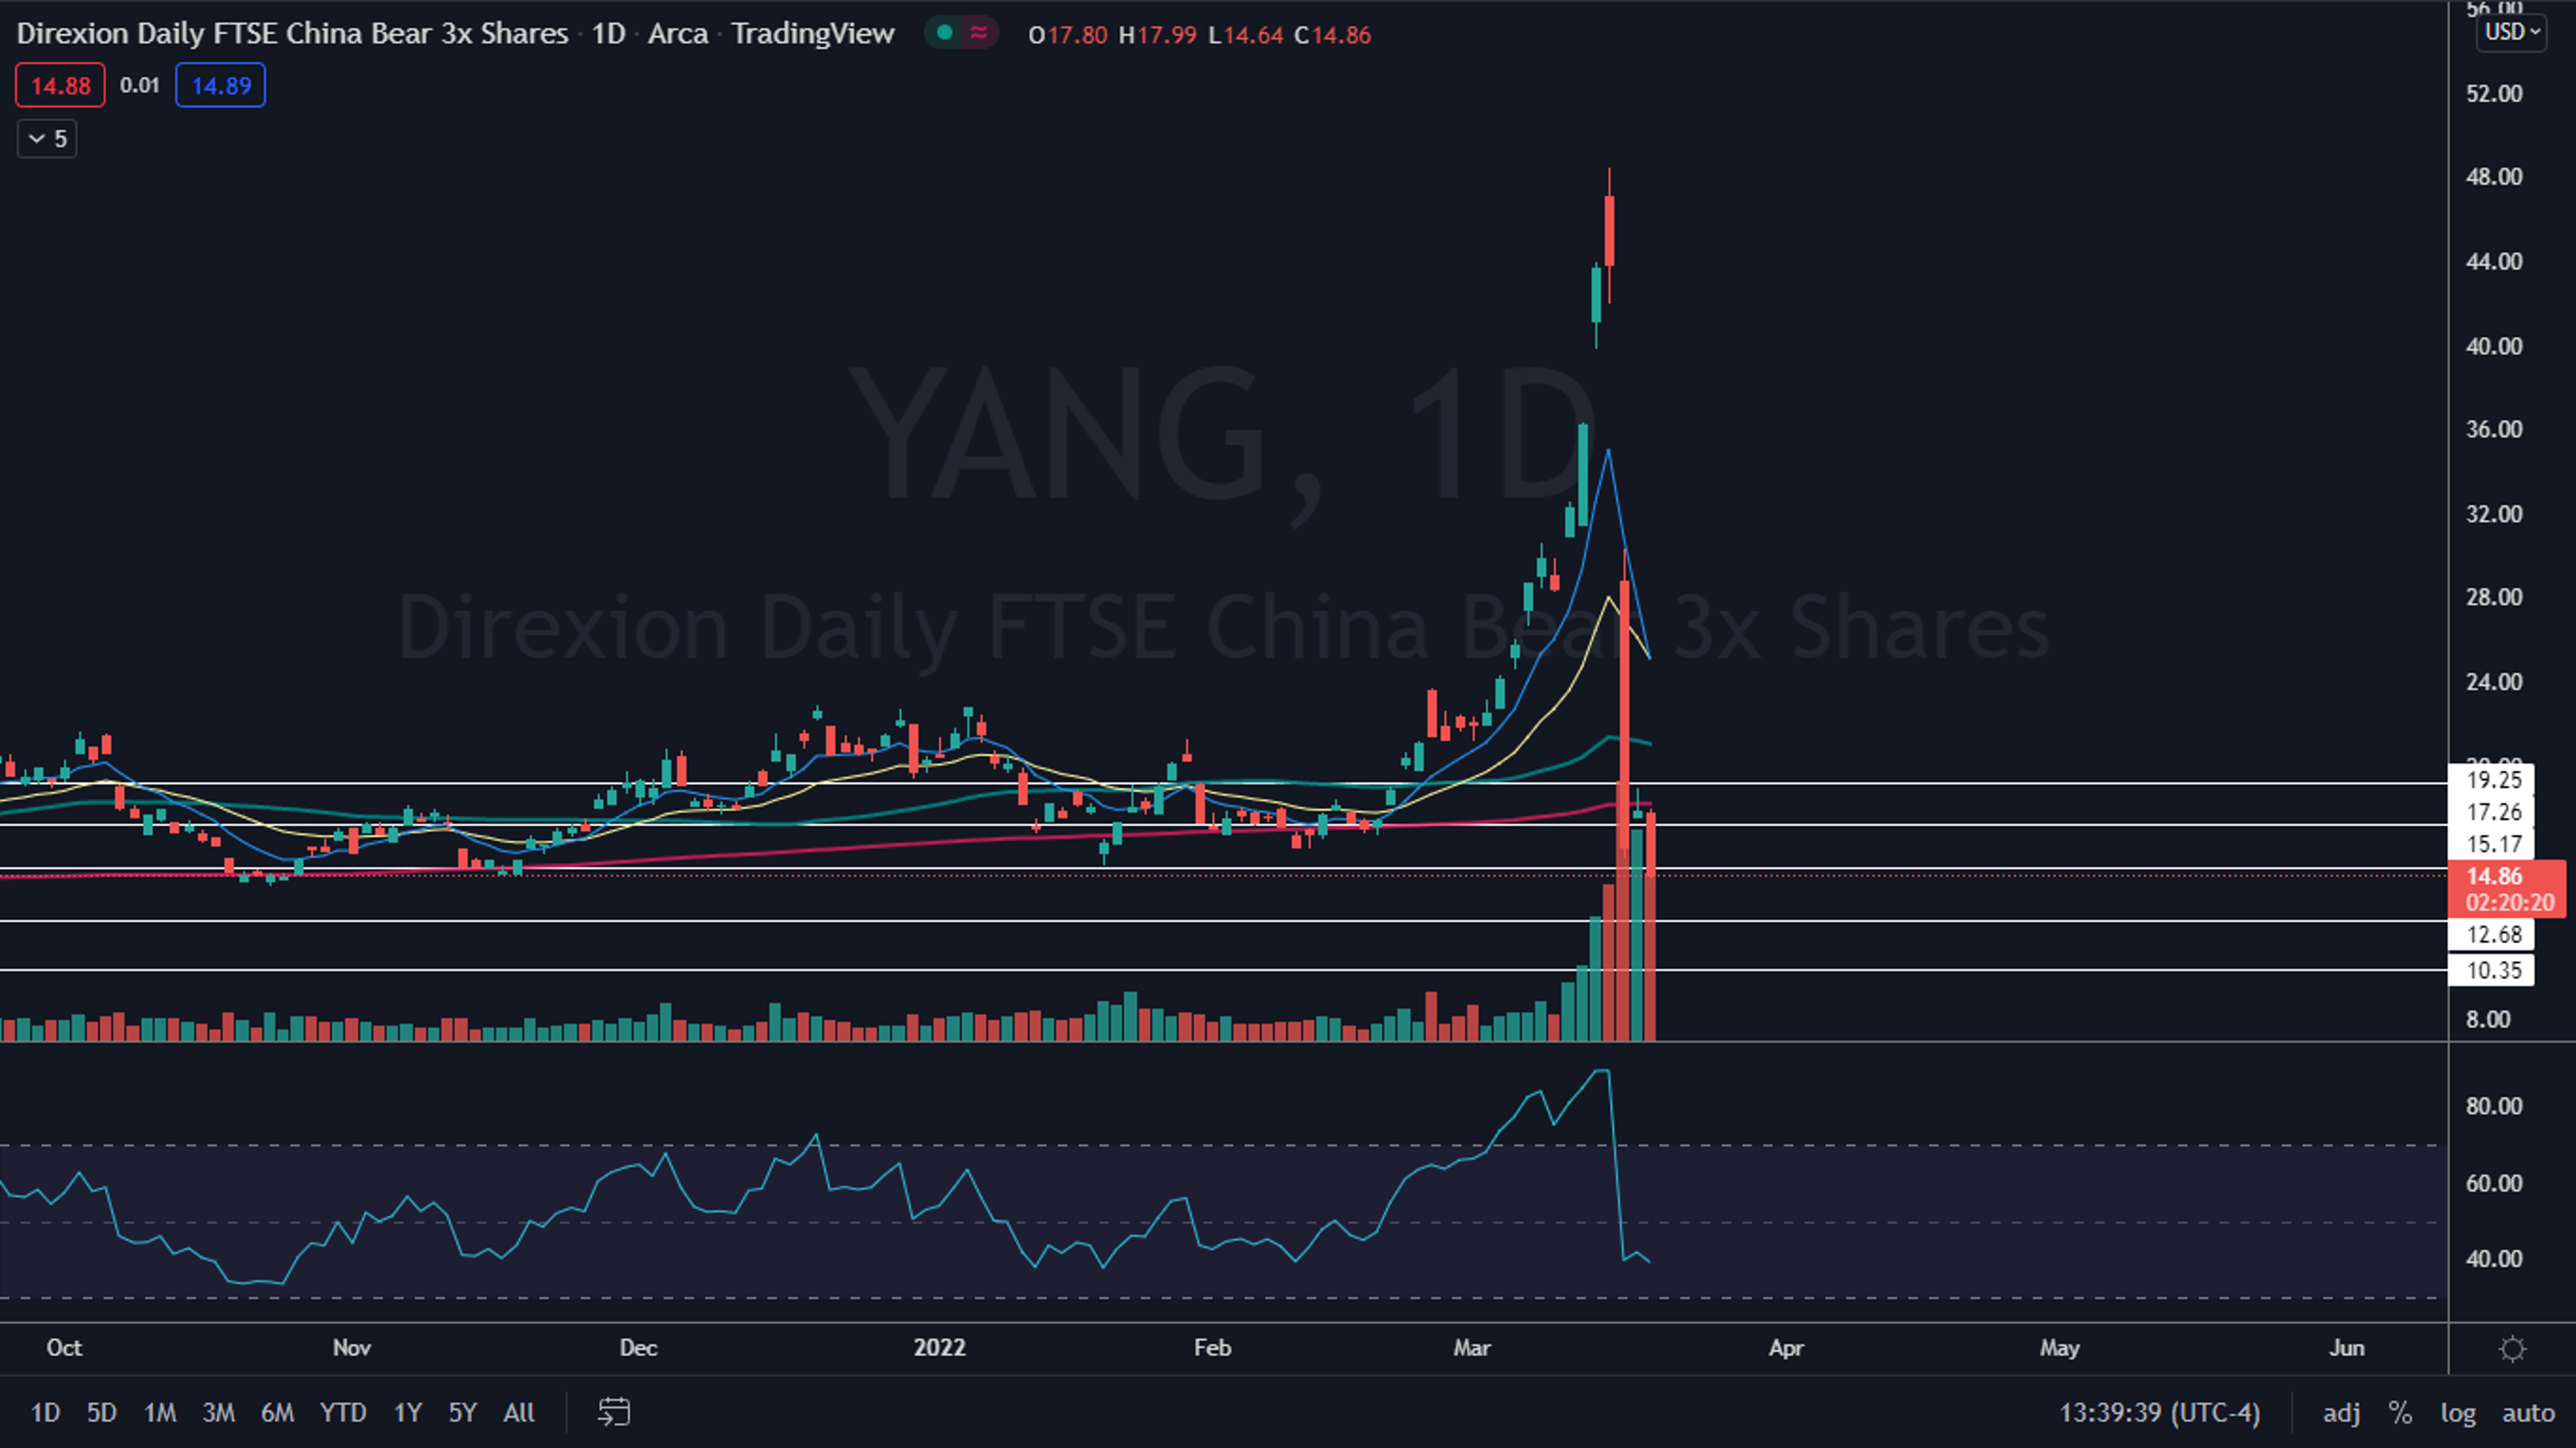
The YANG Chart: After reaching a 52-week high of 48.44 on March 15, YANG gapped down more than 30% the following day and has continued to plummet since, plunging an additional 48% to trade below the $15 level.
- Like YINN, YANG has had much higher-than-average volume but in this case the volume is bearish and indicates more downside may be in the cards.
- The most likely scenario is that YANG will form an inside bar on Monday because the massive drop has pushed the relative strength index down to the 38% level.
- The fund will eventually need to bounce up to form a lower high on the daily chart, and traders who are bearish on the FTSE China 50 Index may choose to take a position in YANG on confirmation of the lower high.
- YANG has resistance above at $15.70 and $17.26 and support below at $12.68 and $10.35.
Edge Rankings
Price Trend
© 2025 Benzinga.com. Benzinga does not provide investment advice. All rights reserved.
Trade confidently with insights and alerts from analyst ratings, free reports and breaking news that affects the stocks you care about.

