On Thursday evening, Benzinga asked its followers on Twitter what they’re buying at the open on Friday. From the replies, Benzinga selected one ticker for technical analysis. @jperkins120, @MoOogaBooga, and @right_sum are buying SmileDirectClub, Inc SDC.
@thomasdiago, in response to @MoOogaBooga, posted a link to danelfin, a stock rating website that uses artificial intelligence to calculate a stocks’ probability of beating the markets. The website currently has SmileDirect rated as a 9/10.
Traders may also take interest in SmileDirect due to its underlying statistics, which make it a potential short squeeze candidate:
- Relatively Small Float: SmileDirect has a 99.47 million share float.
- High Ownership Levels: 71% of SmileDirect’s float is held by insiders and institutions with insiders owning 3.41% and institutions a whopping 68.59%.
- High Short Interest: 39.09 million shares of SmileDirect are held short, meaning 37.18%. The number is up from 34.24 million in August.
- See Also: Corsair Gaming Becomes Top WallStreetBets Interest; GameStop, Tesla, Virgin Galactic And These Are Other Top Trends
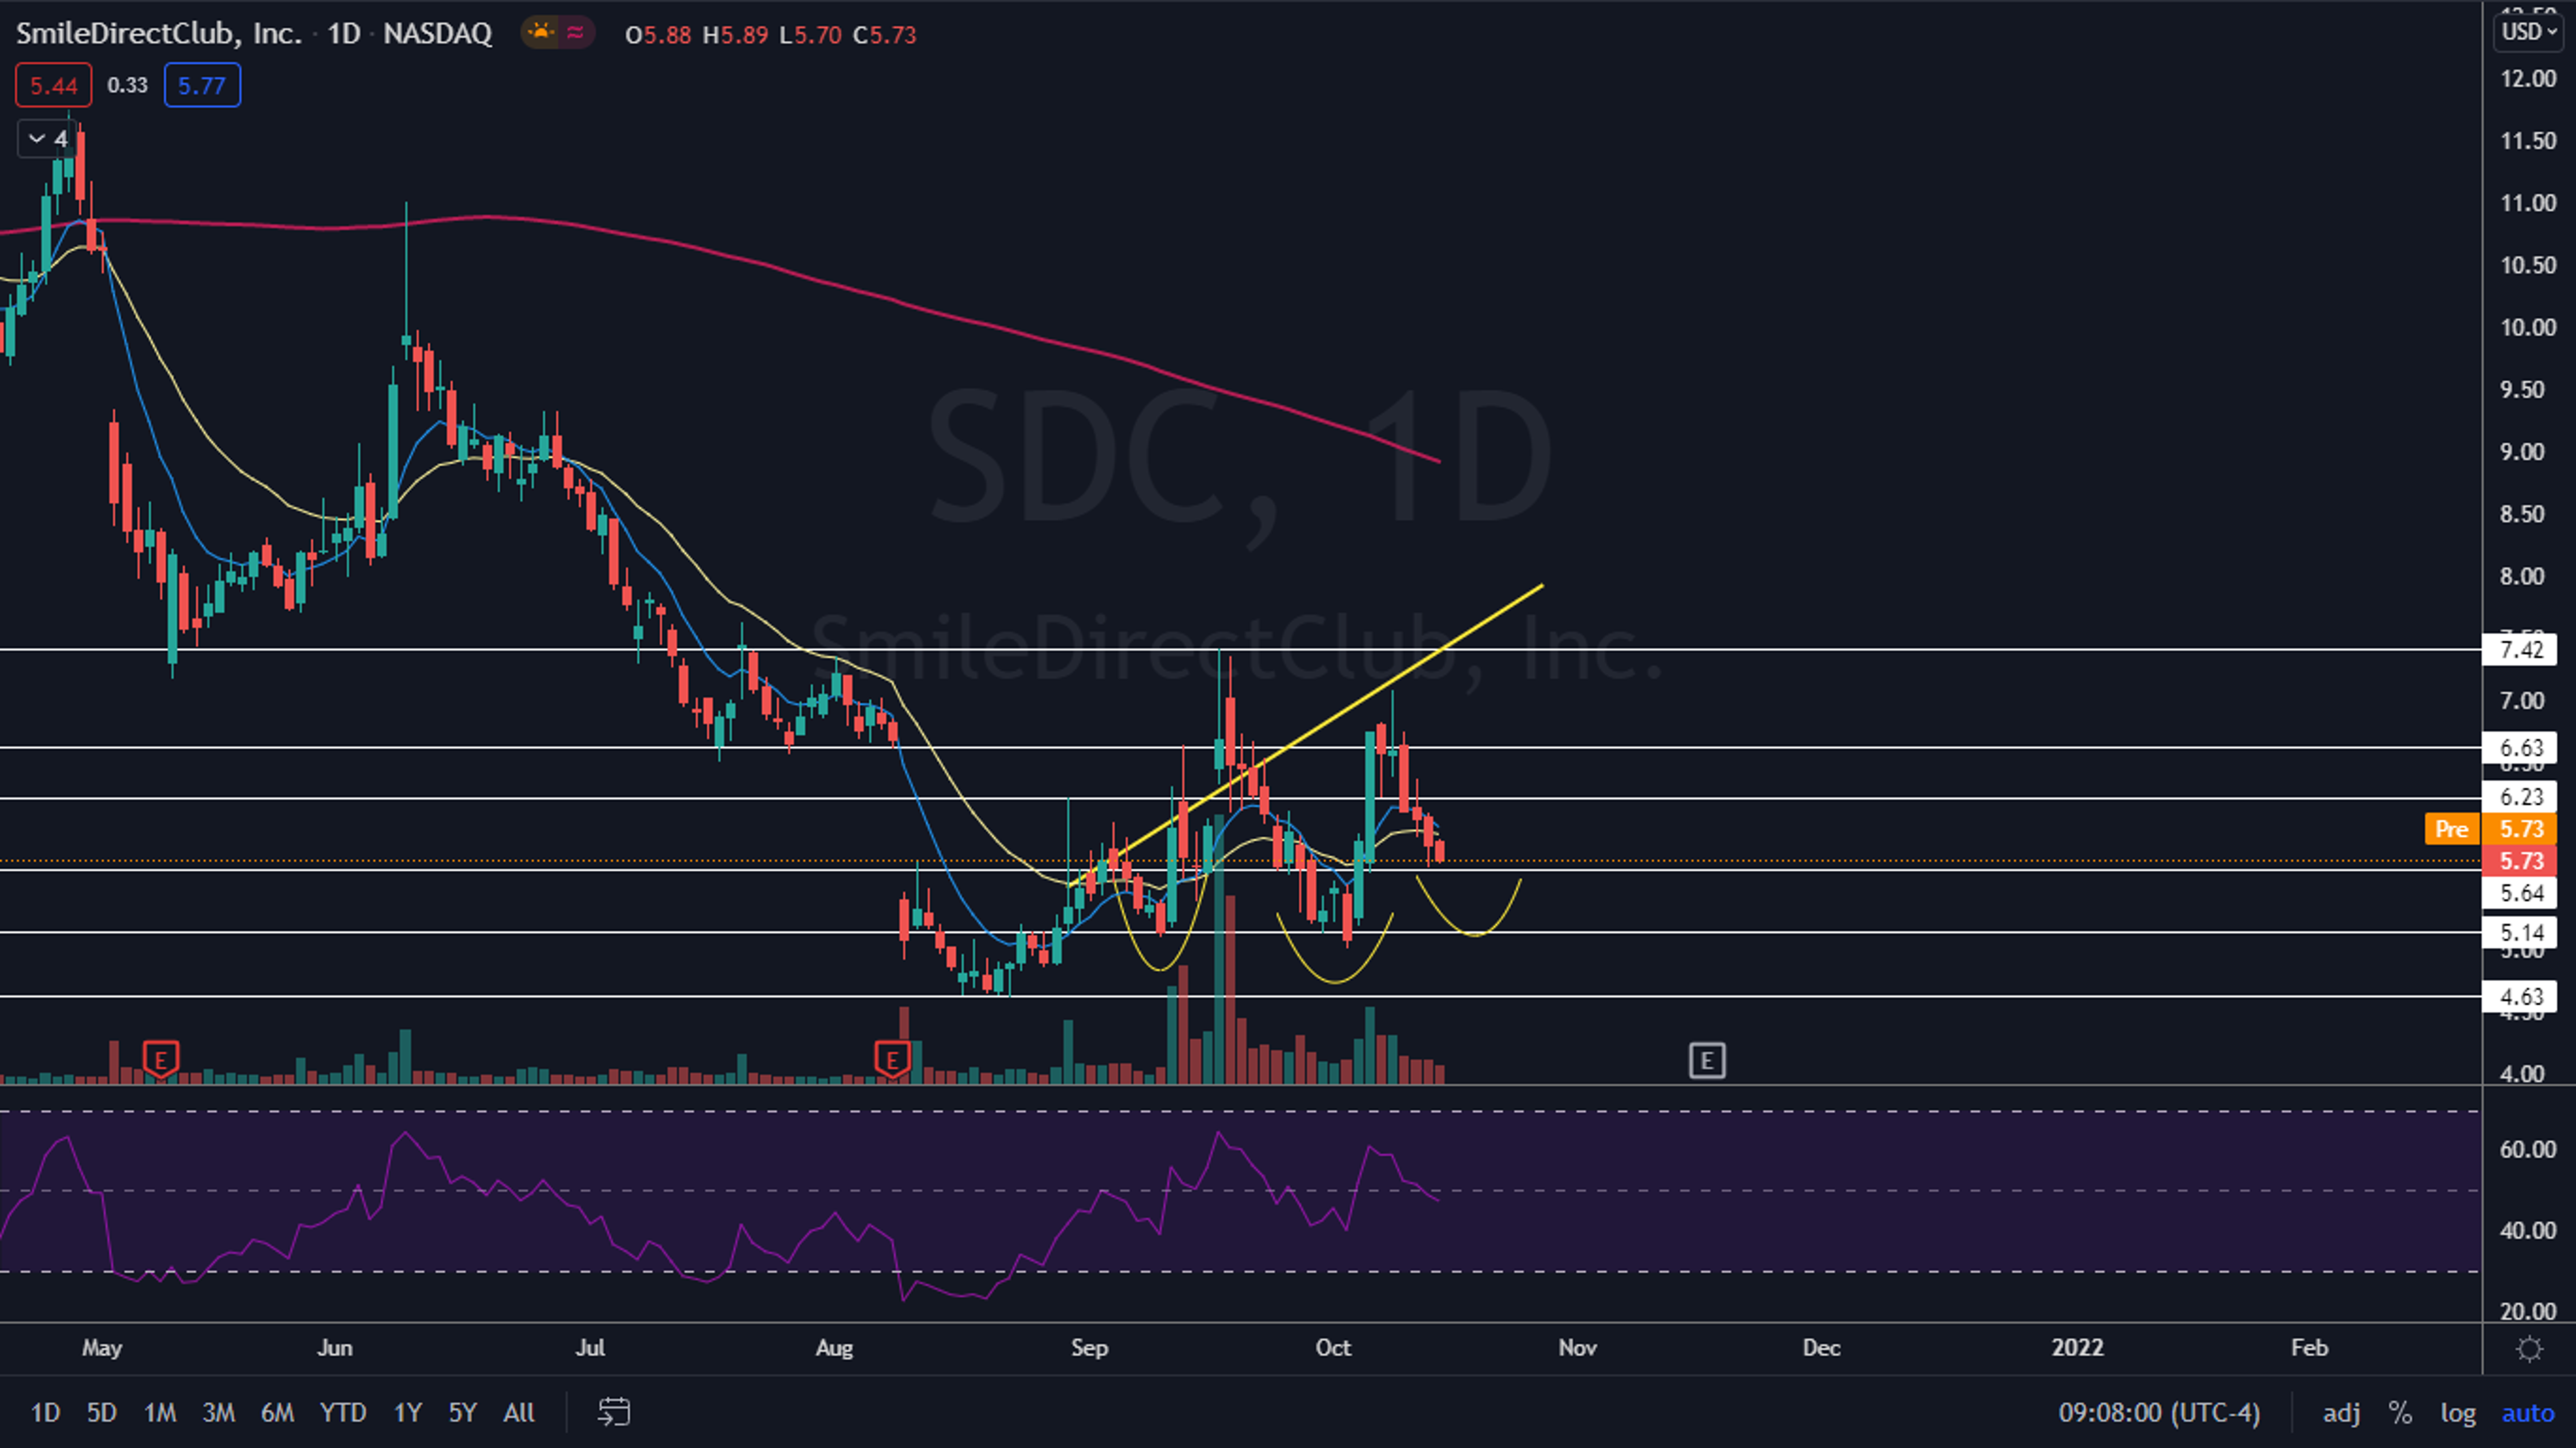
The Smile Direct Chart: SmileDirect is trading down about 73% off its Sept. 12, 2019, high of $21.22, and 64% below its Jan. 28 52-week high of $16.08. Since reaching its last high, SmileDirect entered into a months-long downtrend before finding a bottom at $4.63 in August.
SmileDirect tested support at $4.63 on Aug. 17, Aug. 20 and Aug. 23 and bounced, which created a bullish triple bottom pattern on the daily chart. The stock then reacted to the pattern and bounced up 60% before topping out on Sept. 17 at $7.42.
Since the date, SmileDirect has retraced lower two times, which may have created a bullish inverted head-and-shoulders pattern. If the most recent retracement, between Oct. 11 and Thursday, is the right shoulder of the pattern, the stock should begin to curl upwards toward the neckline over the following few trading days.
Over the course of the week, SmileDirect’s volume has decreased, as has its daily trading range. This is a further indication the stock may begin to rise again as it is running out of sellers.
SmileDirect is trading slightly below the eight-day and 21-day exponential moving averages (EMAs), but the eight-day EMA is trending above the 21-day. Bulls will want to see SmileDirect regain support of the two EMAs in the near future to avoid the eight-day crossing below the 21-day. The stock is trading well below the 200-day simple moving average, which indicates overall sentiment is bearish.
- Bulls want to see SmileDirect rise up to complete the left shoulder of the pattern and then for big bullish volume to push the stock up through the neckline. The stock has resistance above at $6.23 and $6.63.
- Bears want to see big bearish volume come in and drop SmileDirect down below a support level at $5.64. Below the level, there is further support at $5.14 and a retracement below the level would negate the inverted head-and-shoulders.

© 2025 Benzinga.com. Benzinga does not provide investment advice. All rights reserved.
Trade confidently with insights and alerts from analyst ratings, free reports and breaking news that affects the stocks you care about.

