
Facebook Inc’s (NASDAQ:FB) woes may be set to intensify with a second whistleblower, former employee and data scientist Sophie Zhang, offering to testify before Congress, according to a report by the New York Post. Earlier this month, former product manager Frances Haugen testified before the Senate.
The whistleblowers' allegations include Facebook’s priority of putting profits over people, misleading the public, failure to crack down on predatory behavior online, spread of divisive and extreme messages and the effects of Facebook and Instagram on children’s mental health.
Amid the investigation, combined with overall wobbly markets, Facebook's stock has been in freefall since Sept. 10 when shares were trading near its Sept. 1 all-time high of $384.33. For technical traders, the price action created a bearish double top pattern at the level and was likely to fall regardless of the news.
See Also: Tesla Becomes Top WallStreetBets Interest And These Are Other Top Trends Today
The Facebook Chart: Facebook is trading down about 15% off its all-time high compared to the Nasdaq, which is down about 6% from its Sept. 7 all-time high of 15,708.75. Although Facebook’s stock has bounced up a few times during its plummet, the intermittent rises in share price have been met with sellers and the stock has confirmed a consistent downtrend.
Facebook’s relative strength index (RSI) has been hovering down 30% and 39% since Sept. 20. When a stock’s RSI nears or exceeds the 30% level it becomes oversold, which is a buy signal for technical traders. Each time Facebook’s RSI has tapped 30% the stock price has popped up, albeit temporarily.
On Tuesday Facebook’s RSI reached 30% again and buyers came in. This caused Facebook to print a hammer candlestick on the daily chart with a long lower wick demonstrating bulls bought the dip. The hammer candlestick indicates the downtrend may be over but Wednesday’s candle will be needed for confirmation.
The hammer candlestick was created when Facebook tagged the 200-day simple moving average (SMA) and because Facebook is trading above the level overall sentiment is bullish. The stock is trading below the eight-day and 21-day exponential moving averages (EMAs), however, with the eight-day EMA trending below the 21-day, both of which are bearish indicators for the short-term.
- Bulls want to see big bullish volume come in and drive Facebook’s stock up over a resistance level at $324.50. If the stock can regain the level as support, it has room to trade up toward the $333.78 mark, which would put it over the eight-day EMA. The stock needs to trade up to the $339 level to indicate a possible trend change.
- Bears want to see big bearish volume drop Facebook down below support of the 200-day SMA and toward a support level at $313.27. Below the level, there is further support at $303.60.

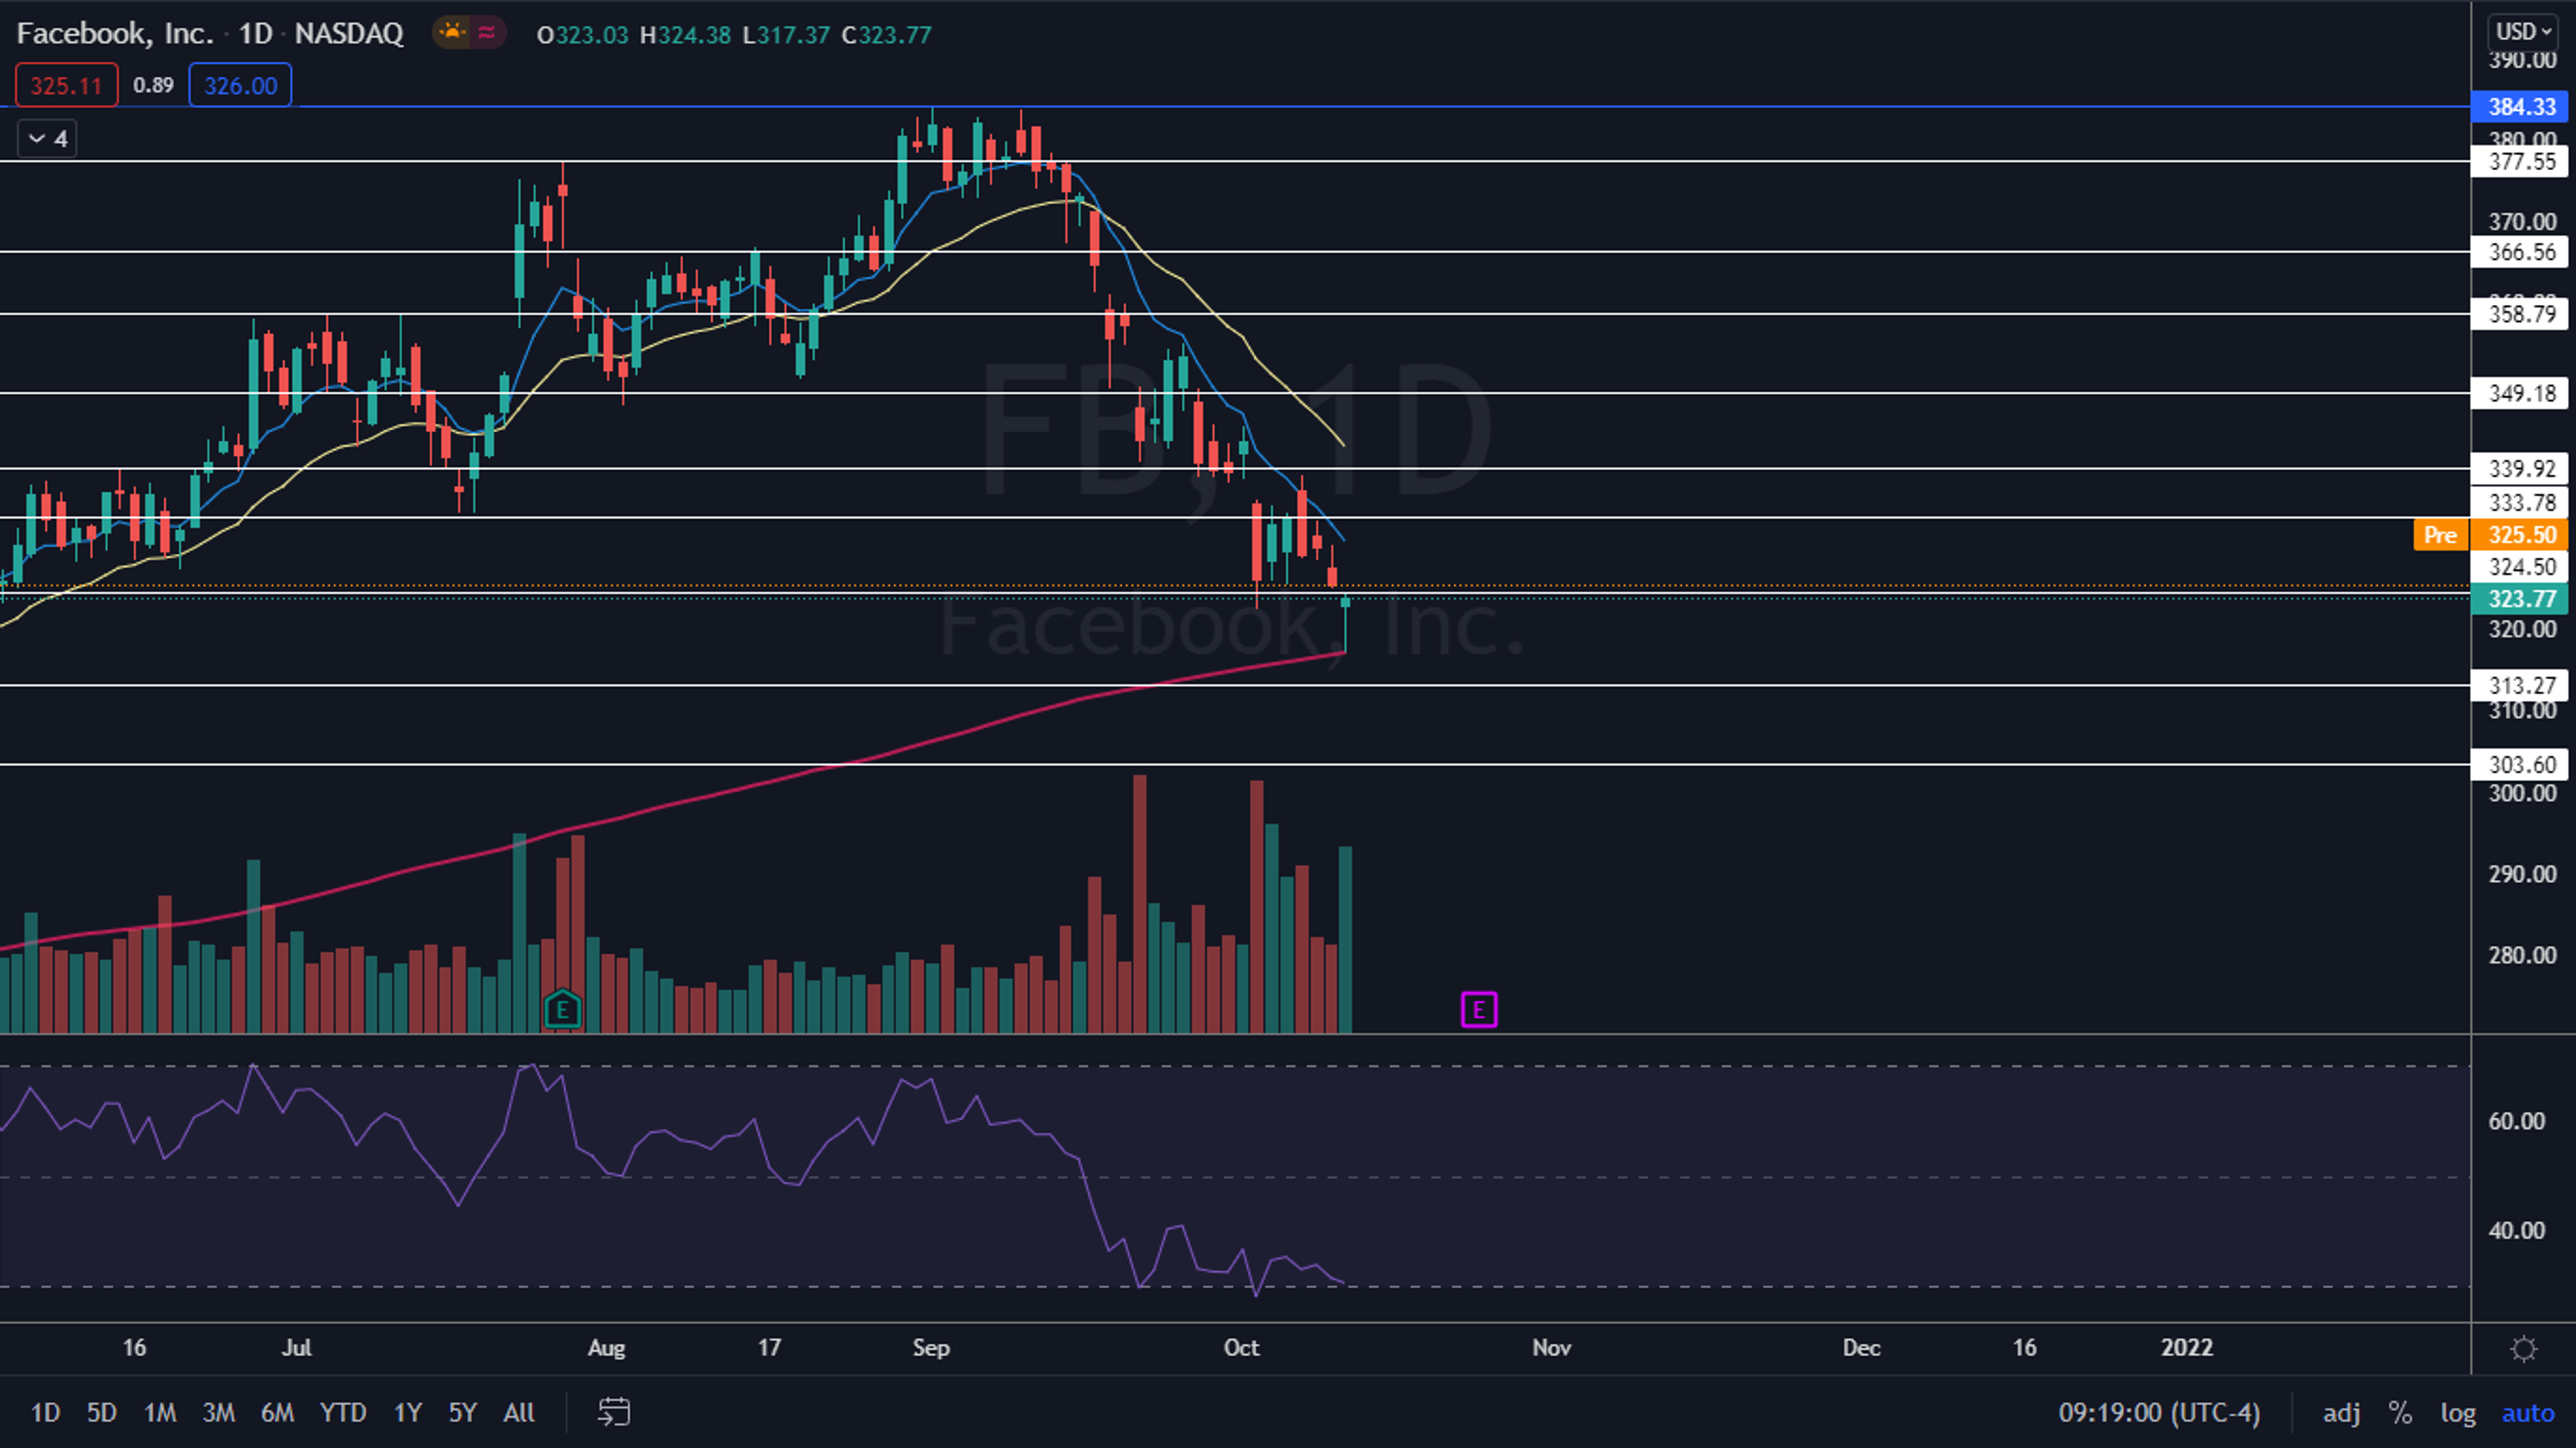
Photo: Thought Catalog from Pexels
© 2025 Benzinga.com. Benzinga does not provide investment advice. All rights reserved.