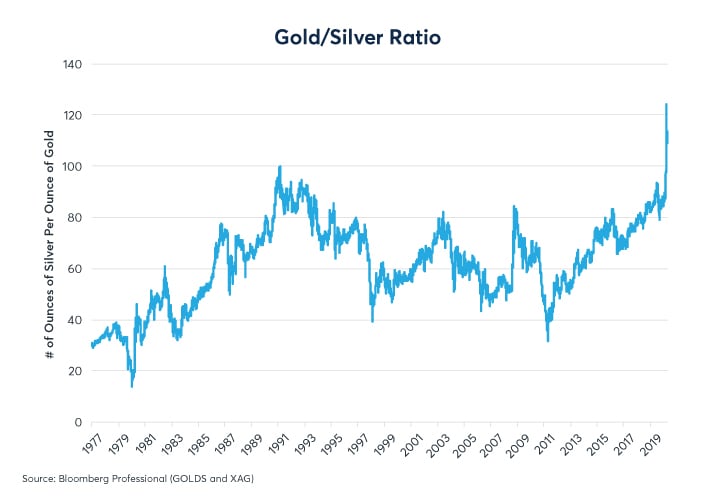
Figure 1: The Gold-Silver Ratio Has Gone To Unprecedented Levels
The answer to this question lies in the starkly different economic underpinnings of the two metals. The differences rarely show up in their day-to-day movements, but the rolling one-year correlation between the two has remained remarkably high during the past few years (Figure 2) even as their price levels, which moved in tandem from 2000 to 2011, have diverged (Figure 3).

Figure 2: Even As The Gold-Silver Ratio Has Risen, Day-To-Day Correlation Remain High

Figure 3: Gold And Silver Price Levels Moved In Tandem Before Diverging In 2011

In fact, correlations on a day-to-day basis between the two metals have been much higher in recent years than they were between the mid-1980s and the mid-2000s. Rather, silver’s underperformance has been a slow, steady drip, not rising as much as gold, on average, during rallies, and falling more than gold on down days. Only rarely have the metals decorrelated.
Silver’s underperformance relative to gold can be explained by a number of macro-economic factors:
- Fabrication demand: there are important differences in how the metals are used
- The COVID-19 pandemic has very different implications for the two metals
- Central bank activity: gold is a reserve asset and silver (typically) is not
Fabrication Demand: Mirror, Mirror On The Wall, Which Is The Most Precious Metal Of All?
Judging from market prices, the answer is palladium, which costs more per ounce than gold. That said, among the four “precious” metals of platinum, palladium, gold and silver, three of them are used heavily for industrial purposes. Platinum and palladium find extensive use in the automotive industry as catalytic converters. Silver is also used heavily in industrial processes.
Gold is mainly used in two ways: jewelry and as a store of value. In 2019, 76% of the net new gold supply (mining production + secondary recovery minus central bank buying) went into making jewelry. Ten percent was purchased by private investors as official coins, bullion or medallions. Only 14% went to industrial use (Figure 4). Jewelry is arguably a form of investment as well, being simultaneously an item of beauty and a store of wealth.
Figure 4: Gold’s Use Is Overwhelmingly (about 86%) For Jewelry And Investment; 14% Is Industrial

For silver, the investment versus industrial use is flipped the other way. In 2019, only 32% of the net new supply of silver was used for jewelry or investment, 68% was for electronic, industrial or dental uses (Figure 5). Moreover, net private investment for silver was negative from the late 1980s until about 2016, in stark contrast with gold, where net private investment has remained consistently positive for every year since 1996.
Figure 5: Silver Is Classified As Precious But It Is Mostly An Expensive Industrial Metal

Moreover, a deeper dive into silver’s industrial uses reveals other reasons for its underperformance. Twenty years ago, 266 million ounces, over one-quarter of mining production, were used to develop photographs. With the advent of digital photography, that number has shrunk to 53 million ounces in 2020, and has been falling at a pace of 4-5% per year recently.
Nothing else has fully replaced this demand. Silver is used in the making of solar panels but this source of demand peaked just short of 100 million ounces in 2018 and will likely shrink to about 79 million ounces this year. Likewise, its use in electronics and batteries grew until 2018, but has since begun to shrink (Figure 6). The COVID-19 induced global recession could dent industrial demand.
Figure 6: Photographic Demand For Silver Has Fallen 80% Since 2000

Perhaps the good news for silver is that traditional photography can only die once. If the 80% decline in its use for photographic development since 2000 has been a major drag on the price of silver, at least it’s now mostly in the past. The question for silver is does it find more uses going forward? The answer to that question is unclear. However, the decline of traditional photography and silver’s use in industry explains to a large extent the slow, steady nature of its decline versus gold.
Implications Of The Pandemic
The COVID-19 pandemic has had a very different impact on gold v. silver. Gold benefitted disproportionately from the Federal Reserve (Fed) slashing rates to near zero. Of the two metals, gold is the more negatively sensitive to changes in interest rate expectations. In the 12 months between March 2019 and February 2020, gold had a -0.55 correlation with daily changes in the anticipated Fed fund rates two years forward. Silver’s correlation was weaker at -0.39 (Figure 7). Given that gold is more negatively sensitive to changes in anticipated Fed policy, perhaps it’s not too surprising that gold investors have reaped most of the benefits of the Fed’s return to near-zero rates.
Figure 7: Gold Responds More Negatively To Changes In Anticipated Fed Funds Than Silver

The good news for silver, relative to gold, is that the Fed appears unlikely to cut rates further. The negative-rates experience of Europe and Japan hasn’t been encouraging. Even before their world heard of COVID-19 in Q4 2019, their economies were already shrinking after years of negative interest rates. If the Fed keeps rates near zero for the next several years, as Fed funds futures currently price, this doesn’t really benefit gold over silver (Figure 8). Moreover, if the US has a strong economic recovery and the Fed begins to ponder rate hikes, the history of the precious metals-Fed funds correlation suggests that this would likely be more negative for gold than silver.
Figure 8: If Fed Sticks To Near Zero-Rates, It Could Remove A Source Of Gold’s Outperformance

Industrial activity also plunged as a result of the pandemic. In the first quarter of 2020, China’s growth contracted by nearly 7%, its first negative quarter since at least the 1970s. Although China gradually restarted its economy in late March, the sharp contraction in consumer spending globally as a result of the pandemic remains a threat to China’s exports.
Like most commodities, silver has a strong, positive correlation with an industrially focused measure of China’s economic growth called the Li Keqiang Index. The index focuses on the volume of rail freight, quantity of electricity consumption and the number of bank loans. In Figure 9, we show the correlation between the year-on-year change in the Li Keqiang Index and the prices of various commodities one year later. For silver, that correlation is +0.33. For gold, it is -0.03 (Figure 9). This suggests that silver is somewhat disadvantaged by the slowing industrial growth in China and elsewhere caused by the pandemic, whereas slowing industrial growth has little overall effect on gold. Unlike official GDP, the Li Keqiang measure hasn’t showed negative year-on-year growth (Figure 10). That said, it has slowed to its weakest pace of growth since 2015, which was followed by a difficult period for silver and most other commodities.
Figure 9: Gold Correlates Negatively With Chinese Growth, Silver Positively
Figure 10: China’s Economy Has Slowed Sharply By Almost Any Measure


Silver has a weak correlation with China’s overall GDP. By contrast, gold is the only commodity whose prices have a strongly negative correlation with China’s official GDP. Since 2005, when China’s GDP slows, more often than not, gold prices have risen in the next year.
Central Banks
With China, the US, Europe, and Japan's government budget deficits expanding rapidly, monetary policy has taken a turn towards Modern Monetary Theory (MMT). It’s hard to say if this will weaken the dollar versus the renminbi, the renminbi versus the yen, or the yen versus the euro. What the combination of extremely large budget deficits and unprecedented monetary easing measures may do is weaken fiat currencies as a group versus “real assets” like gold and silver.
In the early stages of the US quantitative easing (QE) programs from 2009 to 2014, gold and silver benefitted from the perception that those programs might lead to higher rates of inflation. By 2011, however, it had become apparent that inflation rates were not rising in the face of significant excess capacity in the labor market. Gold and silver prices peaked that fall and began declining more than a year-and-a-half before the Fed announced the tapering of QE in May 2013. Once the tapering began, the central bank’s balance sheet stabilized and gold and silver prices plunged further.
This is a cautionary episode to those who believe that the current, different version of QE will cause precious metals prices to rise over the long term. While it’s true, this time the Fed and other central banks are going lower in credit quality than they did in previous rounds of quantitative easing, the Bank of Japan did the same starting in 2013, even going so far as to buy equity ETFs, without sparking inflation.
The economic impact of the pandemic is above all a demand shock. High rates of unemployment and underutilized production capacity could keep a lid on consumer price inflation for a long time. Price changes in 2020 could be negative in many developed countries. Will short-term deflation diminish gold’s value as an inflation hedge?
In the long term, if central banks and governments running large deficits aren’t weaned from QE measures, it could spark inflation. Additionally, measures to localize production and reduce reliance on international supply lines could prove inflationary. Silver, and especially gold, are caught between the short-term deflationary implications of the pandemic and its possible long-term inflationary consequences.
In addition to the largely indirect effects of QE, central banks also directly impact gold prices through their reserve operations. Since 2009, central banks have been net buyers of gold and they have stepped up their buying since 2015. Many emerging market central banks began buying gold in 2009, the same year that the Fed and the Bank of England inaugurated their QE programs (Figure 11). QE didn’t cause a loss of confidence in fiat currency as some feared but emerging market central banks responded to QE in Europe, US and Japan by diversifying their holdings into gold. China increased its gold holdings by 57% during the Fed’s QE1-QE3 period from 2009 to 2014.
Figure 11: Central Bank Buying May Have Supported Gold Prices During The 2010s
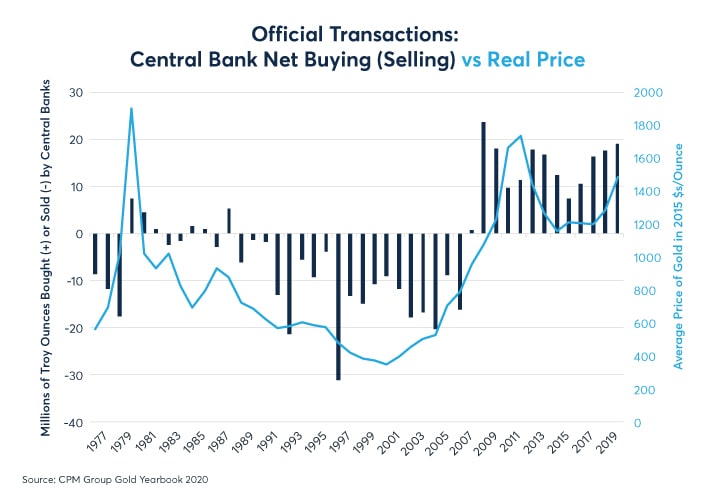
Central bank buying of gold also explains to some extent why gold has outperformed silver to such a great extent. Central banks own over one-fifth of all gold ever mined. They own very little silver. As such, central bank buying of gold directly impacts gold’s price. Meanwhile, it has only an indirect impact on silver: as the price of gold rises, some buyers of gold jewelry will be priced out of the market and may opt for more affordable silver instead.
Finally, central bank buying of gold in the past decade can be attributed almost entirely to central banks in emerging markets. With China’s trade surplus now evaporating, its foreign reserves may begin to decline. If so, that might curb further gold purchases. Also, Russia and other commodity exporters might not have the revenues to purchase much more gold no matter how uncomfortable they feel with the direction of monetary and fiscal policies in Europe and the US. If anything, many of the commodity producers might shed currency reserves to defend the value of their currencies. That doesn’t necessarily imply selling gold. Gold is only 12.5% of the value of global central bank reserves. That said, some of the countries that were in a position to buy more gold during the 2010s when commodity prices were high may no longer be in a position to do so in the 2020s. If central banks cease buying large amounts of gold, the gold-silver ratio could revert to historical norms.
Bottom Line
- The gold-silver ratio has gone to unprecedented levels
- Silver is a hybrid industrial-precious metal
- Gold has fared better than silver during the pandemic
- Central bank policies have also had a strong impact
To learn more about options, go to Benzinga’s futures and options education resource.
© 2025 Benzinga.com. Benzinga does not provide investment advice. All rights reserved.
Trade confidently with insights and alerts from analyst ratings, free reports and breaking news that affects the stocks you care about.

