Benzinga

España
Italia
대한민국
日本
Français
Benzinga Edge
Benzinga Research
Benzinga Pro

  • Get Benzinga Pro
  • Data & APIs
  • Events
  • Premarket
  • Advertise
Contribute
España
Italia
대한민국
日本
Français

Benzinga

  • Premium Services
  • Financial News
    Latest
    Earnings
    Guidance
    Dividends
    M&A
    Buybacks
    Interviews
    Management
    Offerings
    IPOs
    Insider Trades
    Biotech/FDA
    Politics
    Healthcare
    Small-Cap
  • Markets
    Pre-Market
    After Hours
    Movers
    ETFs
    Options
    Cryptocurrency
    Commodities
    Bonds
    Futures
    Mining
    Real Estate
    Volatility
  • Ratings
    Analyst Color
    Downgrades
    Upgrades
    Initiations
    Price Target
  • Investing Ideas
    Trade Ideas
    Long Ideas
    Short Ideas
    Technicals
    Analyst Ratings
    Analyst Color
    Latest Rumors
    Whisper Index
    Stock of the Day
    Best Stocks & ETFs
    Best Penny Stocks
    Best S&P 500 ETFs
    Best Swing Trade Stocks
    Best Blue Chip Stocks
    Best High-Volume Penny Stocks
    Best Small Cap ETFs
    Best Stocks to Day Trade
    Best REITs
  • Money
    Investing
    Cryptocurrency
    Mortgage
    Insurance
    Yield
    Personal Finance
    Forex
    Startup Investing
    Real Estate Investing
    Prop Trading
    Credit Cards
    Stock Brokers
Research
My Stocks
Tools
Free Benzinga Pro Trial
Calendars
Analyst Ratings Calendar
Conference Call Calendar
Dividend Calendar
Earnings Calendar
Economic Calendar
FDA Calendar
Guidance Calendar
IPO Calendar
M&A Calendar
Unusual Options Activity Calendar
SPAC Calendar
Stock Split Calendar
Trade Ideas
Free Stock Reports
Insider Trades
Trade Idea Feed
Analyst Ratings
Unusual Options Activity
Heatmaps
Free Newsletter
Government Trades
Perfect Stock Portfolio
Easy Income Portfolio
Short Interest
Most Shorted
Largest Increase
Largest Decrease
Calculators
Margin Calculator
Forex Profit Calculator
100x Options Profit Calculator
Screeners
Stock Screener
Top Momentum Stocks
Top Quality Stocks
Top Value Stocks
Top Growth Stocks
Compare Best Stocks
Best Momentum Stocks
Best Quality Stocks
Best Value Stocks
Best Growth Stocks
Connect With Us
facebookinstagramlinkedintwitteryoutubeblueskymastodon
About Benzinga
  • About Us
  • Careers
  • Advertise
  • Contact Us
Market Resources
  • Advanced Stock Screener Tools
  • Options Trading Chain Analysis
  • Comprehensive Earnings Calendar
  • Dividend Investor Calendar and Alerts
  • Economic Calendar and Market Events
  • IPO Calendar and New Listings
  • Market Outlook and Analysis
  • Wall Street Analyst Ratings and Targets
Trading Tools & Education
  • Benzinga Pro Trading Platform
  • Options Trading Strategies and News
  • Stock Market Trading Ideas and Analysis
  • Technical Analysis Charts and Indicators
  • Fundamental Analysis and Valuation
  • Day Trading Guides and Strategies
  • Live Investors Events
  • Pre market Stock Analysis and News
  • Cryptocurrency Market Analysis and News
Ring the Bell

A newsletter built for market enthusiasts by market enthusiasts. Top stories, top movers, and trade ideas delivered to your inbox every weekday before and after the market closes.

  • Terms & Conditions
  • Do Not Sell My Personal Data/Privacy Policy
  • Disclaimer
  • Service Status
  • Sitemap
© 2026 Benzinga | All Rights Reserved
September 3, 2017 12:02 PM 4 min read

How Past Summer Storms Impacted Gas Prices The Following Month

by Shanthi Rexaline Benzinga Editor
Follow
USO Logo
USOUnited States Oil Fund
$75.15-5.50%
Overview

Even as Texas reels under the impact of Harvey and the markets mull over the ramification of the catastrophe on the local and national economy, news of soaring gasoline prices, which rose to a two-year high, set alarm bells ringing.

RBOB, or reformulated blend stock for oxygenated blending, gasoline futures for September delivery settled Wednesday's session at $1.885, up 10.1 cents, the highest level since July 21, 2015.

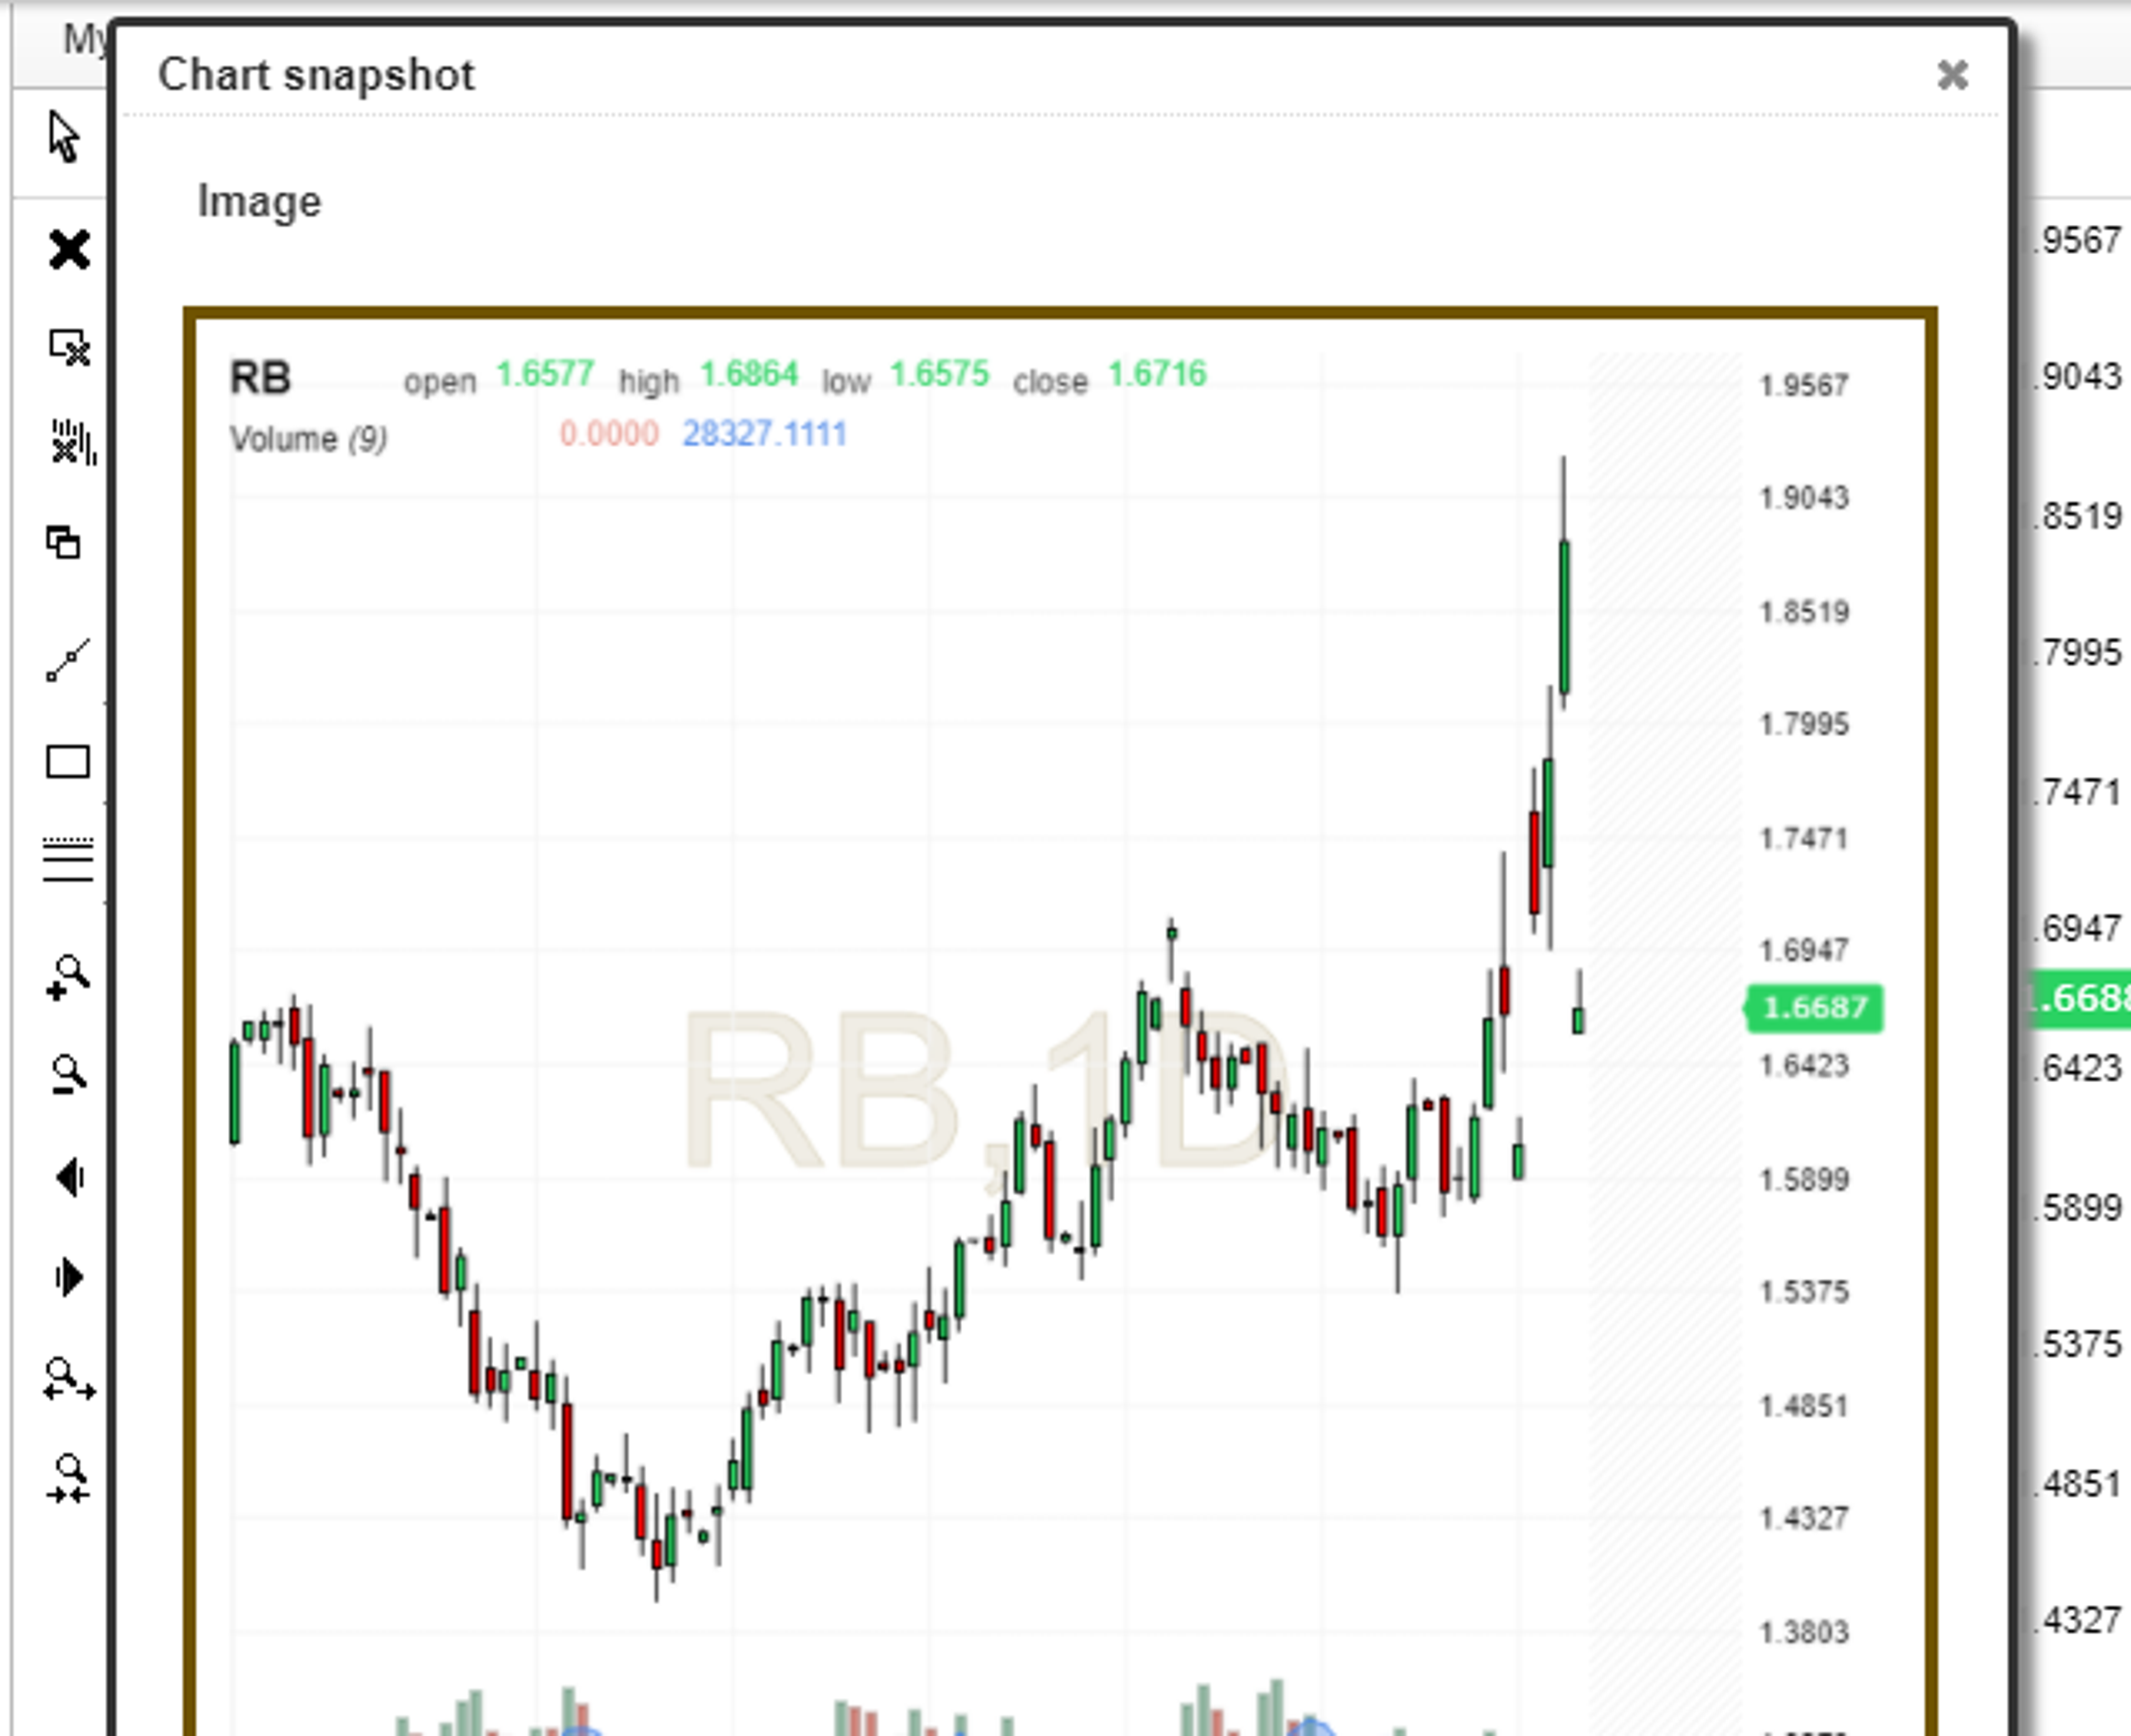
The most actively traded October futures gained 3.6 cents to $1.638.

Source: Investing.com

Up And Down Anomaly

Ironically, the direction of crude oil prices and gasoline has diverged. Analysts explained the anomaly by suggesting that oil price was reacting to the weekly Petroleum Status report from the Energy Information Administration, which showed an increase in oil production.

Another logic is that as several refineries (roughly over 20 percent of the U.S. refineries) went offline, both as a precautionary measure and due to storm damage, crude oil stockpiles are expected to run high in the coming days. Gasoline is a refined form of crude oil and any reduction in refining could bloat up crude oil inventory.

Related Link: How Much Of A Spending Boost Are Cheap Gas Prices?

Retail Gas Prices React

Prices at the pump have also ticked higher, with the nationwide average unleaded gas price rising 4.7 cents to $2.451/gallon as of 3:55 a.m. Thursday, according to GasBuddy. Prices were up 10.3 cents from last week's average and 22.9 cents higher than last year's average.

The irony here is that pump prices remained non-reactive during the summer driver season this year despite the premise that surging demand during the season would drive prices higher.

To assess the impact of Harvey one month down the line, Benzinga looked at the historical reaction of gas prices to tropical storms and hurricanes. This could give a rough idea as to where gas prices headed in the near term.

For the purpose of analysis, those storms categorized 3 and higher on the Saffir-Simpson Hurricane Wind scale and those that happened after 1985 were considered. The futures data pertained to contract 1 of New York Harbor Regular Gasoline future.

Here's the list of the study universe, along with the date of closest approach and the returns over a month from the date:

Category 5

  • Andrew (Aug. 24, 1992): -6.2 percent.

Category 4

  • Hugo (Sept. 22, 1988): +9 percent.
  • Charley (Aug. 13, 2004): -11 percent.

Category 3

From the above data, roughly one-third of the time (66 percent), gas prices move higher. The average return has been 1.4 percent.

Within six months of the catastrophes, prices were higher 63.5 percent of the time, with the average gain at 8.4 percent.

Historical data dating back to 15 years showed that natural gas spot prices were higher 58.6 percent of the time after a Category 4 or higher hurricane strikes, with the average gain at 7 percent. Five months down the line, gasoline spot prices were higher 58.6 percent of the time, with the average gain at 8.9 percent.

Though history is an indicator, what could also dictate the price move are the severity of damage and other macroeconomic variables, which dictate how soon things can return to normalcy.

_______

Market News and Data brought to you by Benzinga APIs

© 2026 Benzinga.com. Benzinga does not provide investment advice. All rights reserved.


Posted In:
NewsEducationCommoditiesEventsTop StoriesMarketsTrading IdeasGeneralGasBuddyHurricanesLPL Research
  • Elena (Sept. 2, 1985): +3.7 percent.
  • Gloria (Sept. 27, 1985): -0.61 percent.
  • Emily (Aug. 31, 1993): -0.4 percent.
  • Opal (Oct. 4, 1995): +0.6 percent.
  • Fran (Sept. 6, 1996): +1.5 percent.
  • Bret (Aug. 23, 1999):+8.3 percent.
  • Ivan (Sept.16, 2004): +10.1 percent.
  • Jeanne (Sept. 26, 2004): +5 percent.
  • Dennis (July 10, 2005): +7.5 percent.
  • Katrina (Aug. 29, 2005): +9.3 percent.
  • Rita (Sept. 24, 2005): -26 percent.
  • Wilma (Oct. 24, 2005): +10.4 percent.

Meanwhile LPL Research said in a report released in October 2016 historical data going back 28 years showed that WTI crude oil spot prices tended to move higher over the short-term horizon after a Category 4 or higher hurricane generated from the Atlantic ocean makes a landfall in the U.S. One month later, Cushing crude oil spot price was higher 59.6 percent of the time, with average returns of 1.1 percent.

Image Credit: "U.S. Soldiers assigned to the Texas Army National Guard arrive in Houston to aid citizens in areas heavily flooded by the storms of Hurricane Harvey Aug. 27, 2017. (U.S. Army National Guard photo by 1st Lt. Zachary West) www.dvidshub.net" By U.S. Department of Defense Current Photos1st Lt. Zachary West/Texas Military Department - 170827-A-ZW944-024, Public Domain, via Wikimedia Commons

USO Logo
USOUnited States Oil Fund
$75.15-5.50%
Overview
Comments
Loading...