


Zinger Key Points
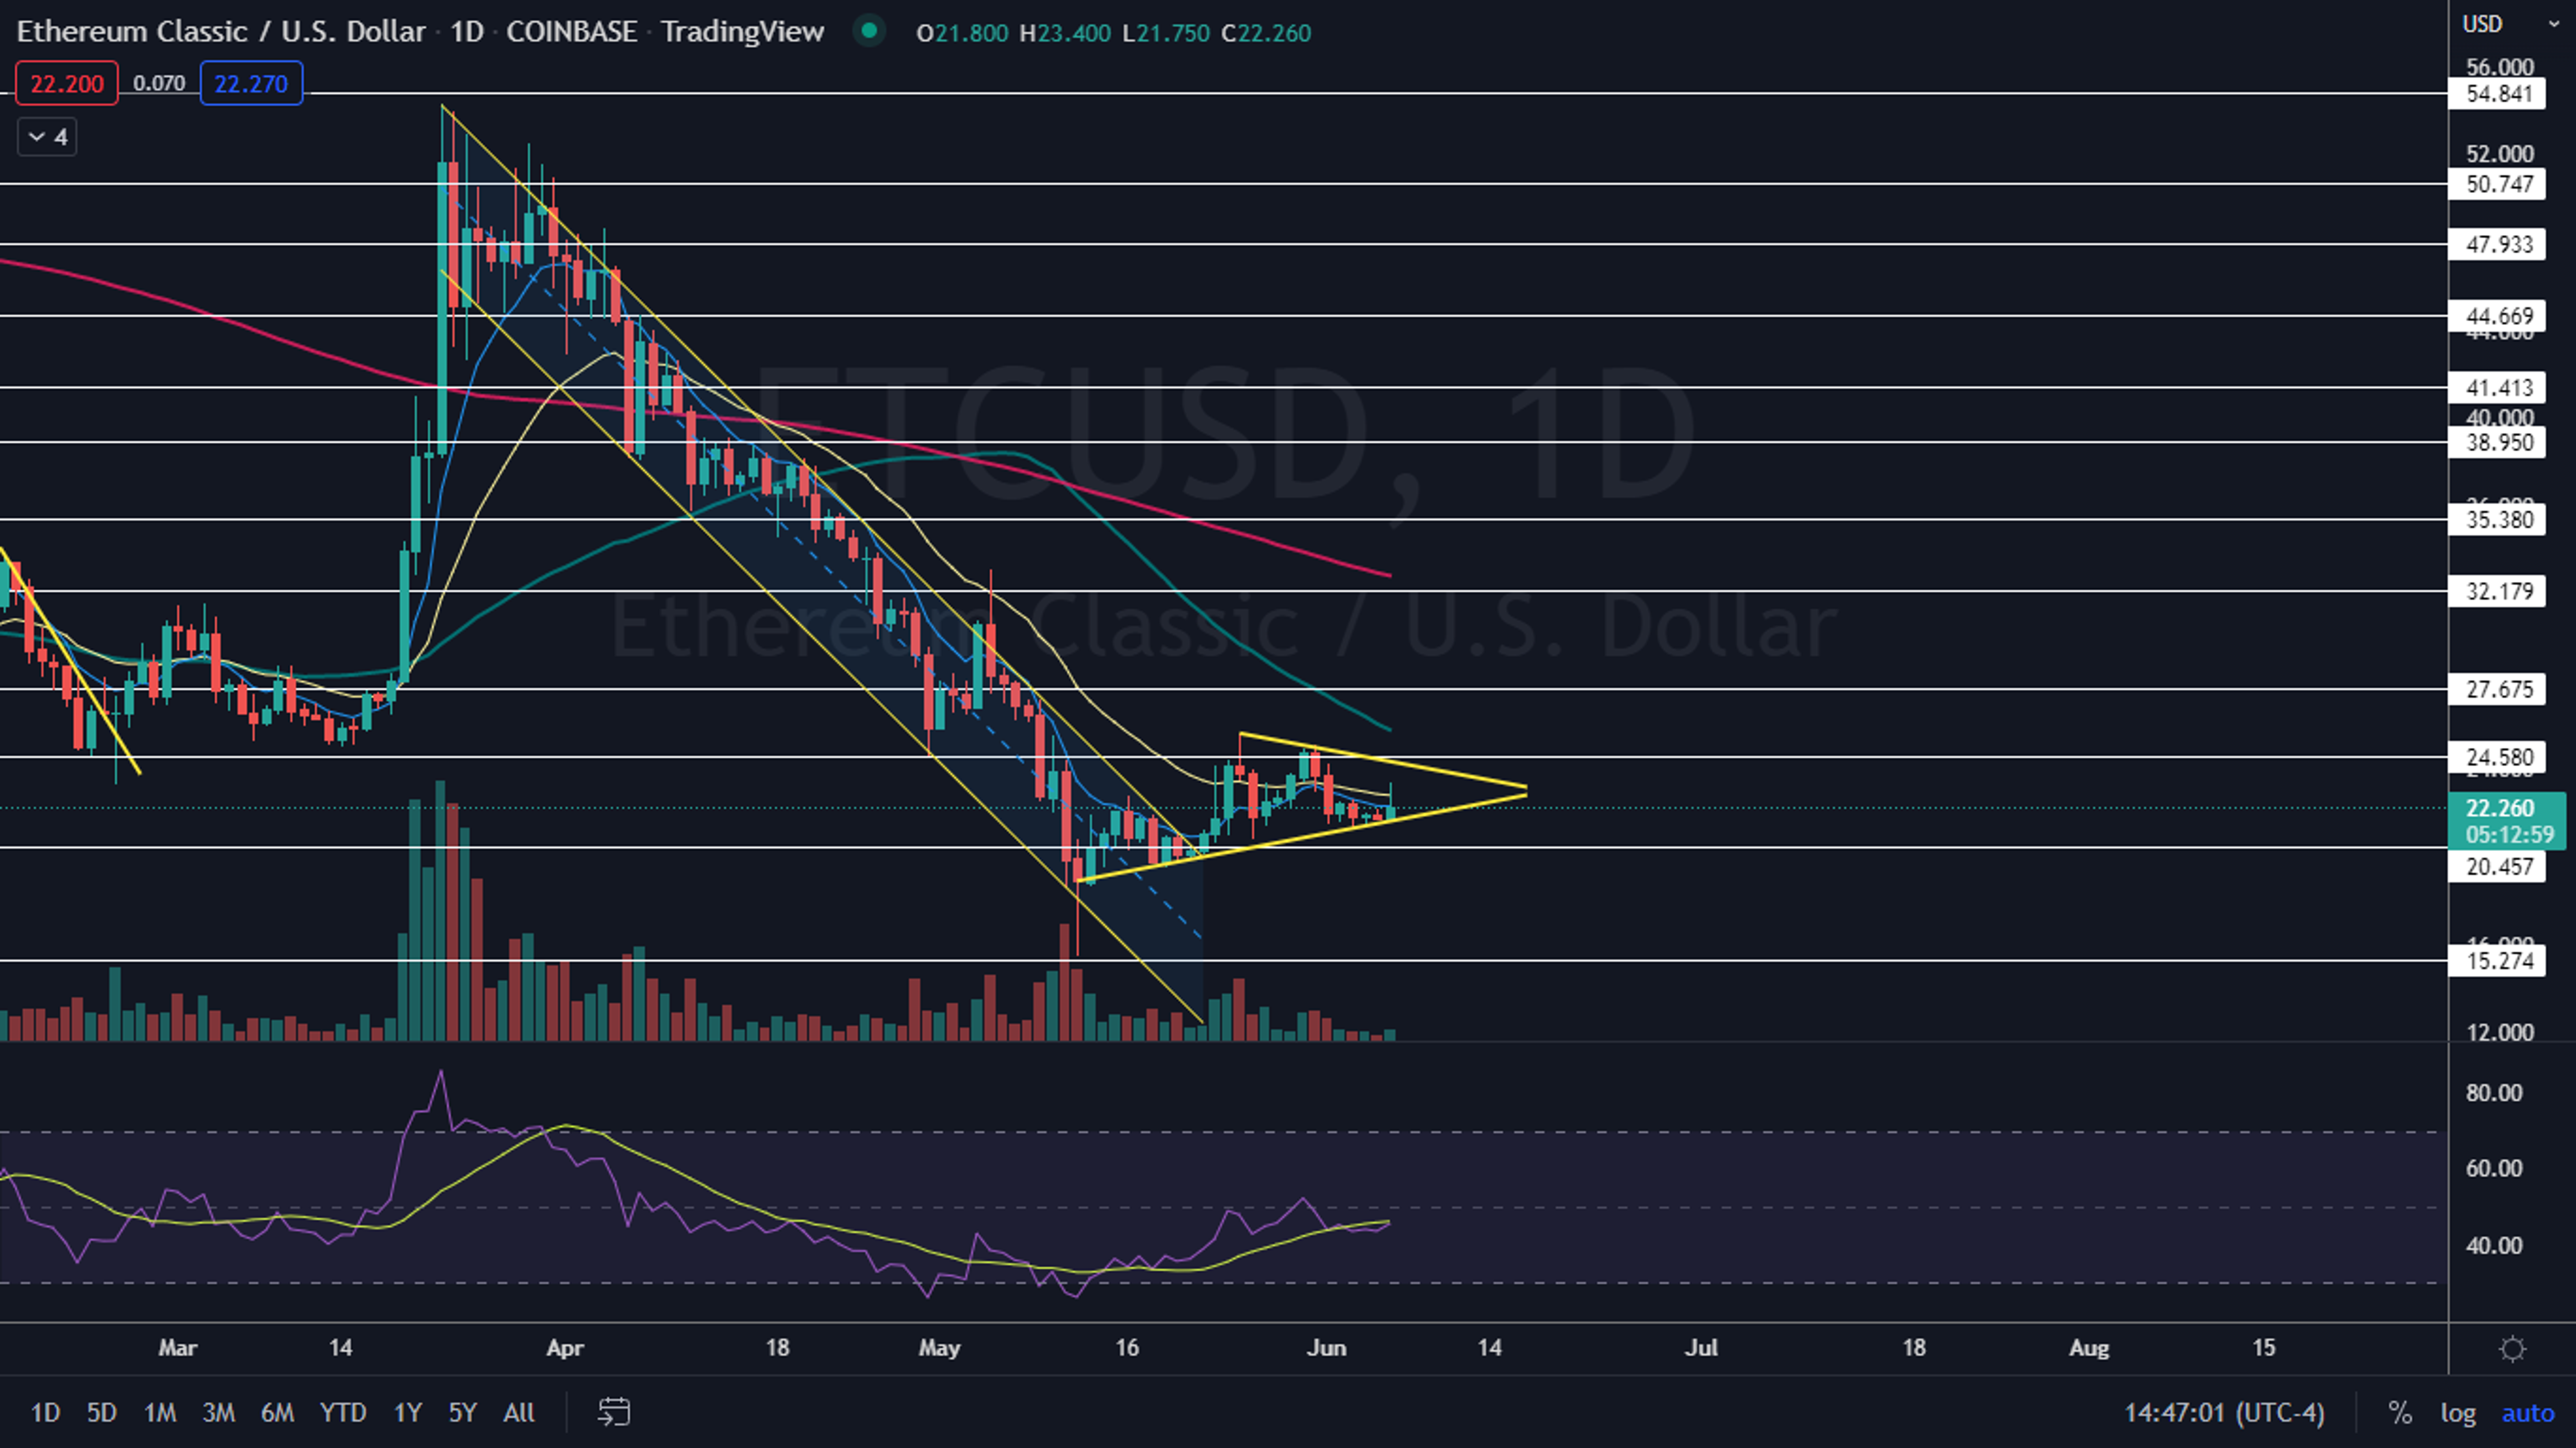
- Ethereum Classic has resistance above at $24.58 and $27.67 and support below at $20.45 and $15.27.
- Bullish traders want to see the crypto regain support at eight-day, 21-day EMAs.
- Get Matt Maley’s top trade setups for a tariff-driven market, live this Wednesday at 6 PM ET. Reserve your free spot now.
Ethereum Classic ETC/USD spiked up more than 7% higher between 8 p.m. on Sunday and 4 a.m. on Monday before entering into a downtrend on smaller timeframes.
The crypto has been trading in a tight sideways range between $19.50 and $25.63 since May 14, in tandem with Bitcoin BTC/USD and Ethereum ETH/USD, which have also offered traders little in terms of volatility.
The sideways trading pattern on lower-than-average volume has settled Ethereum Classic into a possible triangle pattern on the daily chart.
A symmetrical triangle pattern is created when a stock forms a series of lower highs and higher lows between a descending and an ascending trendline, which meet on the right side of the chart to form an apex. The pattern indicates the bulls and bears are equally in control.
A symmetrical triangle is often formed on lower-than-average volume and demonstrates a decrease in volatility, indicating consolidation. The decreasing volume is often followed by a sharp increase in volume when the stock breaks up or down from the pattern, which should happen before the stock reaches the apex of the triangle.
- Aggressive bullish traders may choose to purchase a stock in a symmetrical triangle when the security reverses course on the lower ascending trendline, with a stop set if the stock rejects at the upper descending trendline of the pattern. More conservative traders may wait for the stock to break up bullishly from the pattern on higher-than-average volume.
- Aggressive bearish traders may choose to trade opposite to the bulls, entering into a short position on a rejection of the upper descending trendline and covering the position if the stock finds support at the lower trendline. Opposite to the bulls, conservative bearish traders may wait for the stock to break down from the lower trendline on higher-than-average bearish volume.


Want direct analysis? Find me in the BZ Pro lounge! Click here for a free trial.
The Ethereum Classic Chart: Ethereum Classic’s symmetrical triangle formation began on May 25, but the crypto has been holding above the lower ascending trendline of the pattern since May 13, when Ethereum Classic began to reverse course from the long-term downtrend. On Monday, Ethereum Classic tested the bottom trendline of the pattern as support and held above it, giving further indication that pattern is being recognized.
- Ethereum Classic will reach the apex of the triangle about June 17 and traders and investors can watch for the crypto to break up or down from the pattern on higher-than-average volume before that date. Although Ethereum Classic’s volume increased slightly on Monday when compared to Sunday’s volume, it’s still measuring in below average at about 54,300 on Coinbase compared to the 10-day average of 77,787.
- Bullish traders want to see Ethereum Classic pop up above the eight-day and 21-day exponential moving averages (EMAs) and then for the crypto to gain the power to test the upper descending trendline of the triangle as resistance.
- Bearish traders want to see Ethereum Classic drop down through the bottom trendline of the triangle on higher-than-average bearish volume, which could indicate the crypto will enter into another downtrend. Each time Ethereum Classic tests the lower trendline as support, the area weakens.
- Ethereum Classic has resistance above at $24.58 and $27.67 and support below at $20.45 and $15.27.

See Also: Why Bitcoin (BTC), Dogecoin (DOGE) Are Mixed Today
Photo: Adisak Riwkratok via Shutterstock
Edge Rankings
Price Trend
© 2025 Benzinga.com. Benzinga does not provide investment advice. All rights reserved.
Trade confidently with insights and alerts from analyst ratings, free reports and breaking news that affects the stocks you care about.

