

- Bitcoin will meet the apex of its current triangle pattern on about June 5, with a likely break before that date.
- If the crypto breaks bearishly from the pattern, Bitcoin could plunge toward the $20,000 mark.
- Get ahead of Wall Street reactions—Benzinga Pro delivers signals, squawk, and news fast. Now 60% off this 4th of July.
Bitcoin BTC/USD was trading flat on Wednesday in a continued a sideways trading pattern between about $25,550 and $31,400, which has been holding the crypto in a triangle pattern since May 13.
The triangle pattern, paired with the 36% drop that took place between May 5 and May 12, has settled Bitcoin into a possible bear flag pattern on the daily chart.
The bear flag pattern is created with a steep drop lower forming the pole, which is then followed by a consolidation pattern that brings the stock higher between a channel with parallel lines or into a tightening triangle pattern.
- For bullish traders, the "trend is your friend" (until it's not) and the crypto may continue to rise upwards within the following channel for a short period of time. Aggressive traders may decide to purchase the digital currency at the lower trendline and exit the trade at the higher trendline.
- Bearish traders will want to watch for a downward break from the lower descending trendline of the flag formation, on high volume, for an entry. When a crypto breaks down from a bear flag pattern, the measured move lower is equal to the length of the pole and should be added to the highest price within the flag.
A bear flag is negated when an asset closes a trading day above the upper trendline of the flag pattern, or if the flag rises more than 50% up the length of the pole.
Want direct analysis? Find me in the BZ Pro lounge! Click here for a free trial.
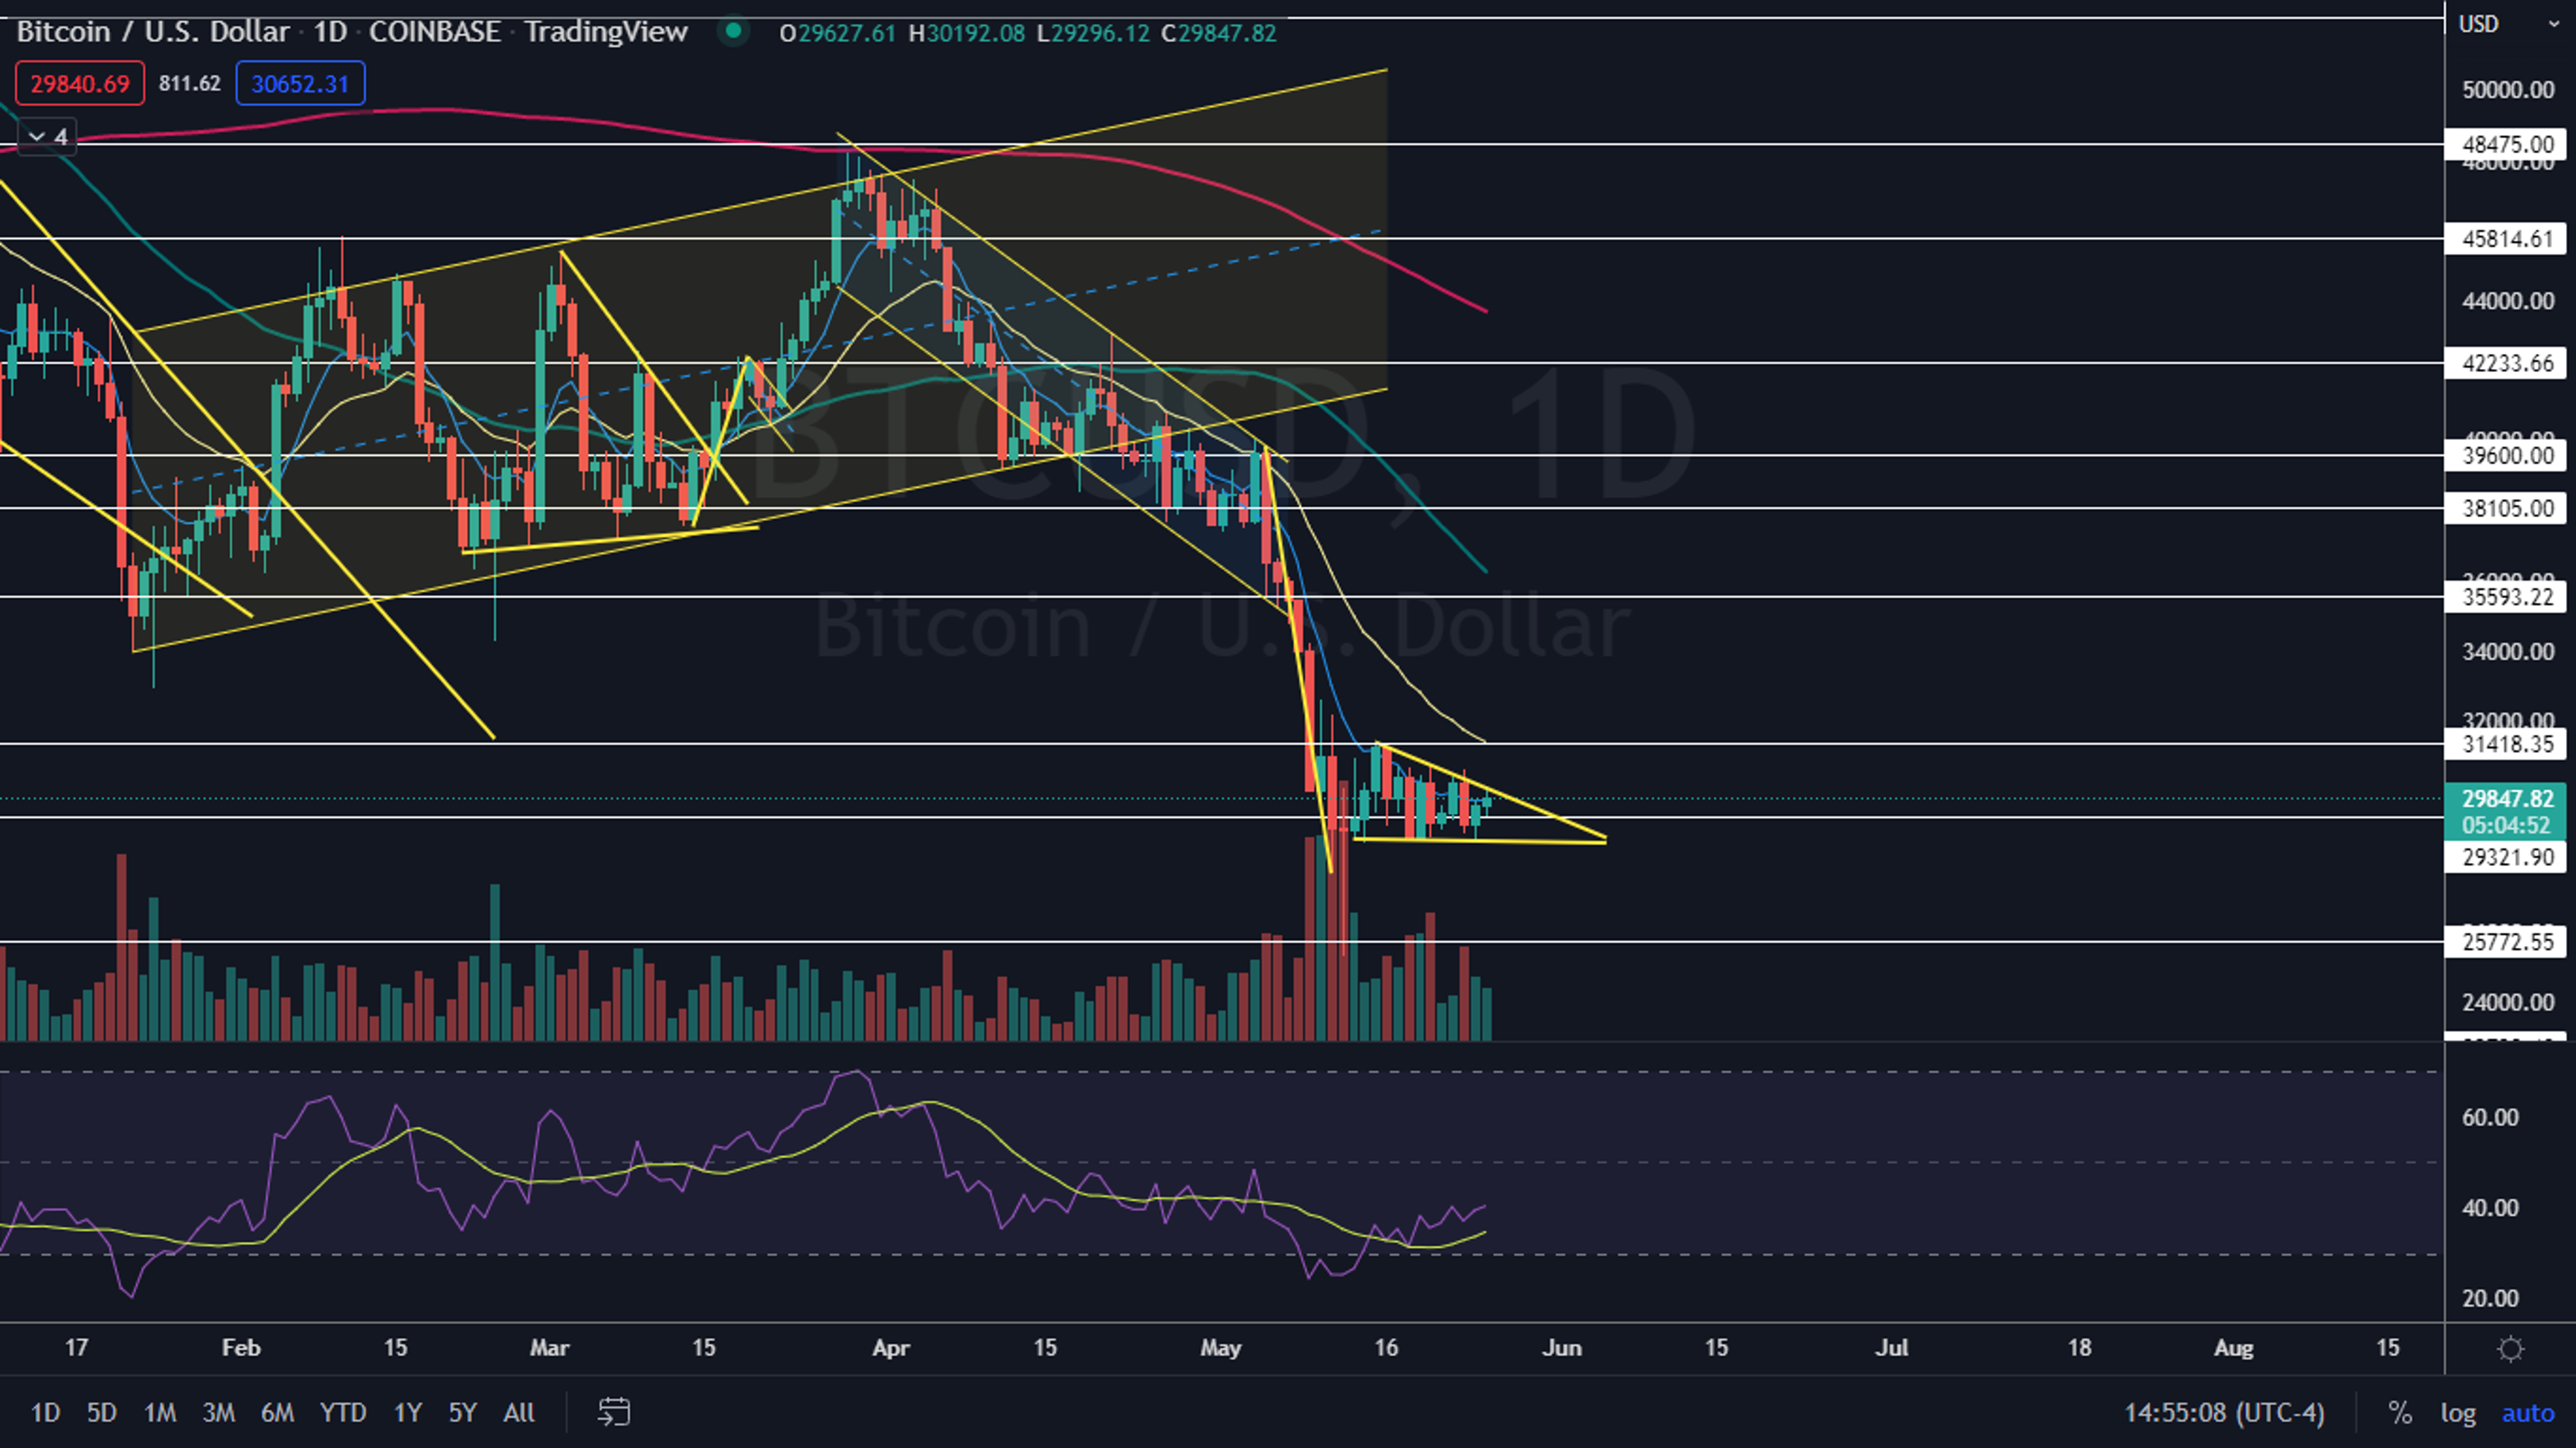
The Bitcoin Chart: On Wednesday, Bitcoin attempted to break up from the upper descending trendline of the triangular flag pattern, but rejected and wicked from the level. Bitcoin will meet the apex of the triangle on about June 5, which suggests the crypto should break up or down from the pattern before that date.
- Traders and investors can watch for Bitcoin to break from the triangle on higher-than-average volume to gauge future direction. If Bitcoin breaks up from the pattern, the bear flag will be negated. If the crypto breaks bearishly from the pattern, Bitcoin could plunge toward the $20,000 mark.
- Although the bear flag pattern is quite evident on the chart, Bitcoin is showing signs that if the bulls step in, the pattern could be negated because within the flag, Bitcoin has printed a sextuple bottom pattern. If the pattern is recognized, Bitcoin could break up through the flag.
- It should also be noted that the more times Bitcoin tests the lower horizontal trendline of the flag, the weaker the support level becomes, which is a positive for the bears.
- Bitcoin has developed exaggerated bullish divergence on the daily chart, which suggests the crypto may negate the flag before breaking down from the pattern. Exaggerated bullish divergence occurs when a stock’s lows are flat, but the relative strength index forms a series of higher lows.
- Bitcoin has resistance above at $31,418 and $35,593 and support below at $29,321 and $25,772.

Edge Rankings
Price Trend
© 2025 Benzinga.com. Benzinga does not provide investment advice. All rights reserved.