

Dave & Buster's Enter PLAY is preparing to release its quarterly earnings on Tuesday, 2024-04-02. Here's a brief overview of what investors should keep in mind before the announcement.
Analysts expect Dave & Buster's Enter to report an earnings per share (EPS) of $1.10.
The announcement from Dave & Buster's Enter is eagerly anticipated, with investors seeking news of surpassing estimates and favorable guidance for the next quarter.
It's worth noting for new investors that guidance can be a key determinant of stock price movements.
Earnings Track Record
During the last quarter, the company reported an EPS missed by $0.00, leading to a 4.41% increase in the share price on the subsequent day.
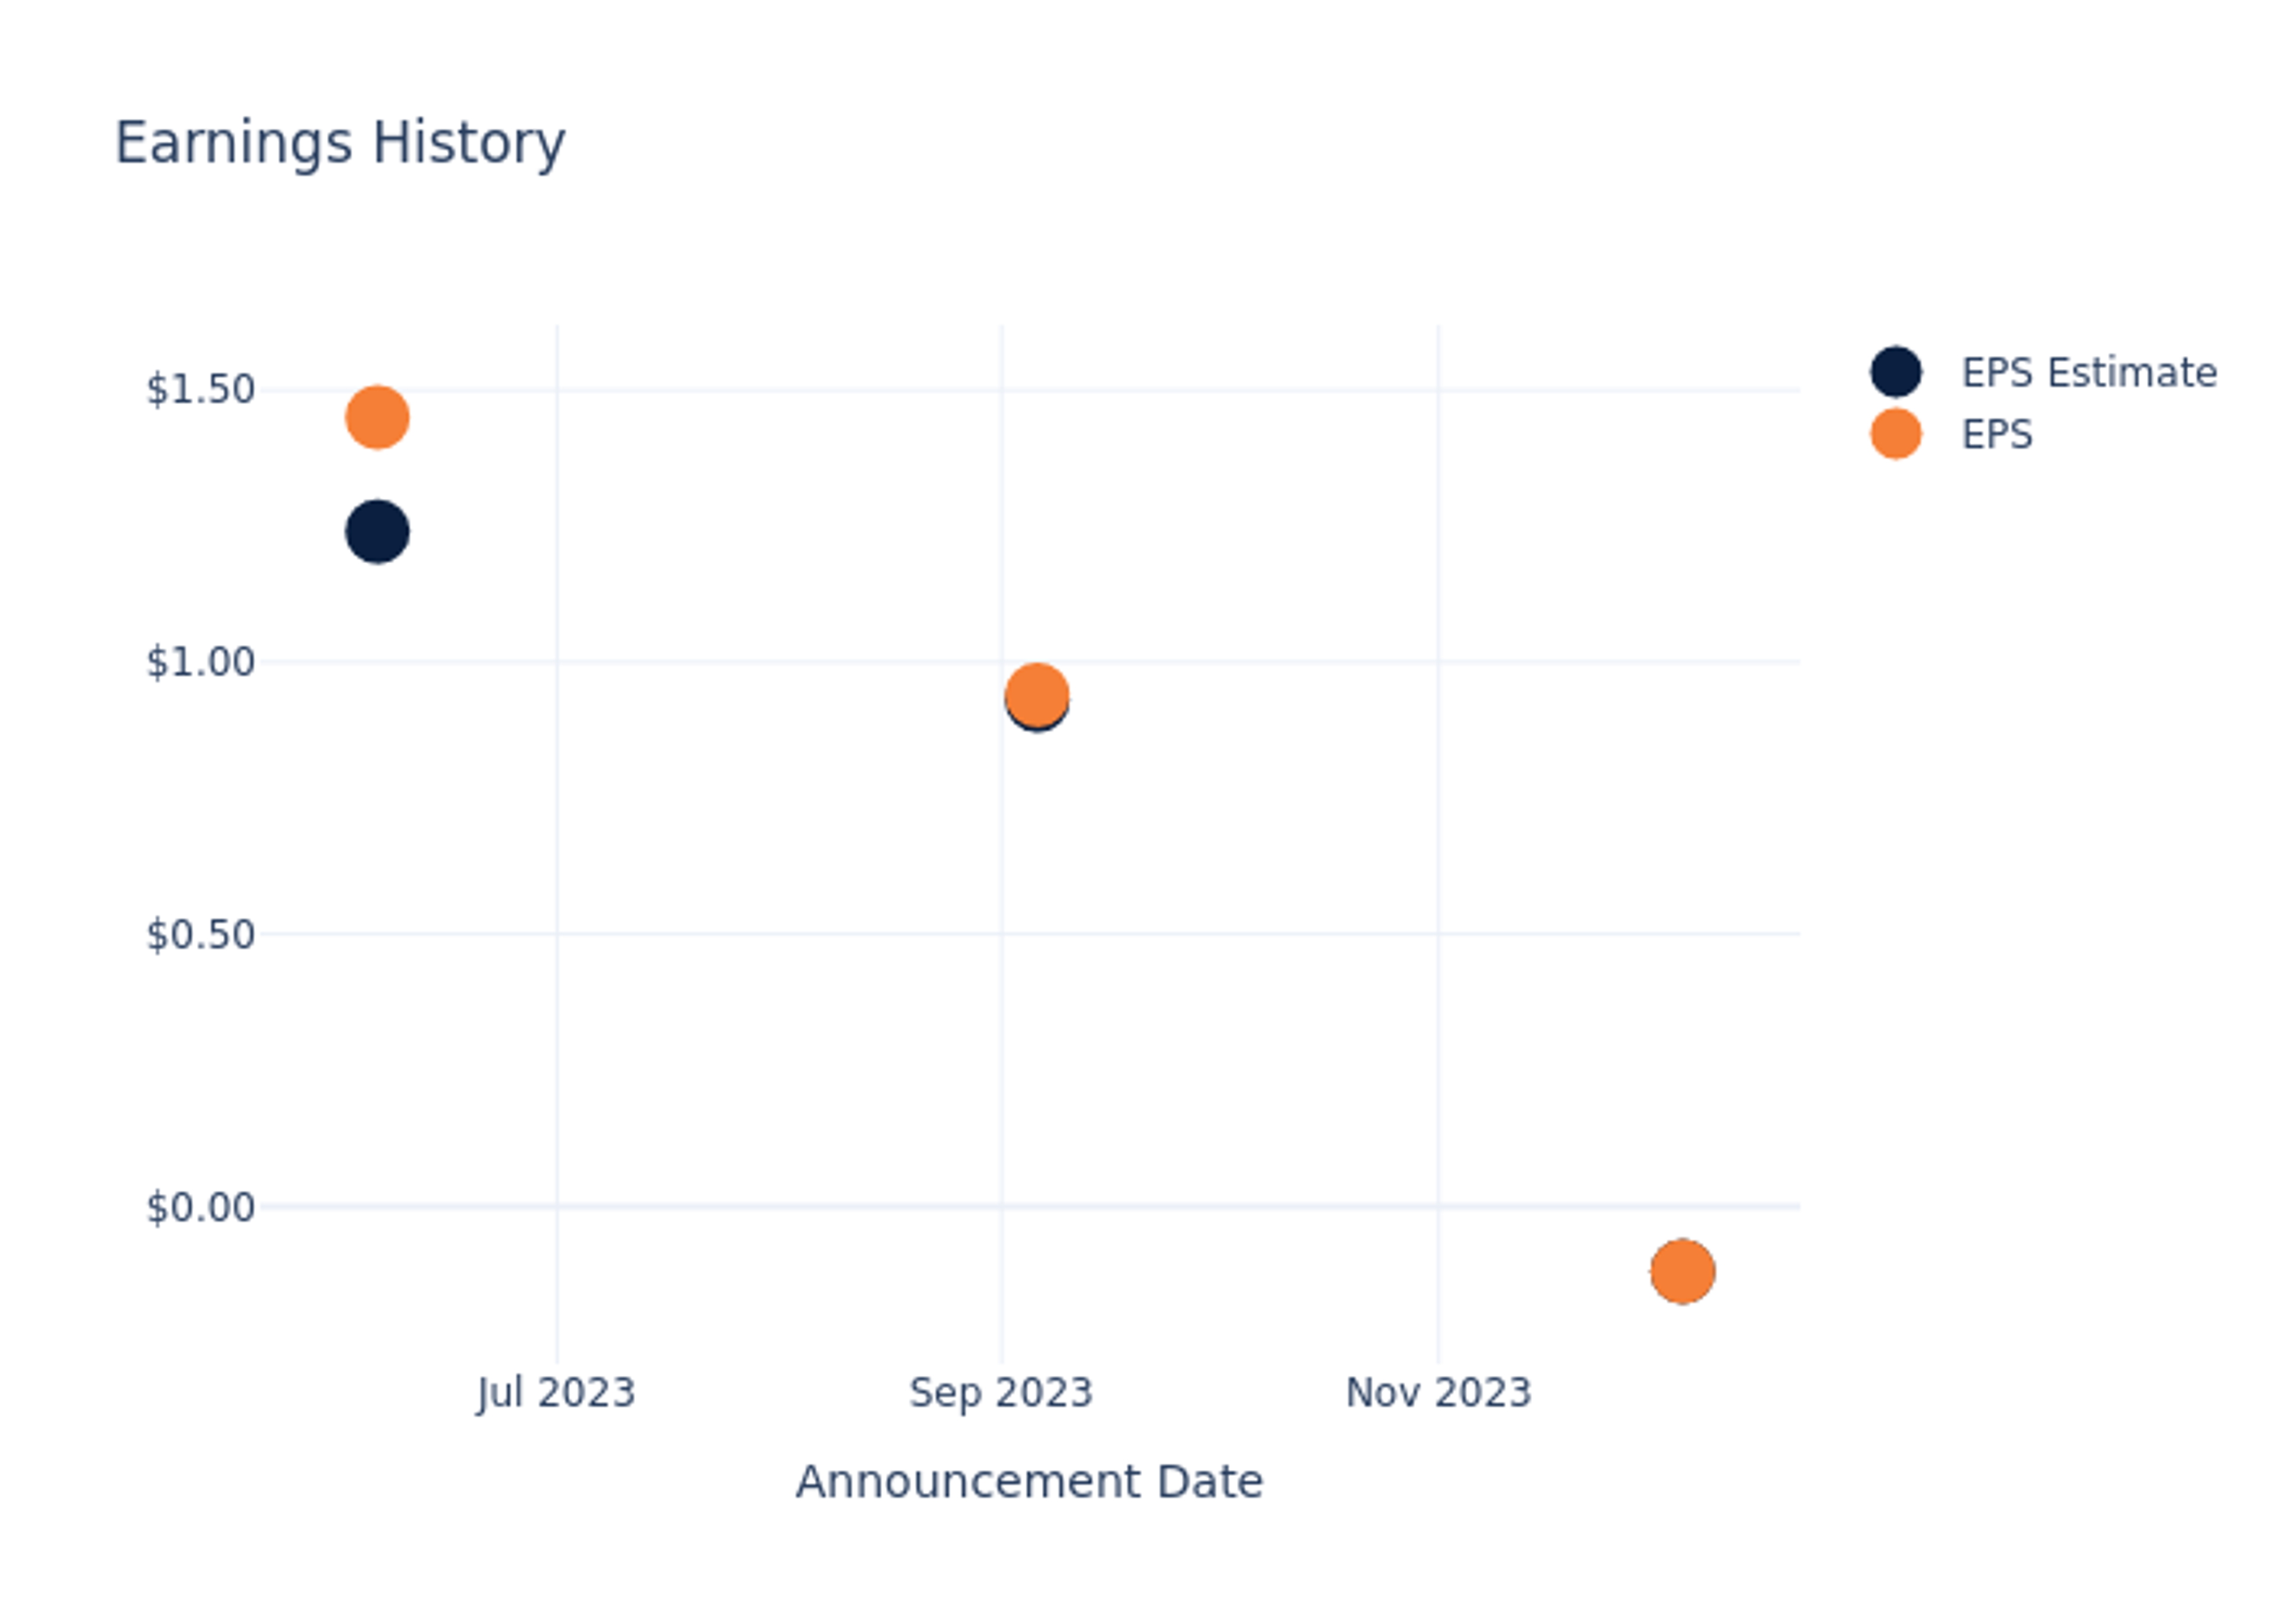
Here's a look at Dave & Buster's Enter's past performance and the resulting price change:
| Quarter | Q3 2023 | Q2 2023 | Q1 2023 | Q4 2022 |
|---|---|---|---|---|
| EPS Estimate | -0.12 | 0.93 | 1.24 | 0.73 |
| EPS Actual | -0.12 | 0.94 | 1.45 | 0.80 |
| Price Change % | 4.0% | -6.0% | 18.0% | 1.0% |

Tracking Dave & Buster's Enter's Stock Performance
Shares of Dave & Buster's Enter were trading at $62.6 as of March 29. Over the last 52-week period, shares are up 84.37%. Given that these returns are generally positive, long-term shareholders are likely bullish going into this earnings release.
Analyst Insights on Dave & Buster's Enter
Understanding market sentiments and expectations within the industry is crucial for investors. This analysis delves into the latest insights on Dave & Buster's Enter.
Analysts have given Dave & Buster's Enter a total of 3 ratings, with the consensus rating being Buy. The average one-year price target is $71.0, indicating a potential 13.42% upside.
Comparing Ratings with Peers
In this analysis, we delve into the analyst ratings and average 1-year price targets of Life Time Group Hldgs, RCI Hospitality Hldgs and Vail Resorts, three key industry players, offering insights into their relative performance expectations and market positioning.
- The prevailing sentiment among analysts is an Buy trajectory for Life Time Group Hldgs, with an average 1-year price target of $23.0, implying a potential 63.26% downside.
- RCI Hospitality Hldgs received a Buy consensus from analysts, with an average 1-year price target of $115.0, implying a potential 83.71% upside.
- For Vail Resorts, analysts project an Buy trajectory, with an average 1-year price target of $252.18, indicating a potential 302.84% upside.
Peer Metrics Summary
The peer analysis summary offers a detailed examination of key metrics for Life Time Group Hldgs, RCI Hospitality Hldgs and Vail Resorts, providing valuable insights into their respective standings within the industry and their market positions and comparative performance.
| Company | Consensus | Revenue Growth | Gross Profit | Return on Equity |
|---|---|---|---|---|
| Dave & Buster's Enter | Buy | -2.97% | $394.10M | -1.98% |
| Life Time Group Hldgs | Buy | 18.23% | $270.58M | 1.06% |
| RCI Hospitality Hldgs | Buy | 5.63% | $42.22M | 2.54% |
| Vail Resorts | Buy | -2.16% | $536.82M | 29.98% |
Key Takeaway:
Dave & Buster's Enter ranks at the bottom for Revenue Growth among its peers. It also ranks at the bottom for Gross Profit. However, it is at the top for Return on Equity.
Delving into Dave & Buster's Enter's Background
Dave & Buster's Entertainment Inc owns and operates nearly a hundred entertainment and dining establishments in the United States where customers can eat, drink, play games, and watch televised sports. The play division includes amusement, simulation, and video games, accounts for more than half of total company revenue. Food and beverage accounts for the rest. About one third of food and beverage revenue comes from alcoholic drinks, with the rest coming from food and nonalcoholic beverages.
Dave & Buster's Enter: Delving into Financials
Market Capitalization: Positioned above industry average, the company's market capitalization underscores its superiority in size, indicative of a strong market presence.
Revenue Challenges: Dave & Buster's Enter's revenue growth over 3 months faced difficulties. As of 31 October, 2023, the company experienced a decline of approximately -2.97%. This indicates a decrease in top-line earnings. As compared to its peers, the revenue growth lags behind its industry peers. The company achieved a growth rate lower than the average among peers in Consumer Discretionary sector.
Net Margin: Dave & Buster's Enter's net margin is impressive, surpassing industry averages. With a net margin of -1.11%, the company demonstrates strong profitability and effective cost management.
Return on Equity (ROE): Dave & Buster's Enter's ROE falls below industry averages, indicating challenges in efficiently using equity capital. With an ROE of -1.98%, the company may face hurdles in generating optimal returns for shareholders.
Return on Assets (ROA): Dave & Buster's Enter's ROA lags behind industry averages, suggesting challenges in maximizing returns from its assets. With an ROA of -0.14%, the company may face hurdles in achieving optimal financial performance.
Debt Management: The company faces challenges in debt management with a debt-to-equity ratio higher than the industry average. With a ratio of 13.92, caution is advised due to increased financial risk.
To track all earnings releases for Dave & Buster's Enter visit their earnings calendar on our site.
This article was generated by Benzinga's automated content engine and reviewed by an editor.
Edge Rankings
Price Trend
© 2025 Benzinga.com. Benzinga does not provide investment advice. All rights reserved.
Trade confidently with insights and alerts from analyst ratings, free reports and breaking news that affects the stocks you care about.

