

Analysts' ratings for Manhattan Associates MANH over the last quarter vary from bullish to bearish, as provided by 6 analysts.
The table below provides a snapshot of their recent ratings, showcasing how sentiments have evolved over the past 30 days and comparing them to the preceding months.
| Bullish | Somewhat Bullish | Indifferent | Somewhat Bearish | Bearish | |
|---|---|---|---|---|---|
| Total Ratings | 1 | 1 | 4 | 0 | 0 |
| Last 30D | 0 | 0 | 1 | 0 | 0 |
| 1M Ago | 0 | 0 | 0 | 0 | 0 |
| 2M Ago | 0 | 0 | 1 | 0 | 0 |
| 3M Ago | 1 | 1 | 2 | 0 | 0 |
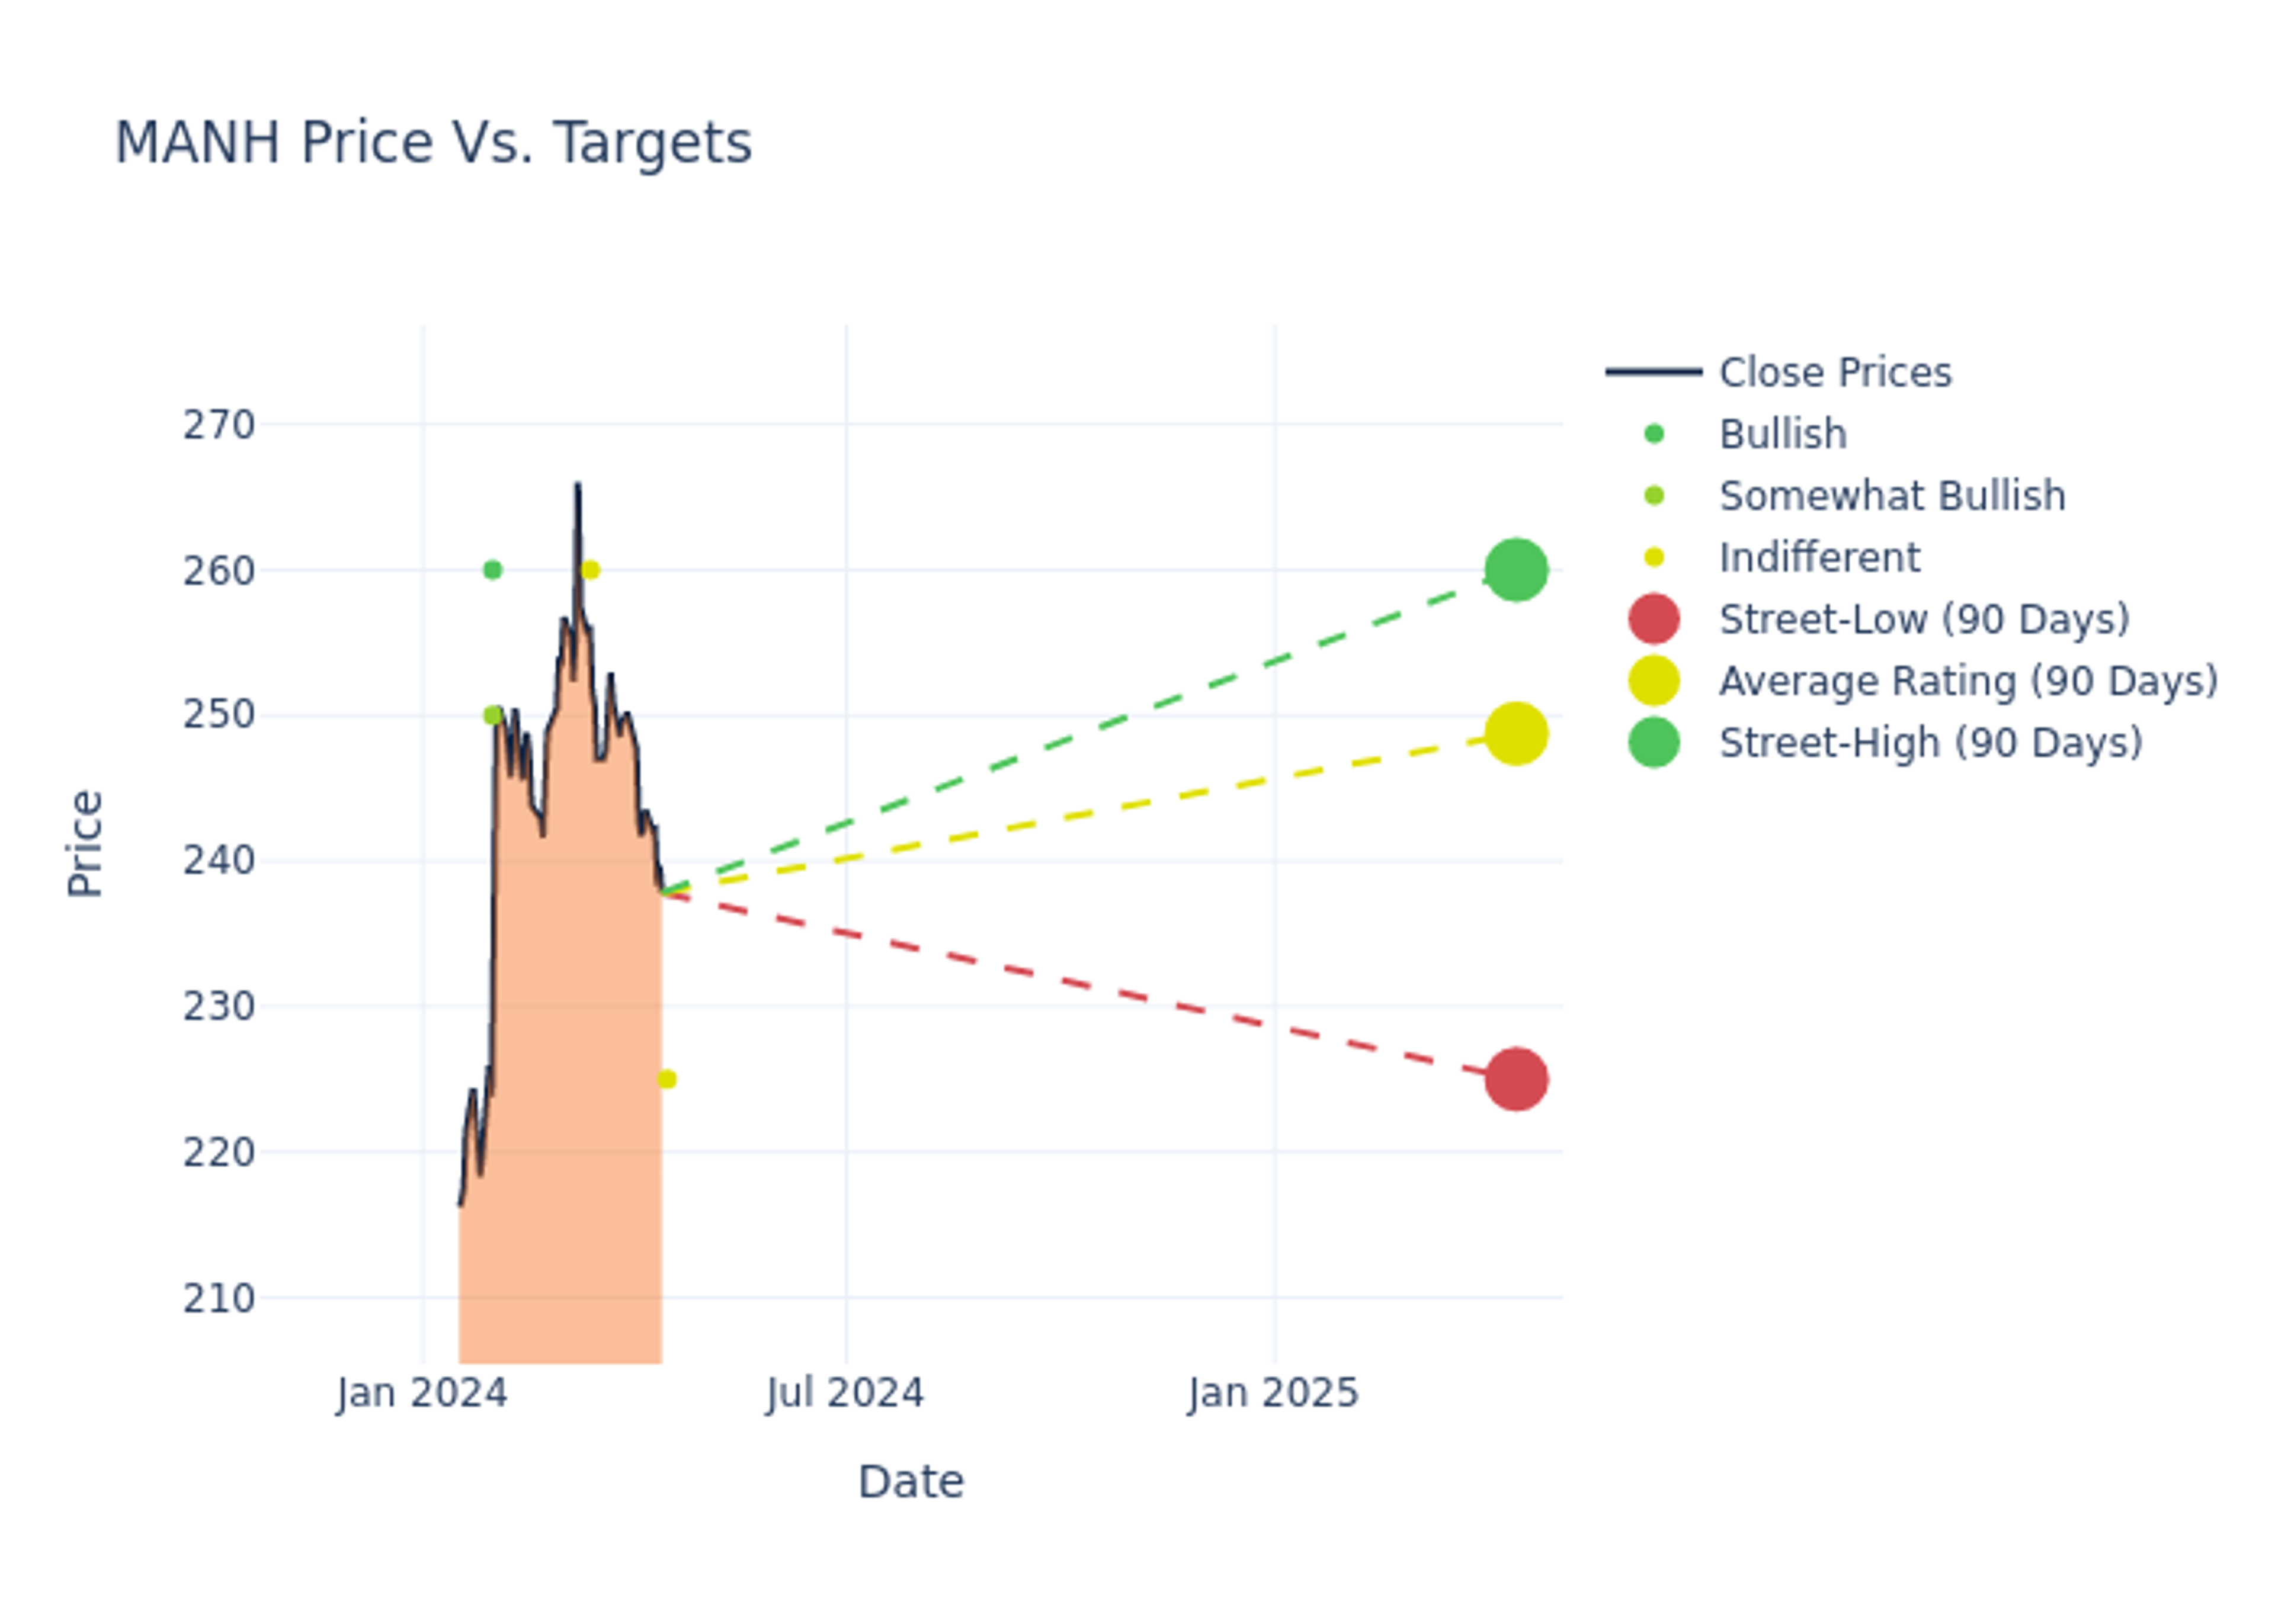
The 12-month price targets assessed by analysts reveal further insights, featuring an average target of $239.17, a high estimate of $260.00, and a low estimate of $215.00. This upward trend is apparent, with the current average reflecting a 9.31% increase from the previous average price target of $218.80.

Analyzing Analyst Ratings: A Detailed Breakdown
The perception of Manhattan Associates by financial experts is analyzed through recent analyst actions. The following summary presents key analysts, their recent evaluations, and adjustments to ratings and price targets.
| Analyst | Analyst Firm | Action Taken | Rating | Current Price Target | Prior Price Target |
|---|---|---|---|---|---|
| Blair Abernethy | Rosenblatt | Maintains | Neutral | $225.00 | $225.00 |
| George Kurosawa | Citigroup | Announces | Neutral | $260.00 | - |
| Blair Abernethy | Rosenblatt | Raises | Neutral | $225.00 | $215.00 |
| Brian Peterson | Raymond James | Raises | Outperform | $250.00 | $214.00 |
| Terry Tillman | Truist Securities | Raises | Buy | $260.00 | $240.00 |
| Blair Abernethy | Rosenblatt | Raises | Neutral | $215.00 | $200.00 |
Key Insights:
- Action Taken: Responding to changing market dynamics and company performance, analysts update their recommendations. Whether they 'Maintain', 'Raise', or 'Lower' their stance, it signifies their response to recent developments related to Manhattan Associates. This offers insight into analysts' perspectives on the current state of the company.
- Rating: Unveiling insights, analysts deliver qualitative insights into stock performance, from 'Outperform' to 'Underperform'. These ratings convey expectations for the relative performance of Manhattan Associates compared to the broader market.
- Price Targets: Gaining insights, analysts provide estimates for the future value of Manhattan Associates's stock. This comparison reveals trends in analysts' expectations over time.
Capture valuable insights into Manhattan Associates's market standing by understanding these analyst evaluations alongside pertinent financial indicators. Stay informed and make strategic decisions with our Ratings Table.
Stay up to date on Manhattan Associates analyst ratings.
Delving into Manhattan Associates's Background
Manhattan Associates provides software that helps users manage their supply chains, inventory, and omnichannel operations. Customers are generally retailers, wholesalers, manufacturers, and logistics providers. The company was founded in 1990 and serves more than 1,200 customers around the world.
Understanding the Numbers: Manhattan Associates's Finances
Market Capitalization Analysis: Falling below industry benchmarks, the company's market capitalization reflects a reduced size compared to peers. This positioning may be influenced by factors such as growth expectations or operational capacity.
Revenue Growth: Manhattan Associates displayed positive results in 3 months. As of 31 December, 2023, the company achieved a solid revenue growth rate of approximately 20.27%. This indicates a notable increase in the company's top-line earnings. When compared to others in the Information Technology sector, the company excelled with a growth rate higher than the average among peers.
Net Margin: Manhattan Associates's net margin surpasses industry standards, highlighting the company's exceptional financial performance. With an impressive 20.46% net margin, the company effectively manages costs and achieves strong profitability.
Return on Equity (ROE): The company's ROE is a standout performer, exceeding industry averages. With an impressive ROE of 19.96%, the company showcases effective utilization of equity capital.
Return on Assets (ROA): The company's ROA is a standout performer, exceeding industry averages. With an impressive ROA of 7.82%, the company showcases effective utilization of assets.
Debt Management: Manhattan Associates's debt-to-equity ratio is below the industry average. With a ratio of 0.06, the company relies less on debt financing, maintaining a healthier balance between debt and equity, which can be viewed positively by investors.
The Basics of Analyst Ratings
Analysts are specialists within banking and financial systems that typically report for specific stocks or within defined sectors. These people research company financial statements, sit in conference calls and meetings, and speak with relevant insiders to determine what are known as analyst ratings for stocks. Typically, analysts will rate each stock once a quarter.
Some analysts will also offer forecasts for metrics like growth estimates, earnings, and revenue to provide further guidance on stocks. Investors who use analyst ratings should note that this specialized advice comes from humans and may be subject to error.
This article was generated by Benzinga's automated content engine and reviewed by an editor.
Edge Rankings
Price Trend
© 2025 Benzinga.com. Benzinga does not provide investment advice. All rights reserved.
date | ticker | name | Price Target | Upside/Downside | Recommendation | Firm |
|---|
Trade confidently with insights and alerts from analyst ratings, free reports and breaking news that affects the stocks you care about.

