

In the latest quarter, 7 analysts provided ratings for Trip.com Group TCOM, showcasing a mix of bullish and bearish perspectives.
In the table below, you'll find a summary of their recent ratings, revealing the shifting sentiments over the past 30 days and comparing them to the previous months.
| Bullish | Somewhat Bullish | Indifferent | Somewhat Bearish | Bearish | |
|---|---|---|---|---|---|
| Total Ratings | 4 | 3 | 0 | 0 | 0 |
| Last 30D | 1 | 0 | 0 | 0 | 0 |
| 1M Ago | 1 | 0 | 0 | 0 | 0 |
| 2M Ago | 2 | 3 | 0 | 0 | 0 |
| 3M Ago | 0 | 0 | 0 | 0 | 0 |
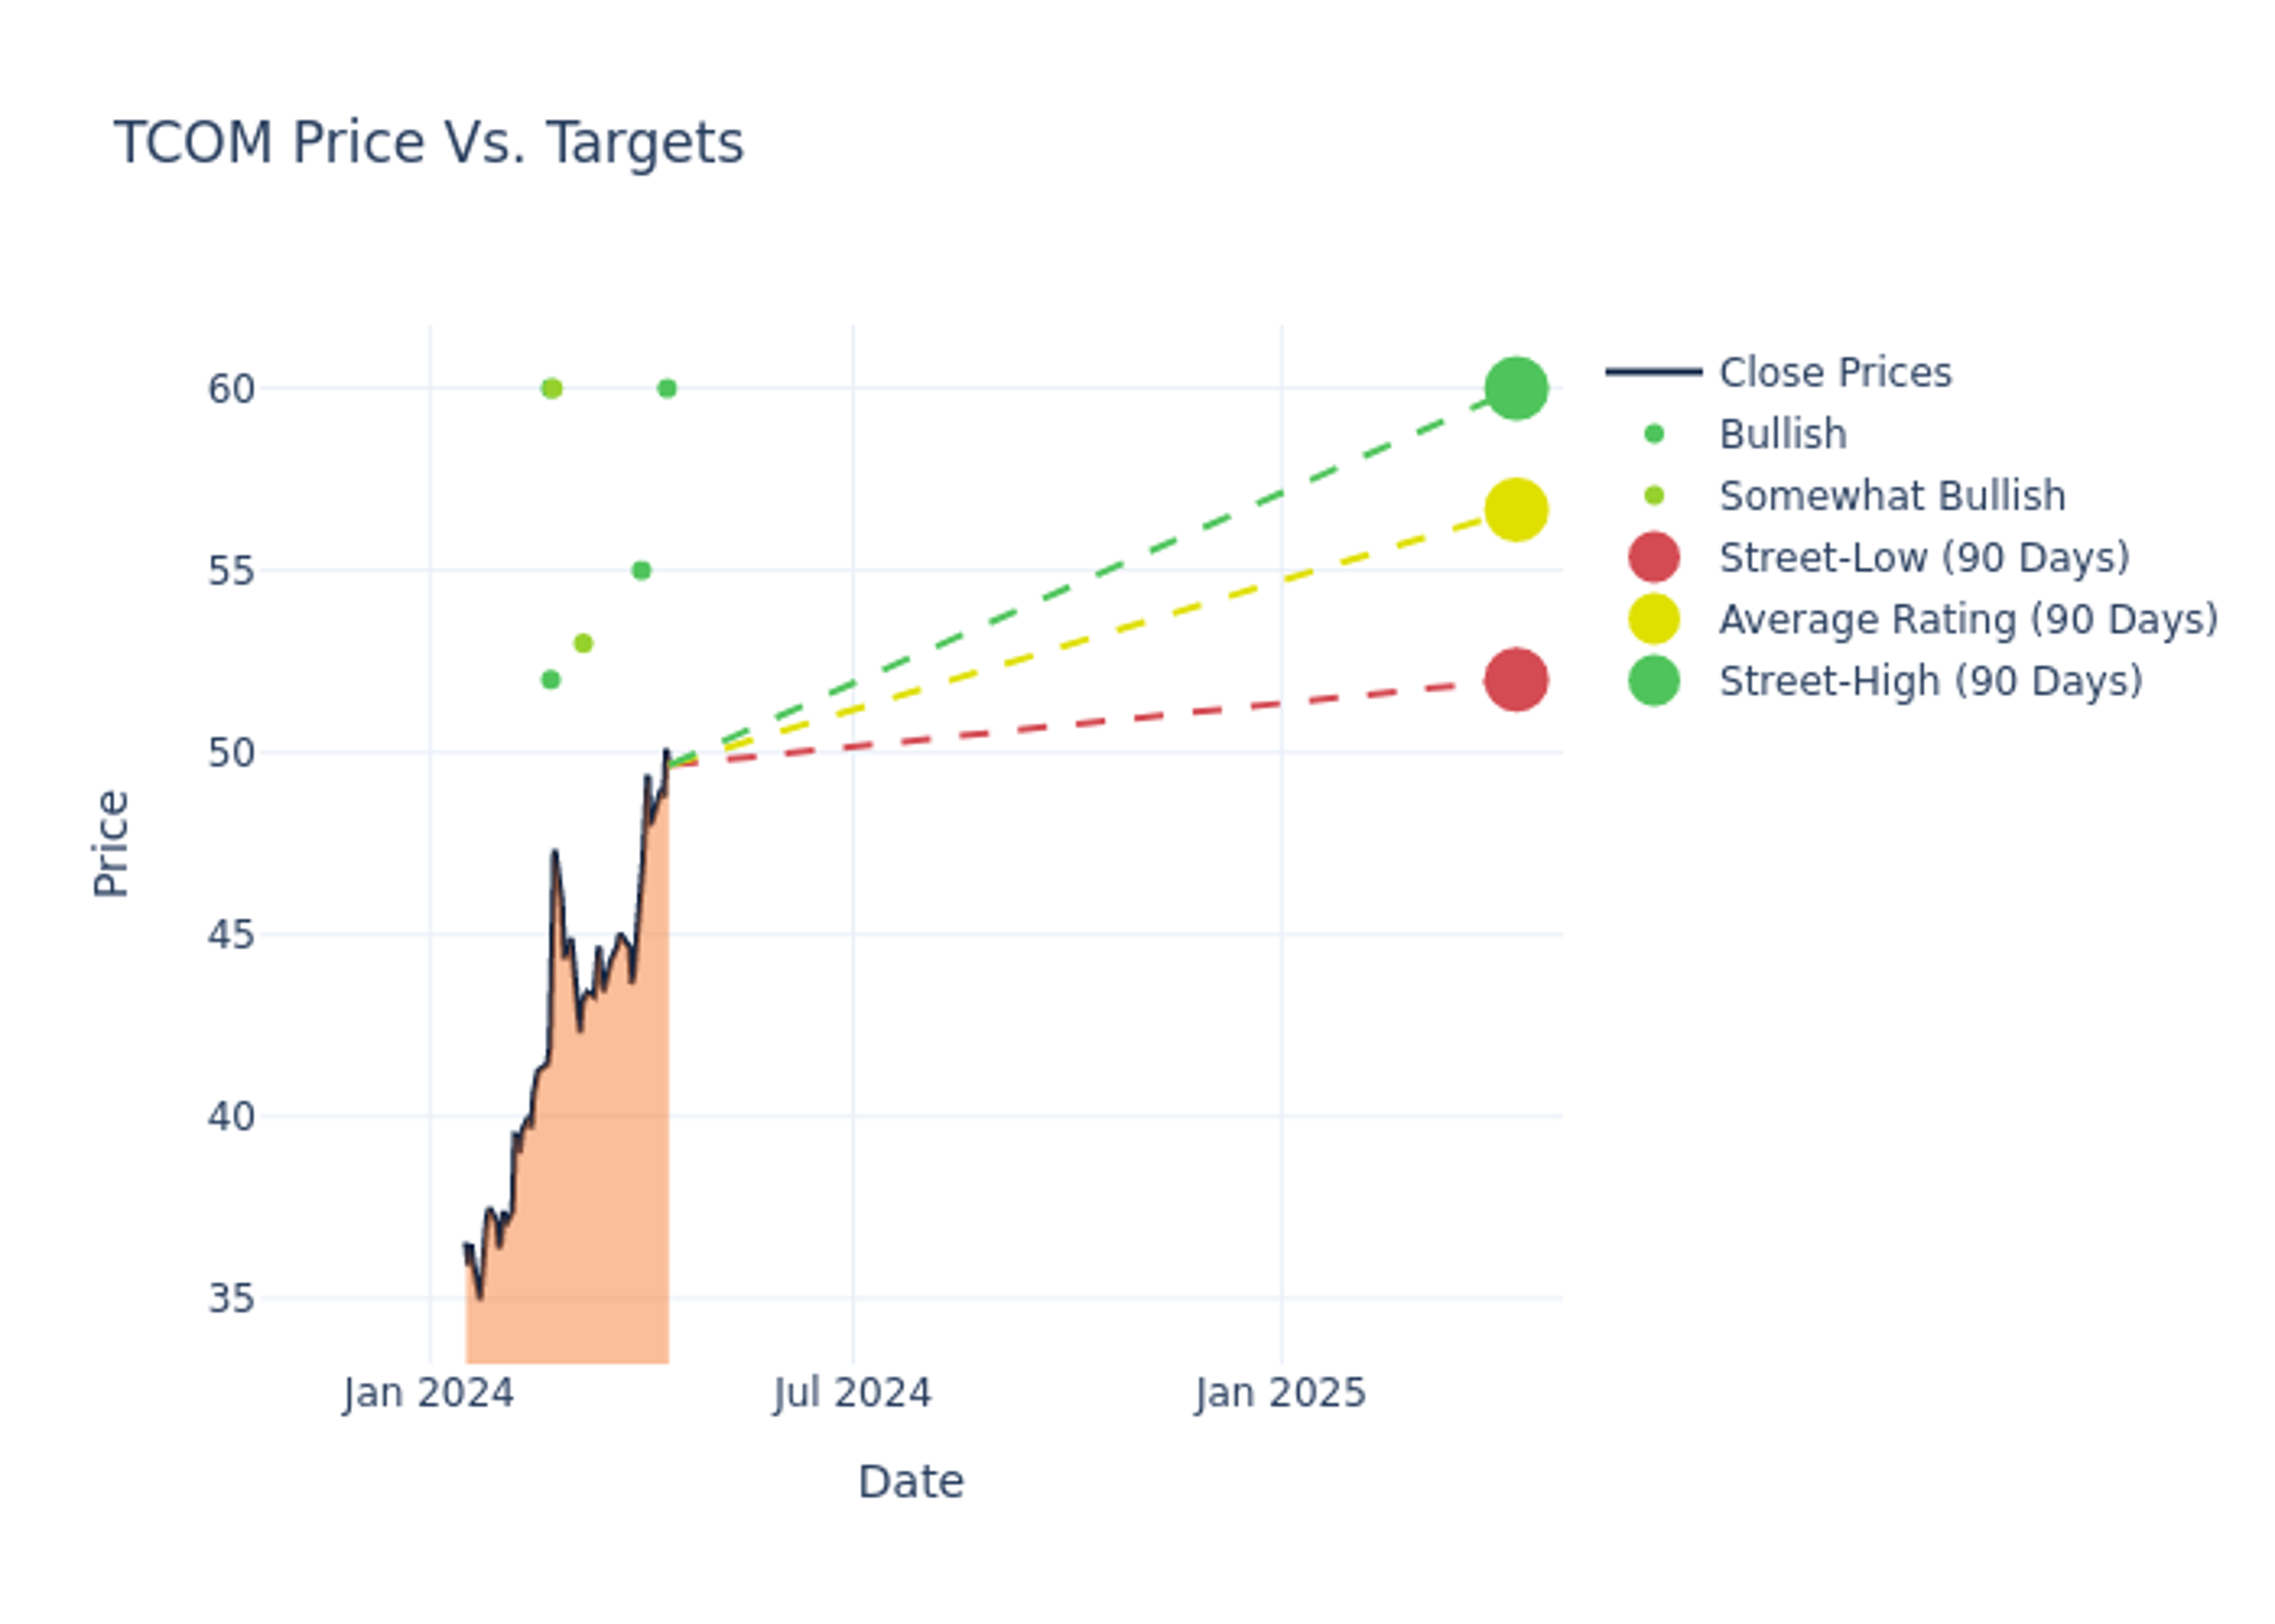
Analysts provide deeper insights through their assessments of 12-month price targets, revealing an average target of $57.14, a high estimate of $60.00, and a low estimate of $52.00. Observing a 10.18% increase, the current average has risen from the previous average price target of $51.86.

Analyzing Analyst Ratings: A Detailed Breakdown
The standing of Trip.com Group among financial experts becomes clear with a thorough analysis of recent analyst actions. The summary below outlines key analysts, their recent evaluations, and adjustments to ratings and price targets.
| Analyst | Analyst Firm | Action Taken | Rating | Current Price Target | Prior Price Target |
|---|---|---|---|---|---|
| Parash Jain | HSBC | Raises | Buy | $60.00 | $50.00 |
| Brian Gong | Citigroup | Raises | Buy | $55.00 | $53.00 |
| Kevin Kopelman | TD Cowen | Raises | Outperform | $53.00 | $45.00 |
| Jiong Shao | Barclays | Raises | Overweight | $60.00 | $56.00 |
| Wei Xiong | UBS | Raises | Buy | $52.00 | $48.00 |
| Jiong Shao | Barclays | Raises | Overweight | $60.00 | $56.00 |
| James Lee | Mizuho | Raises | Buy | $60.00 | $55.00 |
Key Insights:
- Action Taken: In response to dynamic market conditions and company performance, analysts update their recommendations. Whether they 'Maintain', 'Raise', or 'Lower' their stance, it signifies their reaction to recent developments related to Trip.com Group. This insight gives a snapshot of analysts' perspectives on the current state of the company.
- Rating: Analysts unravel qualitative evaluations for stocks, ranging from 'Outperform' to 'Underperform'. These ratings offer insights into expectations for the relative performance of Trip.com Group compared to the broader market.
- Price Targets: Analysts explore the dynamics of price targets, providing estimates for the future value of Trip.com Group's stock. This examination reveals shifts in analysts' expectations over time.
Capture valuable insights into Trip.com Group's market standing by understanding these analyst evaluations alongside pertinent financial indicators. Stay informed and make strategic decisions with our Ratings Table.
Stay up to date on Trip.com Group analyst ratings.
Delving into Trip.com Group's Background
Trip.com is the largest online travel agent in China and is positioned to benefit from the country's rising demand for higher-margin outbound travel as passport penetration is only 12% in China. The company generated about 78% of sales from accommodation reservations and transportation ticketing in 2020. The rest of revenue comes from package tours and corporate travel. Prior to the pandemic in 2019, the company generated 25% of revenue from international business, which is important to its margin expansion. Most of sales come from websites and mobile platforms, while the rest come from call centers. The competes in a crowded OTA industry in China, including Meituan, Alibaba-backed Fliggy, Tongcheng, and Qunar. The company was founded in 1999 and listed on the Nasdaq in December 2003.
Trip.com Group: A Financial Overview
Market Capitalization: Boasting an elevated market capitalization, the company surpasses industry averages. This signals substantial size and strong market recognition.
Revenue Growth: Trip.com Group's revenue growth over a period of 3 months has faced challenges. As of 31 December, 2023, the company experienced a revenue decline of approximately -24.85%. This indicates a decrease in the company's top-line earnings. When compared to others in the Consumer Discretionary sector, the company faces challenges, achieving a growth rate lower than the average among peers.
Net Margin: Trip.com Group's net margin excels beyond industry benchmarks, reaching 12.56%. This signifies efficient cost management and strong financial health.
Return on Equity (ROE): Trip.com Group's ROE lags behind industry averages, suggesting challenges in maximizing returns on equity capital. With an ROE of 1.06%, the company may face hurdles in achieving optimal financial performance.
Return on Assets (ROA): Trip.com Group's ROA lags behind industry averages, suggesting challenges in maximizing returns from its assets. With an ROA of 0.58%, the company may face hurdles in achieving optimal financial performance.
Debt Management: Trip.com Group's debt-to-equity ratio is below the industry average at 0.37, reflecting a lower dependency on debt financing and a more conservative financial approach.
Analyst Ratings: What Are They?
Analyst ratings serve as essential indicators of stock performance, provided by experts in banking and financial systems. These specialists diligently analyze company financial statements, participate in conference calls, and engage with insiders to generate quarterly ratings for individual stocks.
Beyond their standard evaluations, some analysts contribute predictions for metrics like growth estimates, earnings, and revenue, furnishing investors with additional guidance. Users of analyst ratings should be mindful that this specialized advice is shaped by human perspectives and may be subject to variability.
This article was generated by Benzinga's automated content engine and reviewed by an editor.
Edge Rankings
Price Trend
© 2025 Benzinga.com. Benzinga does not provide investment advice. All rights reserved.
date | ticker | name | Price Target | Upside/Downside | Recommendation | Firm |
|---|
Trade confidently with insights and alerts from analyst ratings, free reports and breaking news that affects the stocks you care about.

