
In the last three months, 4 analysts have published ratings on Ashland ASH, offering a diverse range of perspectives from bullish to bearish.
The following table summarizes their recent ratings, shedding light on the changing sentiments within the past 30 days and comparing them to the preceding months.
| Bullish | Somewhat Bullish | Indifferent | Somewhat Bearish | Bearish | |
|---|---|---|---|---|---|
| Total Ratings | 1 | 1 | 1 | 1 | 0 |
| Last 30D | 0 | 1 | 0 | 0 | 0 |
| 1M Ago | 1 | 0 | 0 | 0 | 0 |
| 2M Ago | 0 | 0 | 0 | 0 | 0 |
| 3M Ago | 0 | 0 | 1 | 1 | 0 |
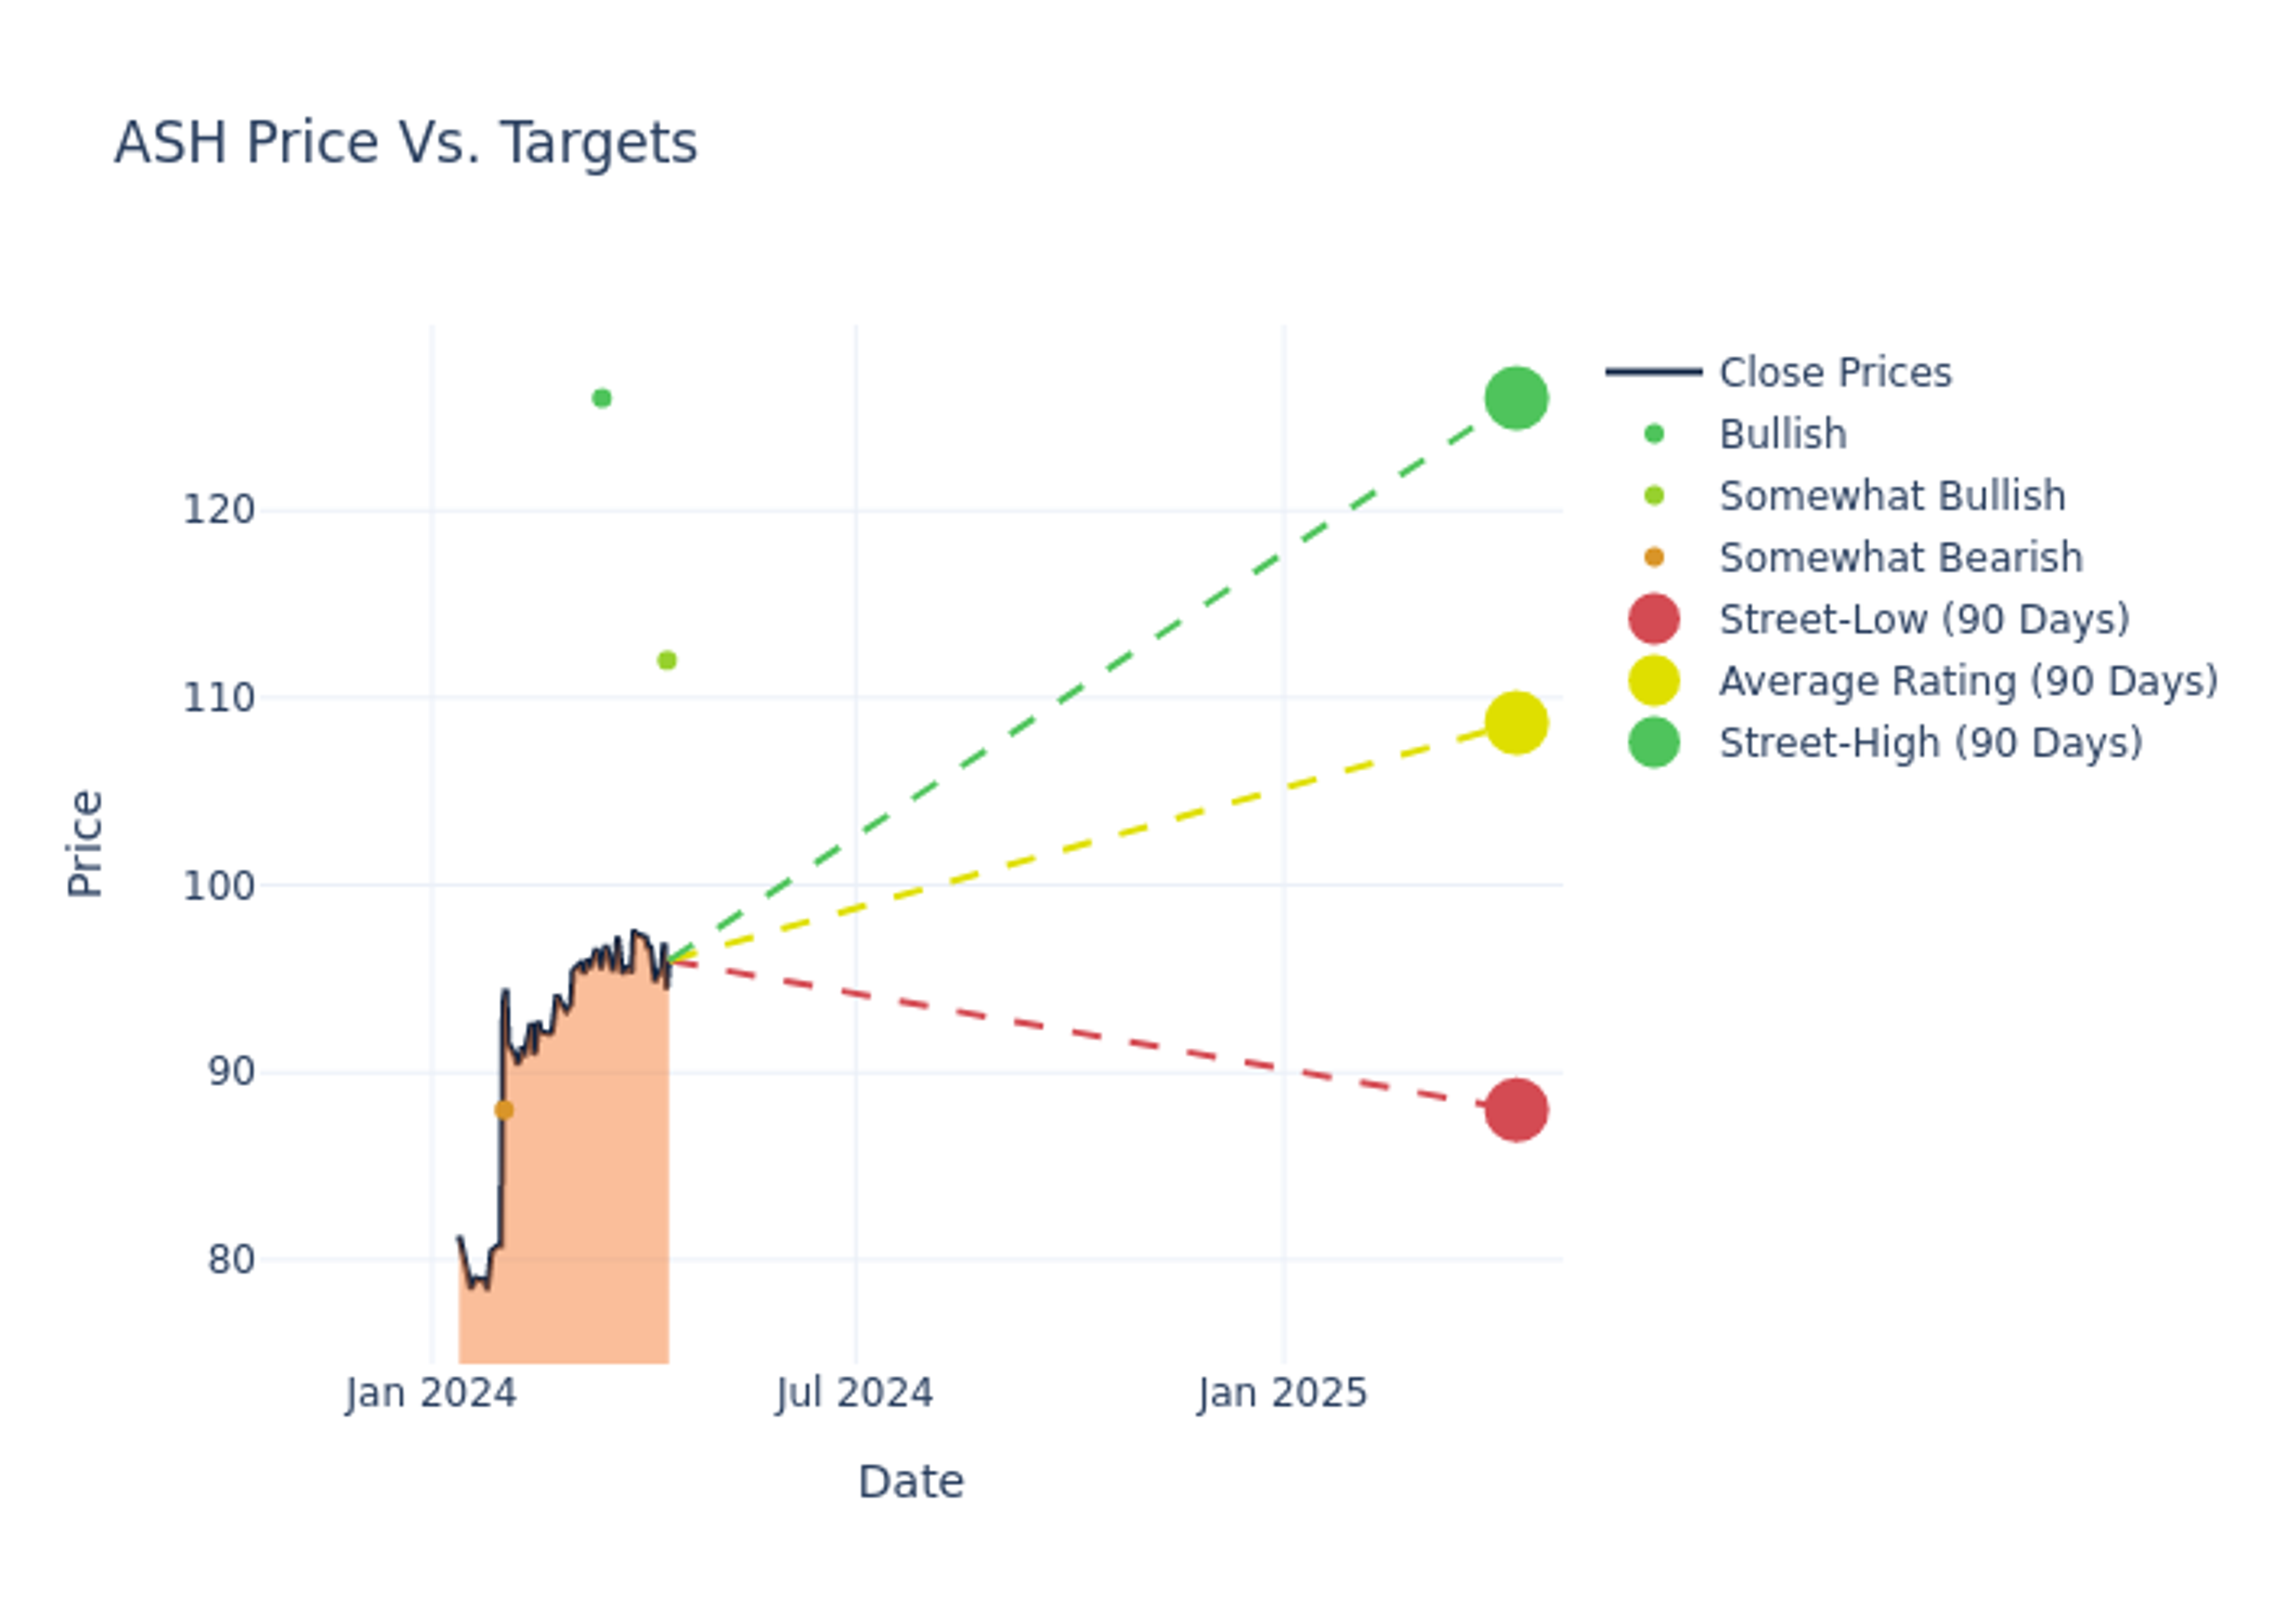
Analysts have set 12-month price targets for Ashland, revealing an average target of $106.5, a high estimate of $126.00, and a low estimate of $88.00. Observing a 21.71% increase, the current average has risen from the previous average price target of $87.50.

Interpreting Analyst Ratings: A Closer Look
An in-depth analysis of recent analyst actions unveils how financial experts perceive Ashland. The following summary outlines key analysts, their recent evaluations, and adjustments to ratings and price targets.
| Analyst | Analyst Firm | Action Taken | Rating | Current Price Target | Prior Price Target |
|---|---|---|---|---|---|
| Michael Sison | Wells Fargo | Raises | Overweight | $112.00 | $100.00 |
| Laurence Alexander | Jefferies | Raises | Buy | $126.00 | $100.00 |
| Jeffrey Zekauskas | JP Morgan | Raises | Underweight | $88.00 | $70.00 |
| Michael Sison | Wells Fargo | Raises | Equal-Weight | $100.00 | $80.00 |
Key Insights:
- Action Taken: Responding to changing market dynamics and company performance, analysts update their recommendations. Whether they 'Maintain', 'Raise', or 'Lower' their stance, it signifies their response to recent developments related to Ashland. This offers insight into analysts' perspectives on the current state of the company.
- Rating: Analysts assign qualitative assessments to stocks, ranging from 'Outperform' to 'Underperform'. These ratings convey the analysts' expectations for the relative performance of Ashland compared to the broader market.
- Price Targets: Analysts gauge the dynamics of price targets, providing estimates for the future value of Ashland's stock. This comparison reveals trends in analysts' expectations over time.
Navigating through these analyst evaluations alongside other financial indicators can contribute to a holistic understanding of Ashland's market standing. Stay informed and make data-driven decisions with our Ratings Table.
Stay up to date on Ashland analyst ratings.
All You Need to Know About Ashland
Ashland Inc is a world-wide specialty materials company that serves a wide range of industrial markets. The company has a business-centric operating model and is organized into four distinct segments: life sciences, personal care, specialty additives, and intermediates. Key customers for the firm include pharmaceutical companies and manufacturers of personal care products, food and beverages, and nutraceuticals and supplements. The life sciences segment derives maximum revenue. Ashland includes only U.S. and Canada in its North America designation and includes Europe, the Middle East and Africa in its Europe designation.
Ashland's Financial Performance
Market Capitalization Analysis: Reflecting a smaller scale, the company's market capitalization is positioned below industry averages. This could be attributed to factors such as growth expectations or operational capacity.
Negative Revenue Trend: Examining Ashland's financials over 3 months reveals challenges. As of 31 December, 2023, the company experienced a decline of approximately -9.9% in revenue growth, reflecting a decrease in top-line earnings. As compared to competitors, the company encountered difficulties, with a growth rate lower than the average among peers in the Materials sector.
Net Margin: Ashland's net margin surpasses industry standards, highlighting the company's exceptional financial performance. With an impressive 5.5% net margin, the company effectively manages costs and achieves strong profitability.
Return on Equity (ROE): Ashland's ROE excels beyond industry benchmarks, reaching 0.85%. This signifies robust financial management and efficient use of shareholder equity capital.
Return on Assets (ROA): Ashland's ROA stands out, surpassing industry averages. With an impressive ROA of 0.44%, the company demonstrates effective utilization of assets and strong financial performance.
Debt Management: Ashland's debt-to-equity ratio is below industry norms, indicating a sound financial structure with a ratio of 0.48.
The Significance of Analyst Ratings Explained
Ratings come from analysts, or specialists within banking and financial systems that report for specific stocks or defined sectors (typically once per quarter for each stock). Analysts usually derive their information from company conference calls and meetings, financial statements, and conversations with important insiders to reach their decisions.
Some analysts also offer predictions for helpful metrics such as earnings, revenue, and growth estimates to provide further guidance as to what to do with certain tickers. It is important to keep in mind that while stock and sector analysts are specialists, they are also human and can only forecast their beliefs to traders.
This article was generated by Benzinga's automated content engine and reviewed by an editor.
Edge Rankings
Price Trend
© 2025 Benzinga.com. Benzinga does not provide investment advice. All rights reserved.
date | ticker | name | Price Target | Upside/Downside | Recommendation | Firm |
|---|
Trade confidently with insights and alerts from analyst ratings, free reports and breaking news that affects the stocks you care about.

