

Ratings for Raymond James Finl RJF were provided by 4 analysts in the past three months, showcasing a mix of bullish and bearish perspectives.
The following table provides a quick overview of their recent ratings, highlighting the changing sentiments over the past 30 days and comparing them to the preceding months.
| Bullish | Somewhat Bullish | Indifferent | Somewhat Bearish | Bearish | |
|---|---|---|---|---|---|
| Total Ratings | 0 | 0 | 4 | 0 | 0 |
| Last 30D | 0 | 0 | 1 | 0 | 0 |
| 1M Ago | 0 | 0 | 1 | 0 | 0 |
| 2M Ago | 0 | 0 | 0 | 0 | 0 |
| 3M Ago | 0 | 0 | 2 | 0 | 0 |
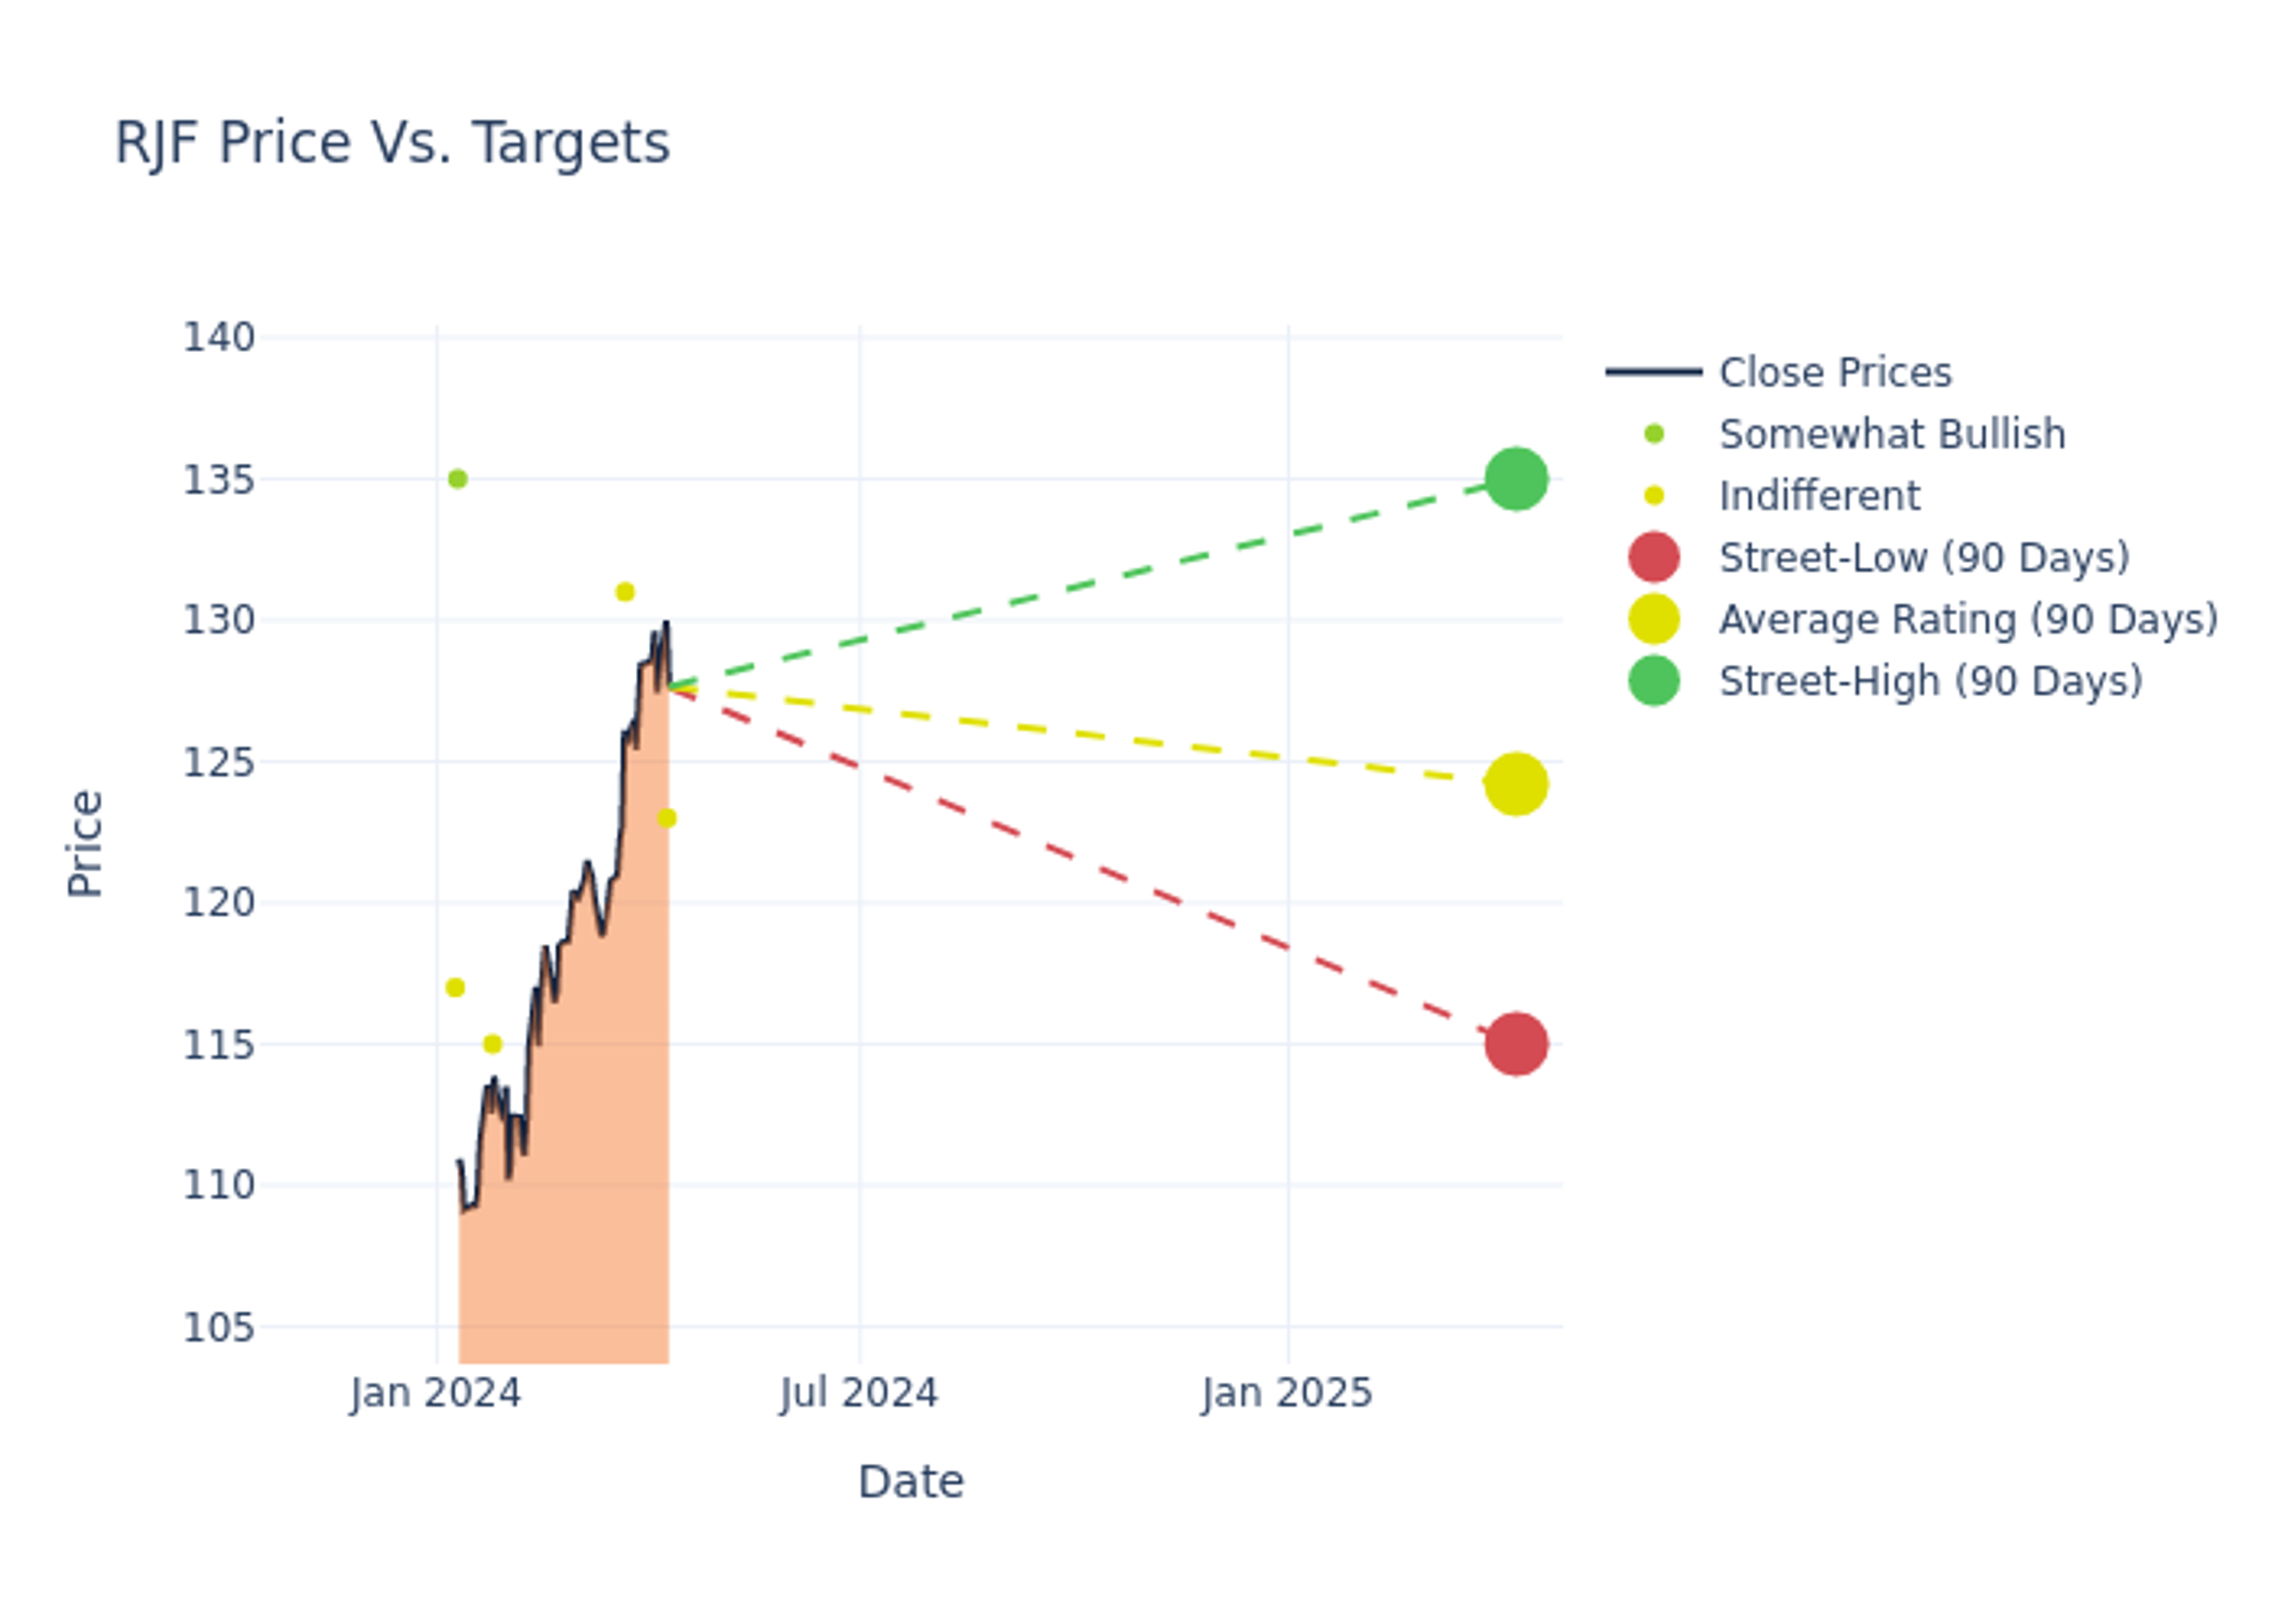
Providing deeper insights, analysts have established 12-month price targets, indicating an average target of $120.5, along with a high estimate of $131.00 and a low estimate of $113.00. This current average has increased by 6.75% from the previous average price target of $112.88.

Decoding Analyst Ratings: A Detailed Look
A clear picture of Raymond James Finl's perception among financial experts is painted with a thorough analysis of recent analyst actions. The summary below outlines key analysts, their recent evaluations, and adjustments to ratings and price targets.
| Analyst | Analyst Firm | Action Taken | Rating | Current Price Target | Prior Price Target |
|---|---|---|---|---|---|
| Michael Cyprys | Morgan Stanley | Raises | Equal-Weight | $123.00 | $113.00 |
| Bill Katz | TD Cowen | Raises | Market Perform | $131.00 | $116.50 |
| Manan Gosalia | Morgan Stanley | Raises | Equal-Weight | $113.00 | $106.00 |
| Brennan Hawken | UBS | Lowers | Neutral | $115.00 | $116.00 |
Key Insights:
- Action Taken: Analysts adapt their recommendations to changing market conditions and company performance. Whether they 'Maintain', 'Raise' or 'Lower' their stance, it reflects their response to recent developments related to Raymond James Finl. This information provides a snapshot of how analysts perceive the current state of the company.
- Rating: Gaining insights, analysts provide qualitative assessments, ranging from 'Outperform' to 'Underperform'. These ratings reflect expectations for the relative performance of Raymond James Finl compared to the broader market.
- Price Targets: Analysts provide insights into price targets, offering estimates for the future value of Raymond James Finl's stock. This comparison reveals trends in analysts' expectations over time.
Navigating through these analyst evaluations alongside other financial indicators can contribute to a holistic understanding of Raymond James Finl's market standing. Stay informed and make data-driven decisions with our Ratings Table.
Stay up to date on Raymond James Finl analyst ratings.
Discovering Raymond James Finl: A Closer Look
Raymond James Financial is a financial holding company whose major operations include wealth management, investment banking, asset management, and commercial banking. The company supports more than 8,000 employee and independent contractor financial advisors across the United States, Canada, and the United Kingdom with over $1.2 trillion of assets under administration as of September 2023. Approximately 90% of the company's revenue is from the U.S. and 70% is from the company's wealth-management segment.
Raymond James Finl: Delving into Financials
Market Capitalization Analysis: The company's market capitalization is above the industry average, indicating that it is relatively larger in size compared to peers. This may suggest a higher level of investor confidence and market recognition.
Revenue Growth: Over the 3 months period, Raymond James Finl showcased positive performance, achieving a revenue growth rate of 8.03% as of 31 December, 2023. This reflects a substantial increase in the company's top-line earnings. When compared to others in the Financials sector, the company faces challenges, achieving a growth rate lower than the average among peers.
Net Margin: The company's net margin is a standout performer, exceeding industry averages. With an impressive net margin of 16.72%, the company showcases strong profitability and effective cost control.
Return on Equity (ROE): Raymond James Finl's financial strength is reflected in its exceptional ROE, which exceeds industry averages. With a remarkable ROE of 4.77%, the company showcases efficient use of equity capital and strong financial health.
Return on Assets (ROA): Raymond James Finl's ROA surpasses industry standards, highlighting the company's exceptional financial performance. With an impressive 0.63% ROA, the company effectively utilizes its assets for optimal returns.
Debt Management: Raymond James Finl's debt-to-equity ratio is below the industry average at 0.29, reflecting a lower dependency on debt financing and a more conservative financial approach.
Understanding the Relevance of Analyst Ratings
Within the domain of banking and financial systems, analysts specialize in reporting for specific stocks or defined sectors. Their work involves attending company conference calls and meetings, researching company financial statements, and communicating with insiders to publish "analyst ratings" for stocks. Analysts typically assess and rate each stock once per quarter.
Beyond their standard evaluations, some analysts contribute predictions for metrics like growth estimates, earnings, and revenue, furnishing investors with additional guidance. Users of analyst ratings should be mindful that this specialized advice is shaped by human perspectives and may be subject to variability.
This article was generated by Benzinga's automated content engine and reviewed by an editor.
Edge Rankings
Price Trend
© 2025 Benzinga.com. Benzinga does not provide investment advice. All rights reserved.
date | ticker | name | Price Target | Upside/Downside | Recommendation | Firm |
|---|
Trade confidently with insights and alerts from analyst ratings, free reports and breaking news that affects the stocks you care about.

