


In the preceding three months, 25 analysts have released ratings for Lululemon Athletica LULU, presenting a wide array of perspectives from bullish to bearish.
The table below provides a snapshot of their recent ratings, showcasing how sentiments have evolved over the past 30 days and comparing them to the preceding months.
| Bullish | Somewhat Bullish | Indifferent | Somewhat Bearish | Bearish | |
|---|---|---|---|---|---|
| Total Ratings | 6 | 13 | 3 | 3 | 0 |
| Last 30D | 0 | 1 | 0 | 0 | 0 |
| 1M Ago | 5 | 11 | 2 | 2 | 0 |
| 2M Ago | 1 | 0 | 0 | 1 | 0 |
| 3M Ago | 0 | 1 | 1 | 0 | 0 |
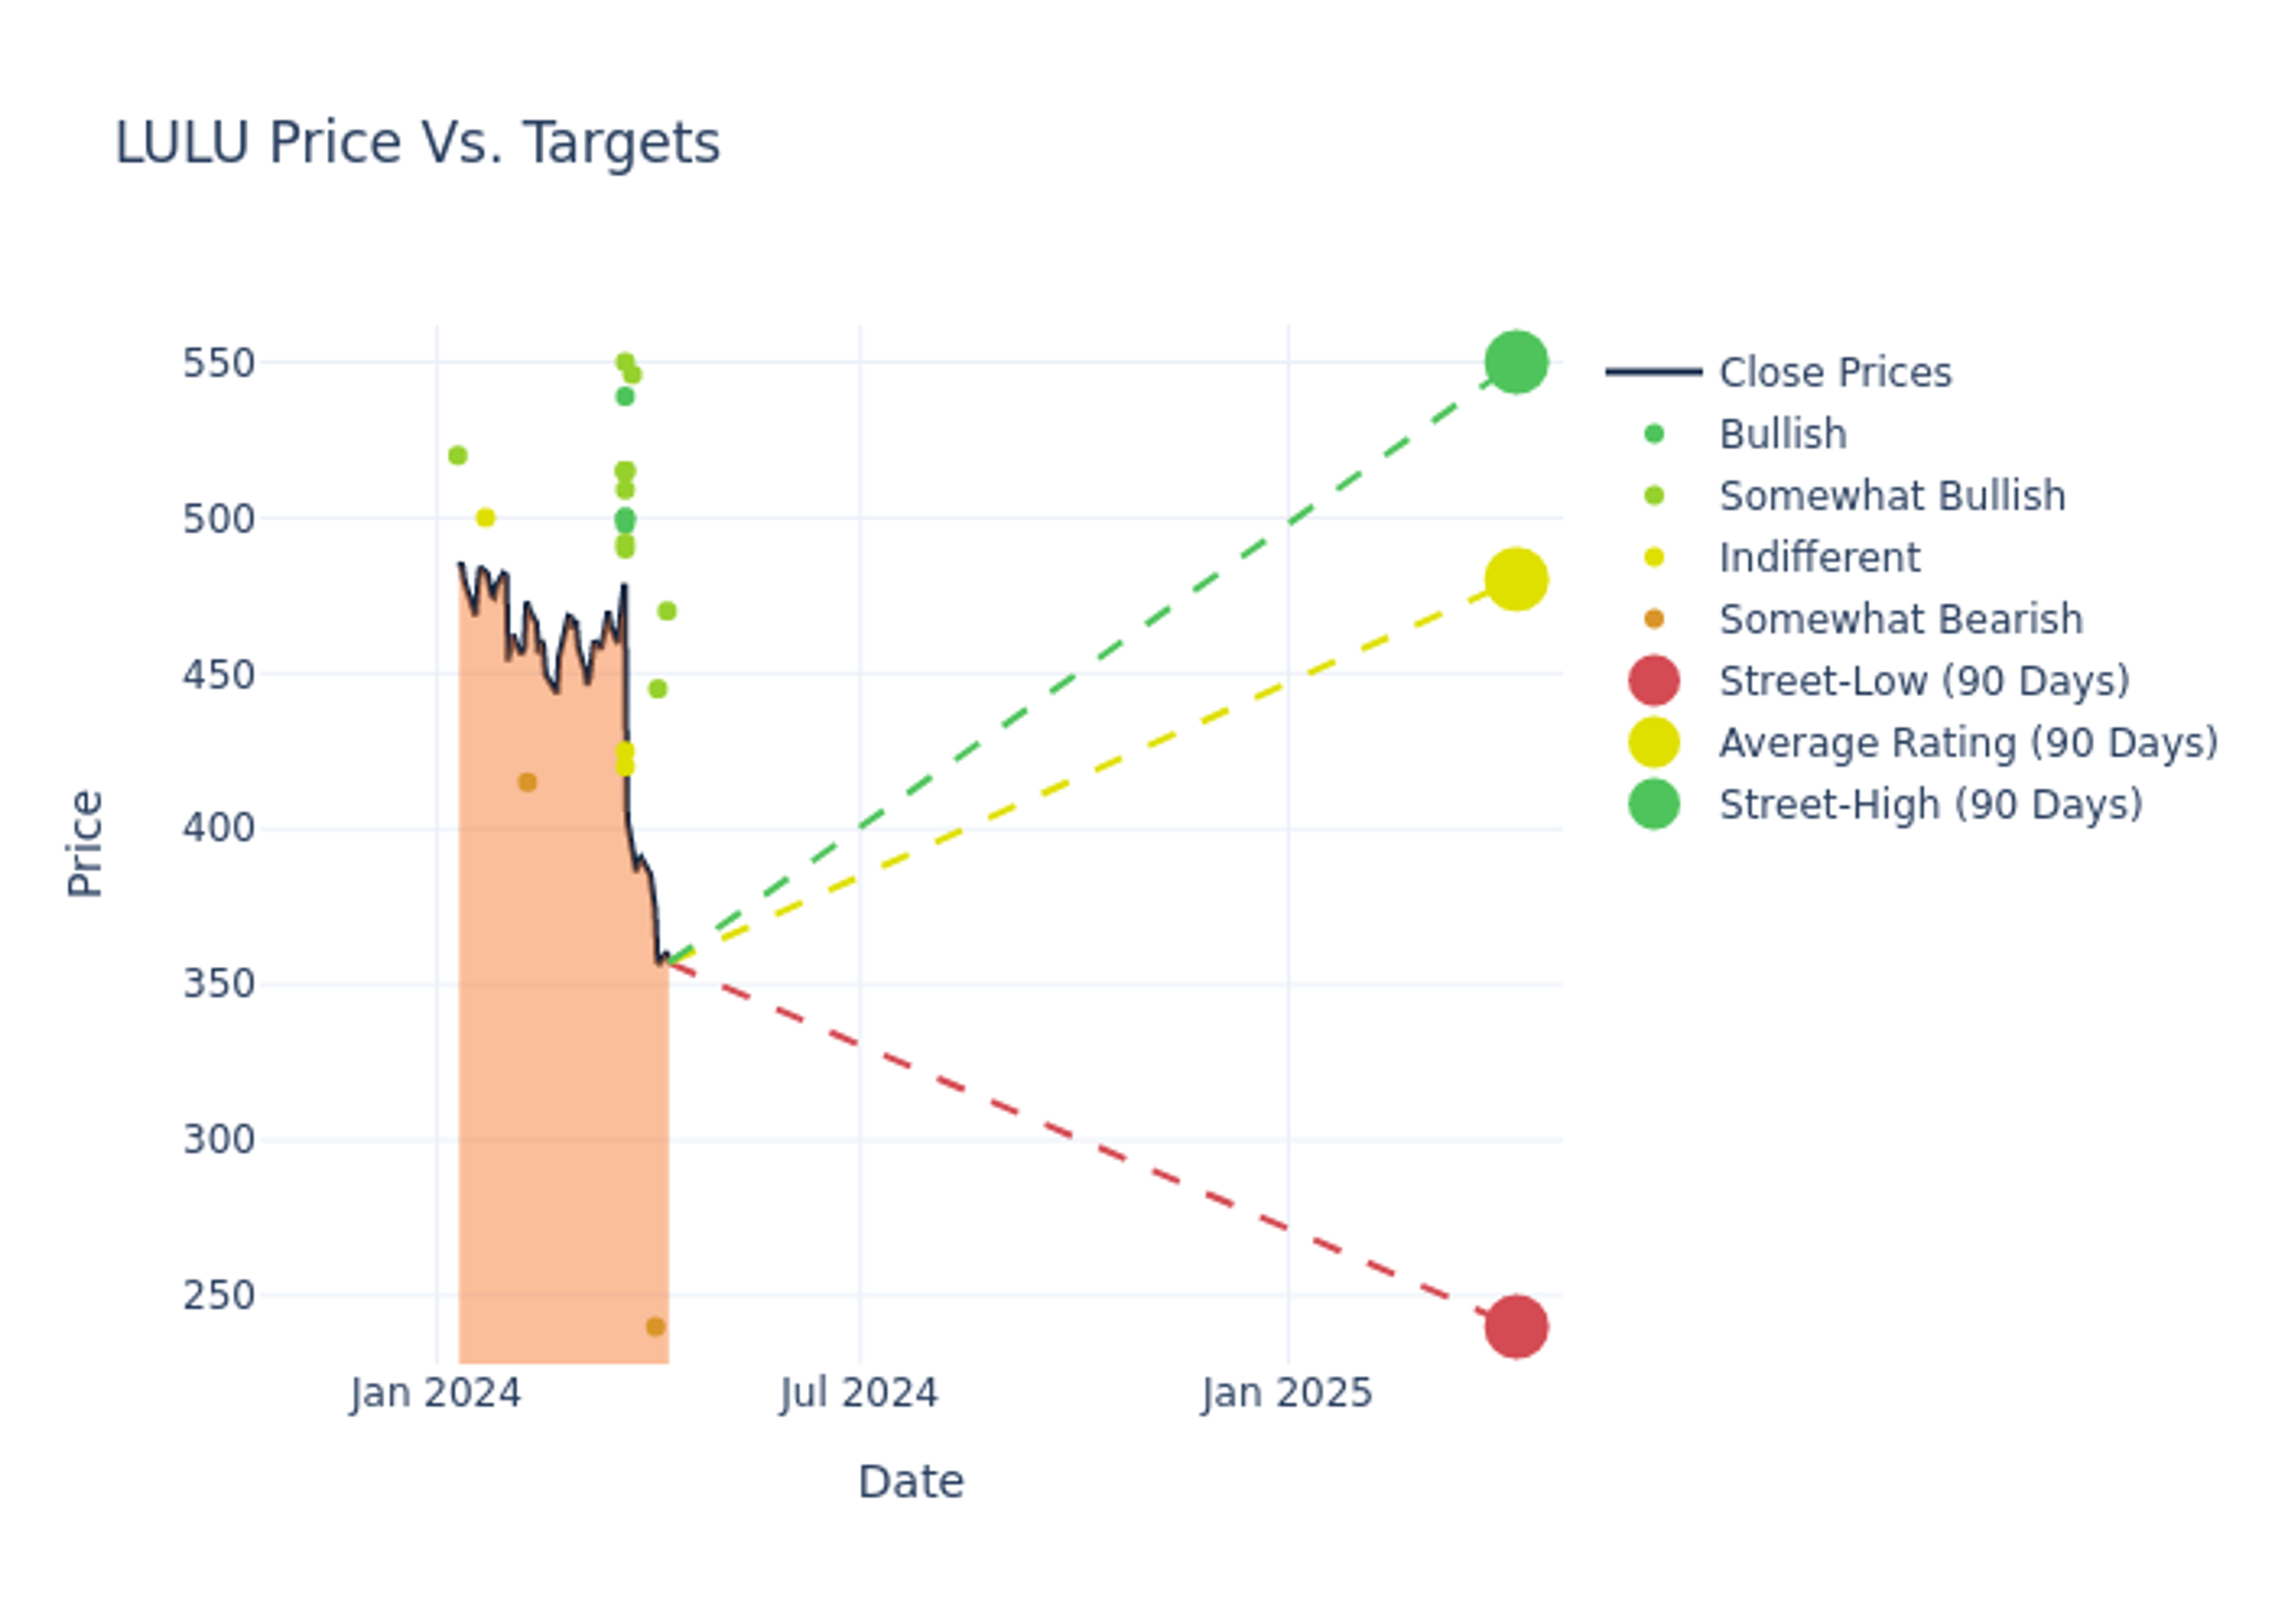
Analysts provide deeper insights through their assessments of 12-month price targets, revealing an average target of $484.6, a high estimate of $570.00, and a low estimate of $240.00. This current average has decreased by 7.89% from the previous average price target of $526.10.

Investigating Analyst Ratings: An Elaborate Study
A clear picture of Lululemon Athletica's perception among financial experts is painted with a thorough analysis of recent analyst actions. The summary below outlines key analysts, their recent evaluations, and adjustments to ratings and price targets.
| Analyst | Analyst Firm | Action Taken | Rating | Current Price Target | Prior Price Target |
|---|---|---|---|---|---|
| Abbie Zvejnieks | Piper Sandler | Lowers | Overweight | $470.00 | $525.00 |
| Brian Nagel | Oppenheimer | Lowers | Outperform | $445.00 | $540.00 |
| Randal Konik | Jefferies | Lowers | Underperform | $240.00 | $300.00 |
| Adrienne Yih | Barclays | Lowers | Overweight | $546.00 | $610.00 |
| Matthew Boss | JP Morgan | Lowers | Overweight | $509.00 | $531.00 |
| Ashley Owens | Keybanc | Lowers | Overweight | $515.00 | $570.00 |
| Randal Konik | Jefferies | Maintains | Underperform | $300.00 | - |
| Alexandra Steiger | Morgan Stanley | Lowers | Overweight | $490.00 | $539.00 |
| Michael Binetti | Evercore ISI Group | Lowers | Outperform | $515.00 | $575.00 |
| Ike Boruchow | Wells Fargo | Lowers | Equal-Weight | $425.00 | $450.00 |
| Abbie Zvejnieks | Piper Sandler | Lowers | Overweight | $525.00 | $560.00 |
| Jim Duffy | Stifel | Lowers | Buy | $539.00 | $596.00 |
| Joseph Civello | Truist Securities | Lowers | Buy | $498.00 | $561.00 |
| Simeon Siegel | BMO Capital | Raises | Market Perform | $420.00 | $408.00 |
| Tom Nikic | Wedbush | Lowers | Outperform | $492.00 | $548.00 |
| Paul Lejuez | Citigroup | Lowers | Buy | $500.00 | $520.00 |
| Dana Telsey | Telsey Advisory Group | Maintains | Outperform | $550.00 | $550.00 |
| Anna Andreeva | Needham | Lowers | Buy | $500.00 | $525.00 |
| John Kernan | TD Cowen | Lowers | Outperform | $515.00 | $553.00 |
| Scot Ciccarelli | Truist Securities | Maintains | Buy | $561.00 | $561.00 |
| Dana Telsey | Telsey Advisory Group | Maintains | Outperform | $550.00 | - |
| Anna Andreeva | Needham | Maintains | Buy | $525.00 | - |
| Laurent Vasilescu | Exane BNP Paribas | Announces | Underperform | $415.00 | - |
| Erwan Rambourg | HSBC | Announces | Hold | $500.00 | - |
| Noah Zatzkin | Keybanc | Raises | Overweight | $570.00 | $500.00 |
Key Insights:
- Action Taken: Analysts respond to changes in market conditions and company performance, frequently updating their recommendations. Whether they 'Maintain', 'Raise' or 'Lower' their stance, it reflects their reaction to recent developments related to Lululemon Athletica. This information offers a snapshot of how analysts perceive the current state of the company.
- Rating: Offering insights into predictions, analysts assign qualitative values, from 'Outperform' to 'Underperform'. These ratings convey expectations for the relative performance of Lululemon Athletica compared to the broader market.
- Price Targets: Analysts set price targets as an estimate of a stock's future value. Comparing the current and prior price targets provides insight into how analysts' expectations have changed over time. This information can be valuable for investors seeking to understand consensus views on the stock's potential future performance.
Considering these analyst evaluations in conjunction with other financial indicators can offer a comprehensive understanding of Lululemon Athletica's market position. Stay informed and make well-informed decisions with our Ratings Table.
Stay up to date on Lululemon Athletica analyst ratings.
Unveiling the Story Behind Lululemon Athletica
Lululemon Athletica designs, distributes, and markets athletic apparel, footwear, and accessories for women, men, and girls. Lululemon offers pants, shorts, tops, and jackets for both leisure and athletic activities such as yoga and running. The company also sells fitness accessories, such as bags, yoga mats, and equipment. Lululemon sells its products through more than 680 company-owned stores in 19 countries, e-commerce, outlets, and wholesale accounts. The company was founded in 1998 and is based in Vancouver, Canada.
Financial Milestones: Lululemon Athletica's Journey
Market Capitalization Highlights: Above the industry average, the company's market capitalization signifies a significant scale, indicating strong confidence and market prominence.
Revenue Growth: Lululemon Athletica displayed positive results in 3 months. As of 31 January, 2024, the company achieved a solid revenue growth rate of approximately 15.63%. This indicates a notable increase in the company's top-line earnings. When compared to others in the Consumer Discretionary sector, the company excelled with a growth rate higher than the average among peers.
Net Margin: Lululemon Athletica's net margin surpasses industry standards, highlighting the company's exceptional financial performance. With an impressive 20.89% net margin, the company effectively manages costs and achieves strong profitability.
Return on Equity (ROE): Lululemon Athletica's ROE surpasses industry standards, highlighting the company's exceptional financial performance. With an impressive 17.26% ROE, the company effectively utilizes shareholder equity capital.
Return on Assets (ROA): Lululemon Athletica's ROA stands out, surpassing industry averages. With an impressive ROA of 10.21%, the company demonstrates effective utilization of assets and strong financial performance.
Debt Management: With a below-average debt-to-equity ratio of 0.33, Lululemon Athletica adopts a prudent financial strategy, indicating a balanced approach to debt management.
How Are Analyst Ratings Determined?
Analyst ratings serve as essential indicators of stock performance, provided by experts in banking and financial systems. These specialists diligently analyze company financial statements, participate in conference calls, and engage with insiders to generate quarterly ratings for individual stocks.
Some analysts publish their predictions for metrics such as growth estimates, earnings, and revenue to provide additional guidance with their ratings. When using analyst ratings, it is important to keep in mind that stock and sector analysts are also human and are only offering their opinions to investors.
This article was generated by Benzinga's automated content engine and reviewed by an editor.
Edge Rankings
Price Trend
© 2025 Benzinga.com. Benzinga does not provide investment advice. All rights reserved.
date | ticker | name | Price Target | Upside/Downside | Recommendation | Firm |
|---|
Trade confidently with insights and alerts from analyst ratings, free reports and breaking news that affects the stocks you care about.

