


In the last three months, 4 analysts have published ratings on Trupanion TRUP, offering a diverse range of perspectives from bullish to bearish.
The table below provides a concise overview of recent ratings by analysts, offering insights into the changing sentiments over the past 30 days and drawing comparisons with the preceding months for a holistic perspective.
| Bullish | Somewhat Bullish | Indifferent | Somewhat Bearish | Bearish | |
|---|---|---|---|---|---|
| Total Ratings | 0 | 1 | 3 | 0 | 0 |
| Last 30D | 0 | 0 | 1 | 0 | 0 |
| 1M Ago | 0 | 0 | 0 | 0 | 0 |
| 2M Ago | 0 | 1 | 2 | 0 | 0 |
| 3M Ago | 0 | 0 | 0 | 0 | 0 |
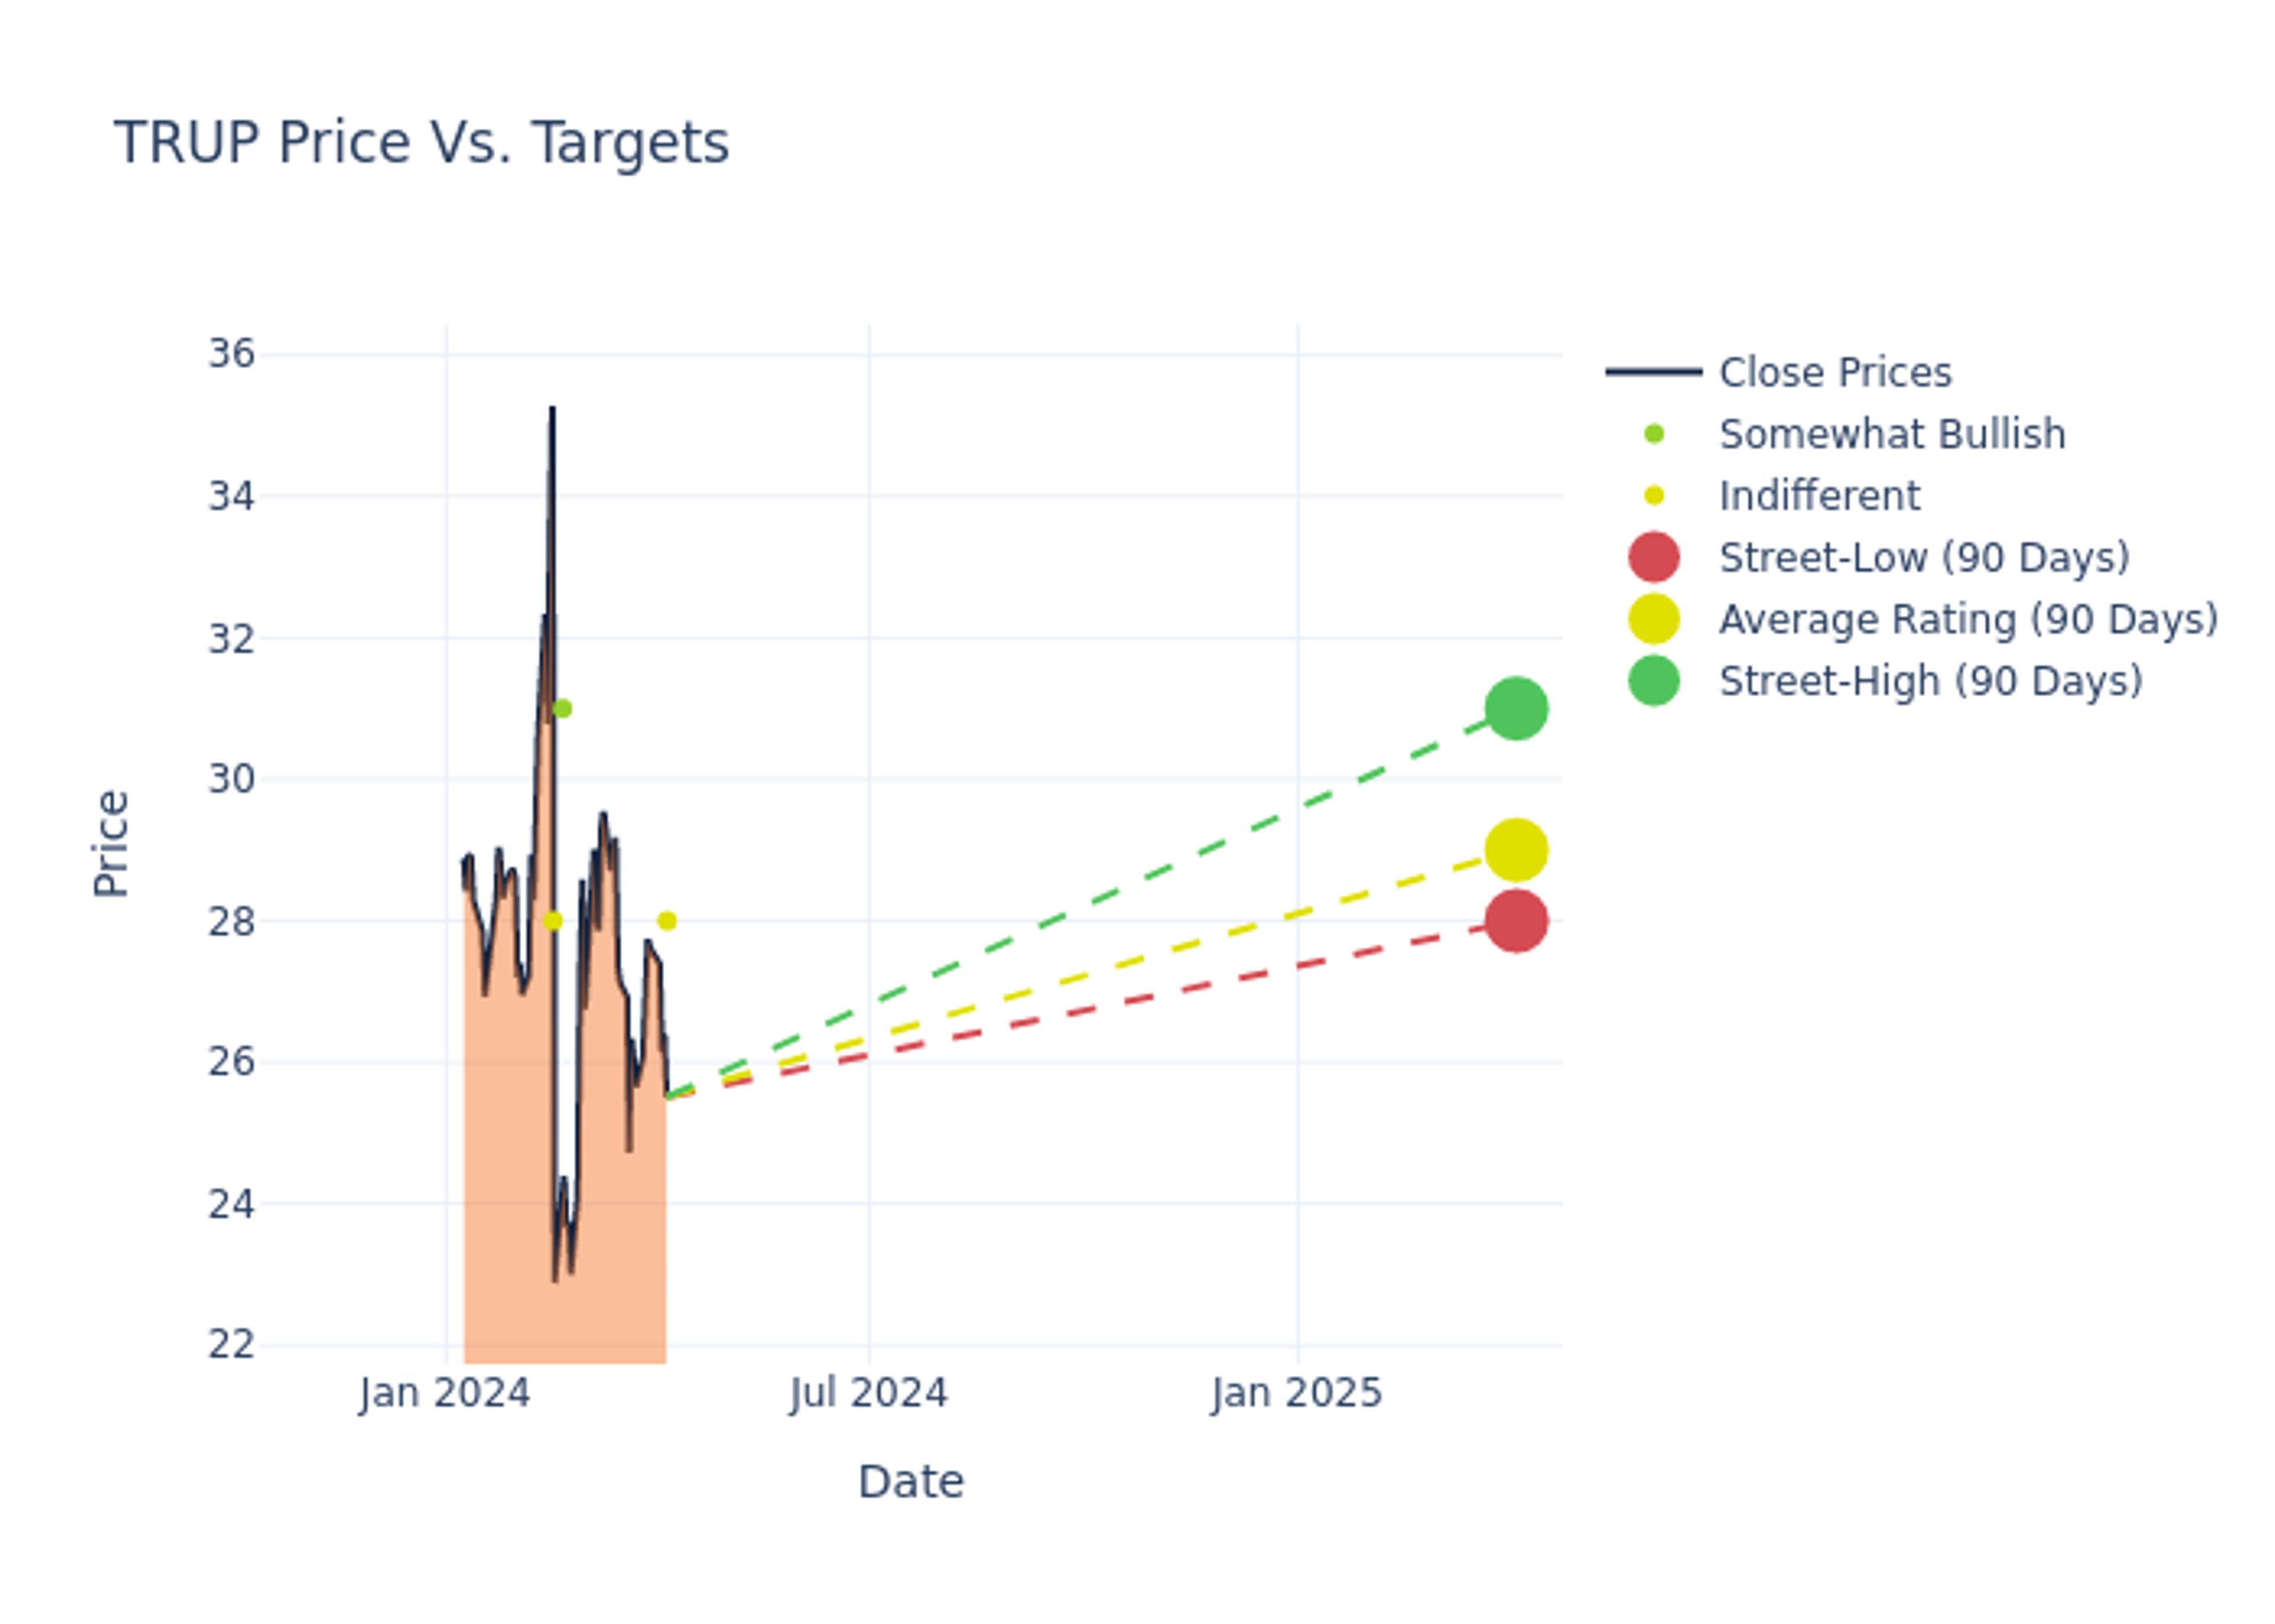
The 12-month price targets, analyzed by analysts, offer insights with an average target of $29.75, a high estimate of $32.00, and a low estimate of $28.00. This current average has decreased by 4.8% from the previous average price target of $31.25.

Understanding Analyst Ratings: A Comprehensive Breakdown
The standing of Trupanion among financial experts becomes clear with a thorough analysis of recent analyst actions. The summary below outlines key analysts, their recent evaluations, and adjustments to ratings and price targets.
| Analyst | Analyst Firm | Action Taken | Rating | Current Price Target | Prior Price Target |
|---|---|---|---|---|---|
| John Barnidge | Piper Sandler | Lowers | Neutral | $28.00 | $32.00 |
| Shweta Khajuria | Evercore ISI Group | Lowers | Outperform | $31.00 | $35.00 |
| John Barnidge | Piper Sandler | Lowers | Neutral | $32.00 | $33.00 |
| Jonathan Block | Stifel | Raises | Hold | $28.00 | $25.00 |
Key Insights:
- Action Taken: Responding to changing market dynamics and company performance, analysts update their recommendations. Whether they 'Maintain', 'Raise', or 'Lower' their stance, it signifies their response to recent developments related to Trupanion. This offers insight into analysts' perspectives on the current state of the company.
- Rating: Analyzing trends, analysts offer qualitative evaluations, ranging from 'Outperform' to 'Underperform'. These ratings convey expectations for the relative performance of Trupanion compared to the broader market.
- Price Targets: Analysts predict movements in price targets, offering estimates for Trupanion's future value. Examining the current and prior targets offers insights into analysts' evolving expectations.
To gain a panoramic view of Trupanion's market performance, explore these analyst evaluations alongside essential financial indicators. Stay informed and make judicious decisions using our Ratings Table.
Stay up to date on Trupanion analyst ratings.
If you are interested in following small-cap stock news and performance you can start by tracking it here.
Unveiling the Story Behind Trupanion
Trupanion Inc is a specialty insurance products provider in the United States. Its core business is the sale of insurance products tailor-made for pets, especially cats and dogs. It operates in two business segments: The subscription business segment generates revenue primarily from subscription fees related to the Company's direct-to-consumer products and Other business segment is comprised of revenue from other product offerings that generally have a business-to-business relationship and a different margin profile than subscription business segment, including revenue from writing policies on behalf of third parties and revenue from other products and software solutions.
Unraveling the Financial Story of Trupanion
Market Capitalization Analysis: Falling below industry benchmarks, the company's market capitalization reflects a reduced size compared to peers. This positioning may be influenced by factors such as growth expectations or operational capacity.
Positive Revenue Trend: Examining Trupanion's financials over 3 months reveals a positive narrative. The company achieved a noteworthy revenue growth rate of 20.26% as of 31 December, 2023, showcasing a substantial increase in top-line earnings. When compared to others in the Financials sector, the company excelled with a growth rate higher than the average among peers.
Net Margin: Trupanion's net margin lags behind industry averages, suggesting challenges in maintaining strong profitability. With a net margin of -0.73%, the company may face hurdles in effective cost management.
Return on Equity (ROE): Trupanion's ROE is below industry standards, pointing towards difficulties in efficiently utilizing equity capital. With an ROE of -0.73%, the company may encounter challenges in delivering satisfactory returns for shareholders.
Return on Assets (ROA): Trupanion's ROA is below industry standards, pointing towards difficulties in efficiently utilizing assets. With an ROA of -0.28%, the company may encounter challenges in delivering satisfactory returns from its assets.
Debt Management: Trupanion's debt-to-equity ratio is below the industry average. With a ratio of 0.42, the company relies less on debt financing, maintaining a healthier balance between debt and equity, which can be viewed positively by investors.
Analyst Ratings: Simplified
Analyst ratings serve as essential indicators of stock performance, provided by experts in banking and financial systems. These specialists diligently analyze company financial statements, participate in conference calls, and engage with insiders to generate quarterly ratings for individual stocks.
Beyond their standard evaluations, some analysts contribute predictions for metrics like growth estimates, earnings, and revenue, furnishing investors with additional guidance. Users of analyst ratings should be mindful that this specialized advice is shaped by human perspectives and may be subject to variability.
This article was generated by Benzinga's automated content engine and reviewed by an editor.
Edge Rankings
Price Trend
© 2025 Benzinga.com. Benzinga does not provide investment advice. All rights reserved.
date | ticker | name | Price Target | Upside/Downside | Recommendation | Firm |
|---|
Trade confidently with insights and alerts from analyst ratings, free reports and breaking news that affects the stocks you care about.

