

6 analysts have shared their evaluations of Newmont NEM during the recent three months, expressing a mix of bullish and bearish perspectives.
The table below provides a snapshot of their recent ratings, showcasing how sentiments have evolved over the past 30 days and comparing them to the preceding months.
| Bullish | Somewhat Bullish | Indifferent | Somewhat Bearish | Bearish | |
|---|---|---|---|---|---|
| Total Ratings | 1 | 2 | 3 | 0 | 0 |
| Last 30D | 1 | 0 | 0 | 0 | 0 |
| 1M Ago | 0 | 0 | 0 | 0 | 0 |
| 2M Ago | 0 | 1 | 2 | 0 | 0 |
| 3M Ago | 0 | 1 | 1 | 0 | 0 |
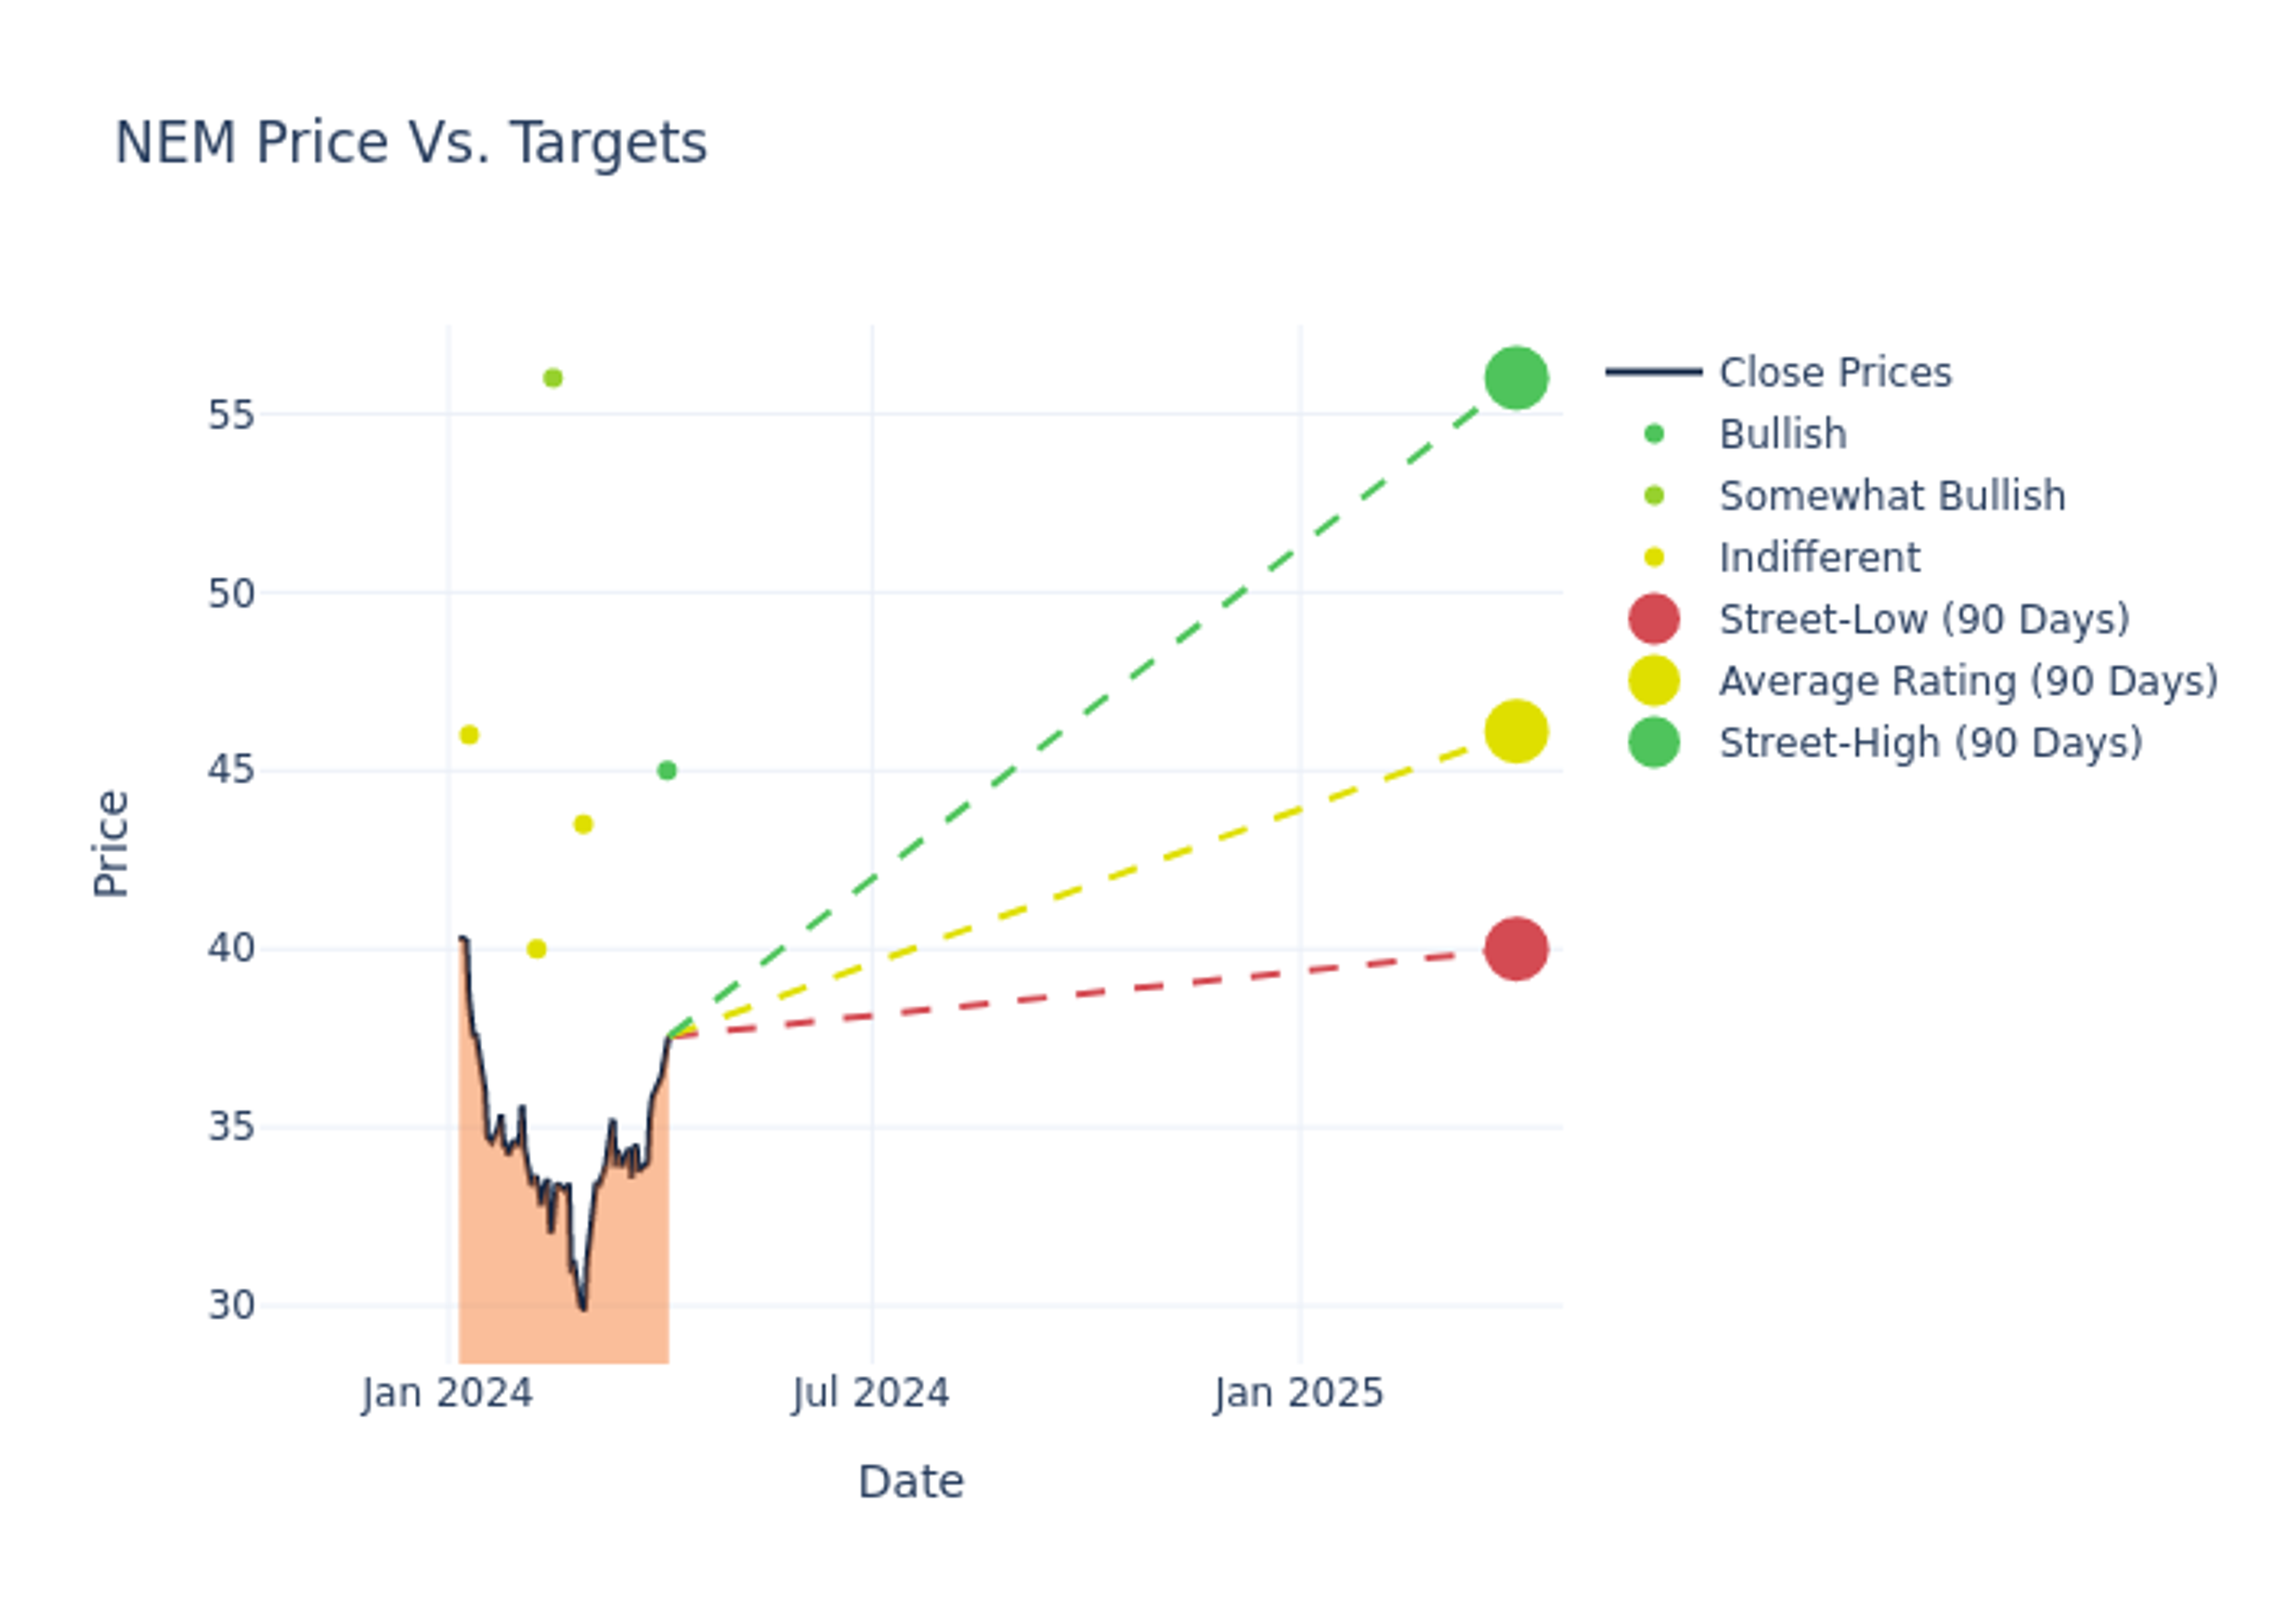
Analysts have set 12-month price targets for Newmont, revealing an average target of $48.25, a high estimate of $59.00, and a low estimate of $40.00. A negative shift in sentiment is evident as analysts have decreased the average price target by 11.95%.

Investigating Analyst Ratings: An Elaborate Study
The standing of Newmont among financial experts becomes clear with a thorough analysis of recent analyst actions. The summary below outlines key analysts, their recent evaluations, and adjustments to ratings and price targets.
| Analyst | Analyst Firm | Action Taken | Rating | Current Price Target | Prior Price Target |
|---|---|---|---|---|---|
| Alexander Hacking | Citigroup | Lowers | Buy | $45.00 | $60.00 |
| Tanya Jakusconek | Scotiabank | Lowers | Sector Perform | $43.50 | $50.00 |
| Jackie Przybylowski | BMO Capital | Lowers | Outperform | $56.00 | $57.00 |
| Josh Wolfson | RBC Capital | Lowers | Sector Perform | $40.00 | $45.00 |
| Jackie Przybylowski | BMO Capital | Lowers | Outperform | $59.00 | $62.00 |
| Greg Barnes | TD Securities | Announces | Hold | $46.00 | - |
Key Insights:
- Action Taken: Analysts adapt their recommendations to changing market conditions and company performance. Whether they 'Maintain', 'Raise' or 'Lower' their stance, it reflects their response to recent developments related to Newmont. This information provides a snapshot of how analysts perceive the current state of the company.
- Rating: Providing a comprehensive analysis, analysts offer qualitative assessments, ranging from 'Outperform' to 'Underperform'. These ratings reflect expectations for the relative performance of Newmont compared to the broader market.
- Price Targets: Gaining insights, analysts provide estimates for the future value of Newmont's stock. This comparison reveals trends in analysts' expectations over time.
Considering these analyst evaluations in conjunction with other financial indicators can offer a comprehensive understanding of Newmont's market position. Stay informed and make well-informed decisions with our Ratings Table.
Stay up to date on Newmont analyst ratings.
Get to Know Newmont Better
Newmont is the world's largest gold miner. It bought Goldcorp in 2019, combined its Nevada mines in a joint venture with competitor Barrick later that year, and also purchased competitor Newcrest in November 2023. Its portfolio includes 17 wholly or majority owned mines and interests in two joint ventures in the Americas, Africa, Australia and Papua New Guinea. The company is expected to produce roughly 6.9 million ounces of gold in 2024. However, after buying Newcrest, Newmont is likely to sell a number of its higher cost, smaller mines accounting for 20% of forecast sales in 2024. Newmont also produces material amounts of copper, silver, zinc, and lead as byproducts. It had about two decades of gold reserves along with significant byproduct reserves at end December 2023.
Understanding the Numbers: Newmont's Finances
Market Capitalization: Positioned above industry average, the company's market capitalization underscores its superiority in size, indicative of a strong market presence.
Revenue Growth: Over the 3 months period, Newmont showcased positive performance, achieving a revenue growth rate of 23.66% as of 31 December, 2023. This reflects a substantial increase in the company's top-line earnings. As compared to competitors, the company encountered difficulties, with a growth rate lower than the average among peers in the Materials sector.
Net Margin: Newmont's net margin is below industry averages, indicating potential challenges in maintaining strong profitability. With a net margin of -79.81%, the company may face hurdles in effective cost management.
Return on Equity (ROE): Newmont's ROE is below industry standards, pointing towards difficulties in efficiently utilizing equity capital. With an ROE of -13.13%, the company may encounter challenges in delivering satisfactory returns for shareholders.
Return on Assets (ROA): Newmont's ROA is below industry averages, indicating potential challenges in efficiently utilizing assets. With an ROA of -6.75%, the company may face hurdles in achieving optimal financial returns.
Debt Management: Newmont's debt-to-equity ratio surpasses industry norms, standing at 0.33. This suggests the company carries a substantial amount of debt, posing potential financial challenges.
The Significance of Analyst Ratings Explained
Within the domain of banking and financial systems, analysts specialize in reporting for specific stocks or defined sectors. Their work involves attending company conference calls and meetings, researching company financial statements, and communicating with insiders to publish "analyst ratings" for stocks. Analysts typically assess and rate each stock once per quarter.
Some analysts also offer predictions for helpful metrics such as earnings, revenue, and growth estimates to provide further guidance as to what to do with certain tickers. It is important to keep in mind that while stock and sector analysts are specialists, they are also human and can only forecast their beliefs to traders.
This article was generated by Benzinga's automated content engine and reviewed by an editor.
Edge Rankings
Price Trend
© 2025 Benzinga.com. Benzinga does not provide investment advice. All rights reserved.
date | ticker | name | Price Target | Upside/Downside | Recommendation | Firm |
|---|
Trade confidently with insights and alerts from analyst ratings, free reports and breaking news that affects the stocks you care about.

