

During the last three months, 4 analysts shared their evaluations of CME Gr CME, revealing diverse outlooks from bullish to bearish.
In the table below, you'll find a summary of their recent ratings, revealing the shifting sentiments over the past 30 days and comparing them to the previous months.
| Bullish | Somewhat Bullish | Indifferent | Somewhat Bearish | Bearish | |
|---|---|---|---|---|---|
| Total Ratings | 1 | 0 | 3 | 0 | 0 |
| Last 30D | 0 | 0 | 1 | 0 | 0 |
| 1M Ago | 1 | 0 | 0 | 0 | 0 |
| 2M Ago | 0 | 0 | 1 | 0 | 0 |
| 3M Ago | 0 | 0 | 1 | 0 | 0 |
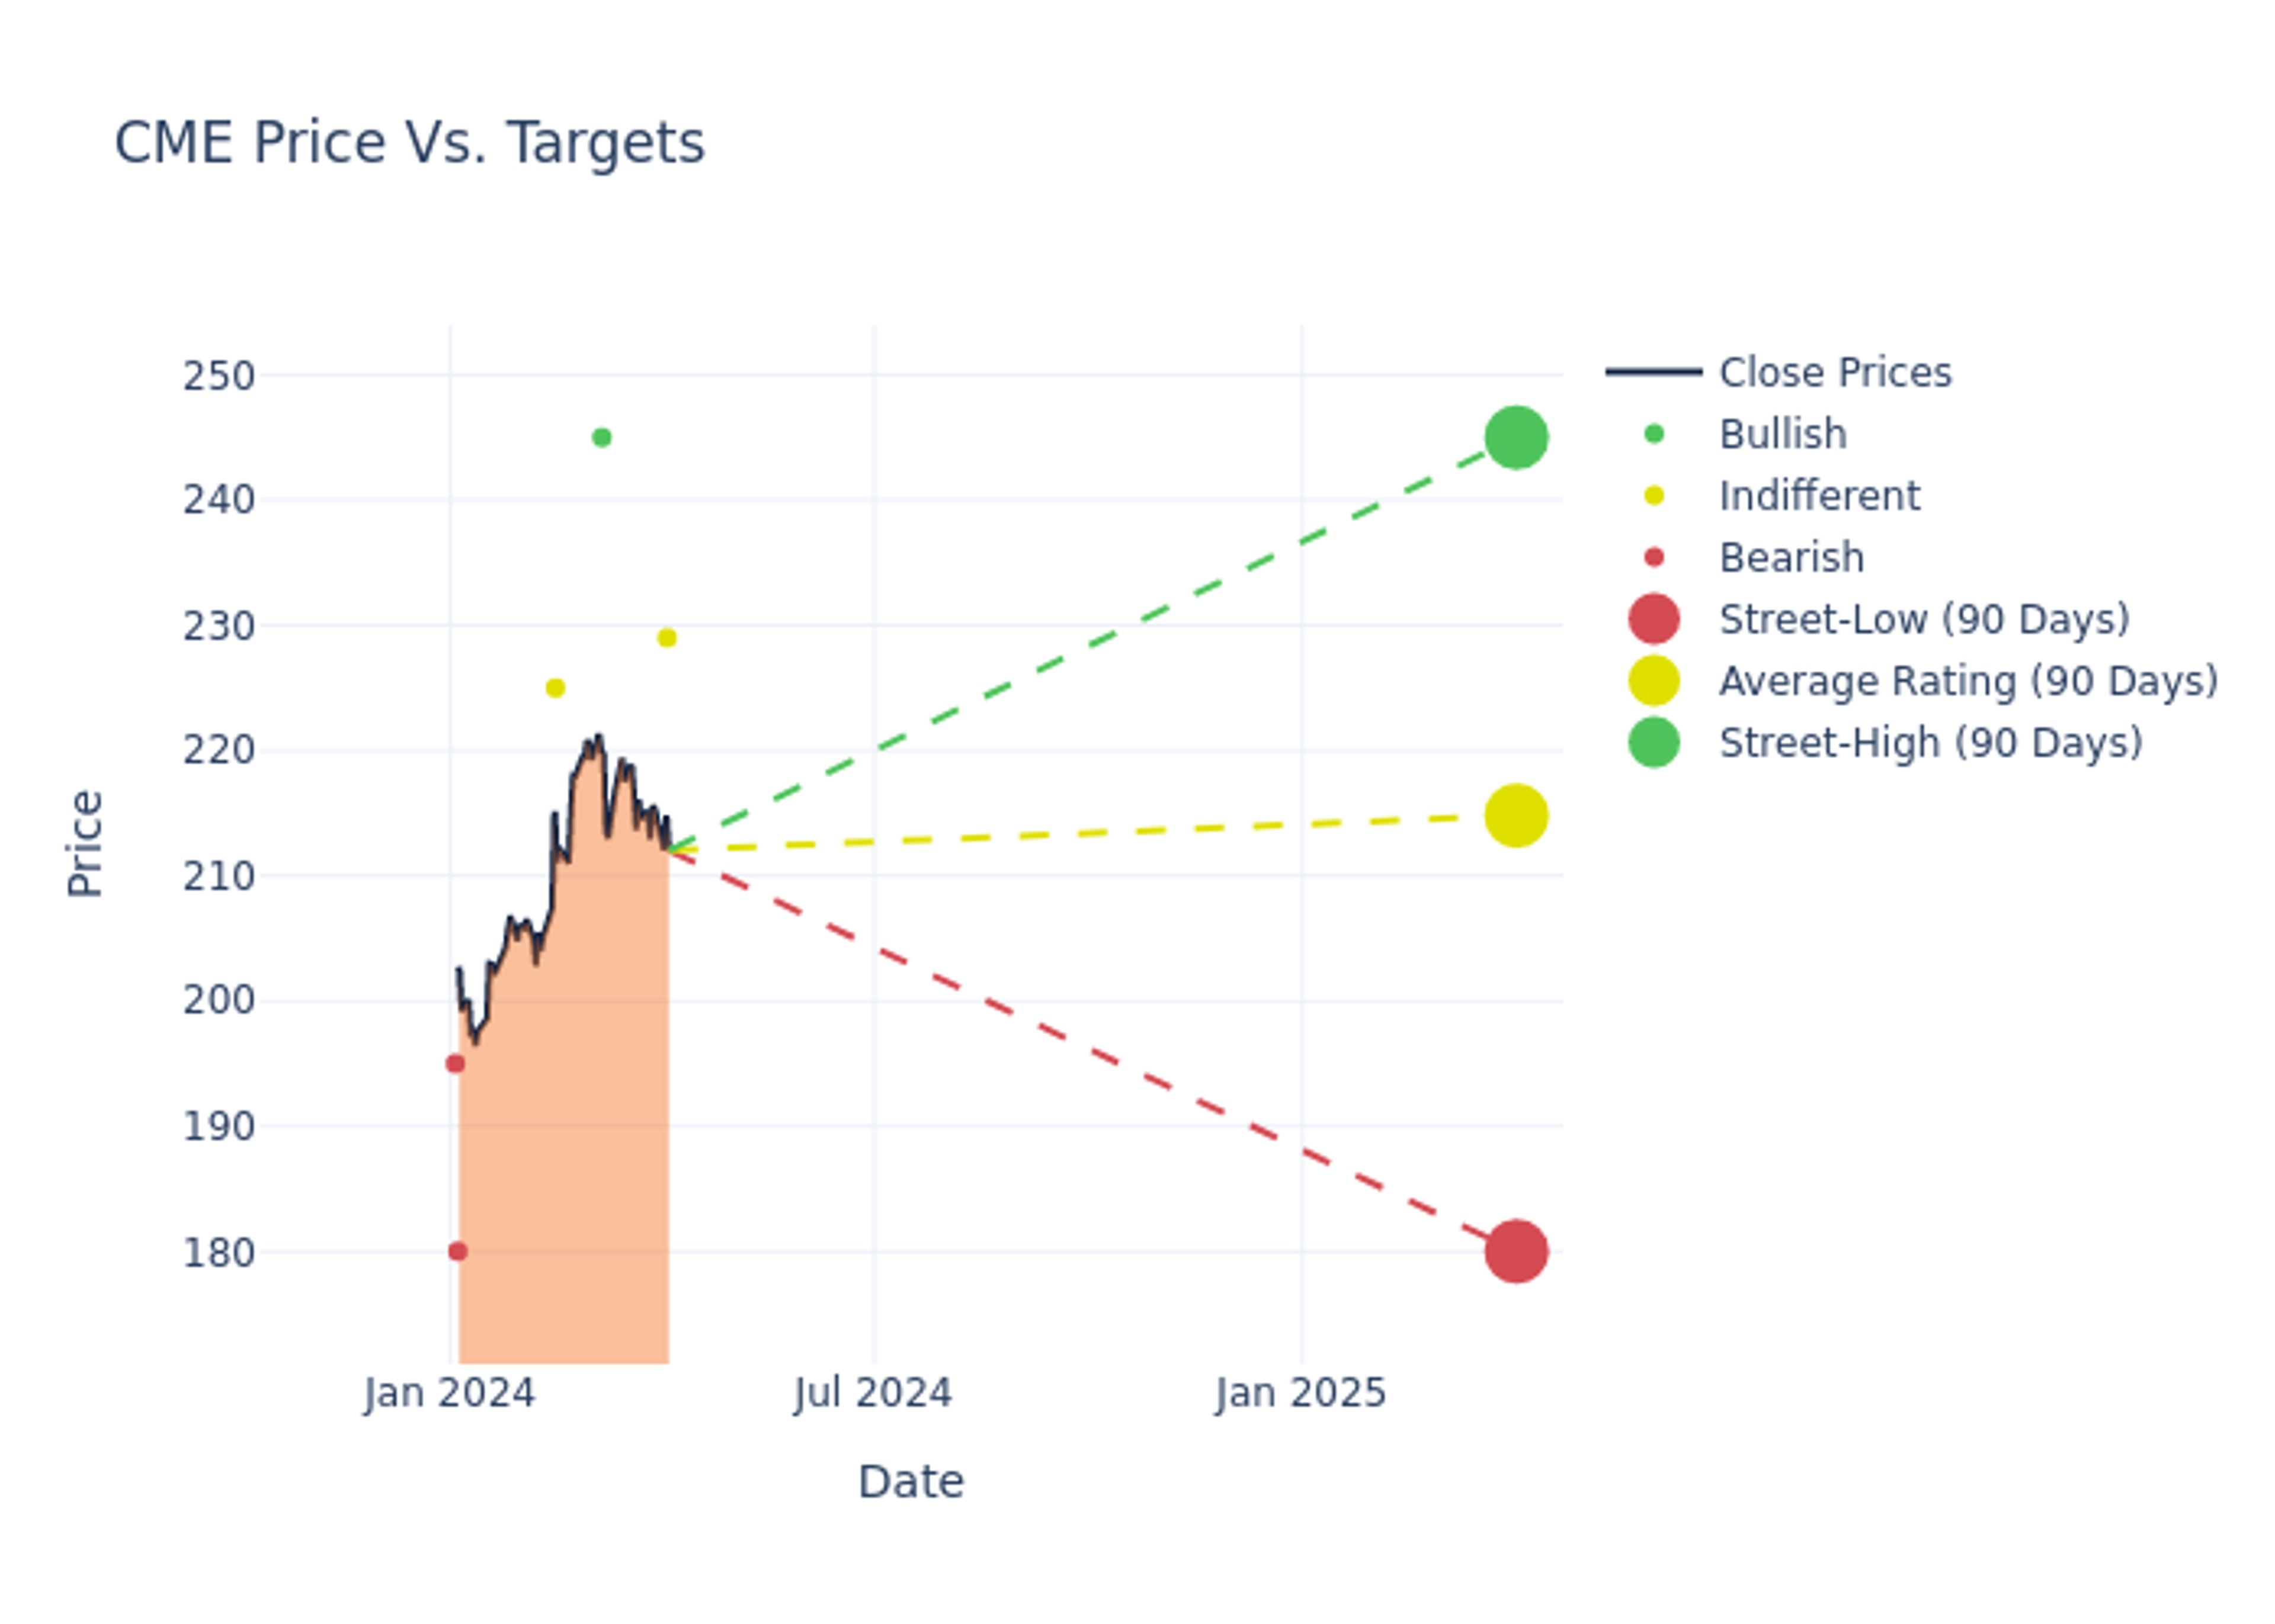
Analysts provide deeper insights through their assessments of 12-month price targets, revealing an average target of $230.25, a high estimate of $245.00, and a low estimate of $222.00. A negative shift in sentiment is evident as analysts have decreased the average price target by 0.03%.

Investigating Analyst Ratings: An Elaborate Study
An in-depth analysis of recent analyst actions unveils how financial experts perceive CME Gr. The following summary outlines key analysts, their recent evaluations, and adjustments to ratings and price targets.
| Analyst | Analyst Firm | Action Taken | Rating | Current Price Target | Prior Price Target |
|---|---|---|---|---|---|
| Kyle Voigt | Keefe, Bruyette & Woods | Maintains | Market Perform | $229.00 | - |
| Kevin Heal | Argus Research | Raises | Buy | $245.00 | $225.00 |
| Benjamin Budish | Barclays | Raises | Equal-Weight | $225.00 | $222.00 |
| Benjamin Budish | Barclays | Lowers | Equal-Weight | $222.00 | $244.00 |
Key Insights:
- Action Taken: In response to dynamic market conditions and company performance, analysts update their recommendations. Whether they 'Maintain', 'Raise', or 'Lower' their stance, it signifies their reaction to recent developments related to CME Gr. This insight gives a snapshot of analysts' perspectives on the current state of the company.
- Rating: Analysts unravel qualitative evaluations for stocks, ranging from 'Outperform' to 'Underperform'. These ratings offer insights into expectations for the relative performance of CME Gr compared to the broader market.
- Price Targets: Analysts gauge the dynamics of price targets, providing estimates for the future value of CME Gr's stock. This comparison reveals trends in analysts' expectations over time.
For valuable insights into CME Gr's market performance, consider these analyst evaluations alongside crucial financial indicators. Stay well-informed and make prudent decisions using our Ratings Table.
Stay up to date on CME Gr analyst ratings.
Unveiling the Story Behind CME Gr
Based in Chicago, CME Group operates exchanges giving investors, suppliers, and businesses the ability to trade futures and derivatives based on interest rates, equity indexes, foreign currencies, energy, metals, and commodities. The CME was founded in 1898 and in 2002 completed its initial public offering. Since then, CME Group has consolidated parts of the industry by merging with crosstown rival, CBOT Holdings in 2007 before acquiring Nymex Holdings in 2008 and NEX in 2018. In addition, the company has a 27% stake in S&P Dow Jones Indices, making the Chicago Mercantile Exchange the exclusive venue to trade and clear S&P futures contracts. Through CME's acquisition of NEX in 2018, it has also expanded into cash foreign exchange, fixed income trading, and collateral optimization.
CME Gr: Delving into Financials
Market Capitalization Analysis: With an elevated market capitalization, the company stands out above industry averages, showcasing substantial size and market acknowledgment.
Positive Revenue Trend: Examining CME Gr's financials over 3 months reveals a positive narrative. The company achieved a noteworthy revenue growth rate of 19.17% as of 31 December, 2023, showcasing a substantial increase in top-line earnings. In comparison to its industry peers, the company trails behind with a growth rate lower than the average among peers in the Financials sector.
Net Margin: The company's net margin is a standout performer, exceeding industry averages. With an impressive net margin of 55.88%, the company showcases strong profitability and effective cost control.
Return on Equity (ROE): CME Gr's ROE stands out, surpassing industry averages. With an impressive ROE of 2.93%, the company demonstrates effective use of equity capital and strong financial performance.
Return on Assets (ROA): CME Gr's ROA is below industry standards, pointing towards difficulties in efficiently utilizing assets. With an ROA of 0.63%, the company may encounter challenges in delivering satisfactory returns from its assets.
Debt Management: CME Gr's debt-to-equity ratio is below the industry average at 0.13, reflecting a lower dependency on debt financing and a more conservative financial approach.
Analyst Ratings: Simplified
Within the domain of banking and financial systems, analysts specialize in reporting for specific stocks or defined sectors. Their work involves attending company conference calls and meetings, researching company financial statements, and communicating with insiders to publish "analyst ratings" for stocks. Analysts typically assess and rate each stock once per quarter.
In addition to their assessments, some analysts extend their insights by offering predictions for key metrics such as earnings, revenue, and growth estimates. This supplementary information provides further guidance for traders. It is crucial to recognize that, despite their specialization, analysts are human and can only provide forecasts based on their beliefs.
This article was generated by Benzinga's automated content engine and reviewed by an editor.
Edge Rankings
Price Trend
© 2025 Benzinga.com. Benzinga does not provide investment advice. All rights reserved.
date | ticker | name | Price Target | Upside/Downside | Recommendation | Firm |
|---|
Trade confidently with insights and alerts from analyst ratings, free reports and breaking news that affects the stocks you care about.

