

Comcast CMCSA has been analyzed by 4 analysts in the last three months, revealing a diverse range of perspectives from bullish to bearish.
The table below provides a concise overview of recent ratings by analysts, offering insights into the changing sentiments over the past 30 days and drawing comparisons with the preceding months for a holistic perspective.
| Bullish | Somewhat Bullish | Indifferent | Somewhat Bearish | Bearish | |
|---|---|---|---|---|---|
| Total Ratings | 1 | 0 | 3 | 0 | 0 |
| Last 30D | 0 | 0 | 1 | 0 | 0 |
| 1M Ago | 1 | 0 | 1 | 0 | 0 |
| 2M Ago | 0 | 0 | 1 | 0 | 0 |
| 3M Ago | 0 | 0 | 0 | 0 | 0 |
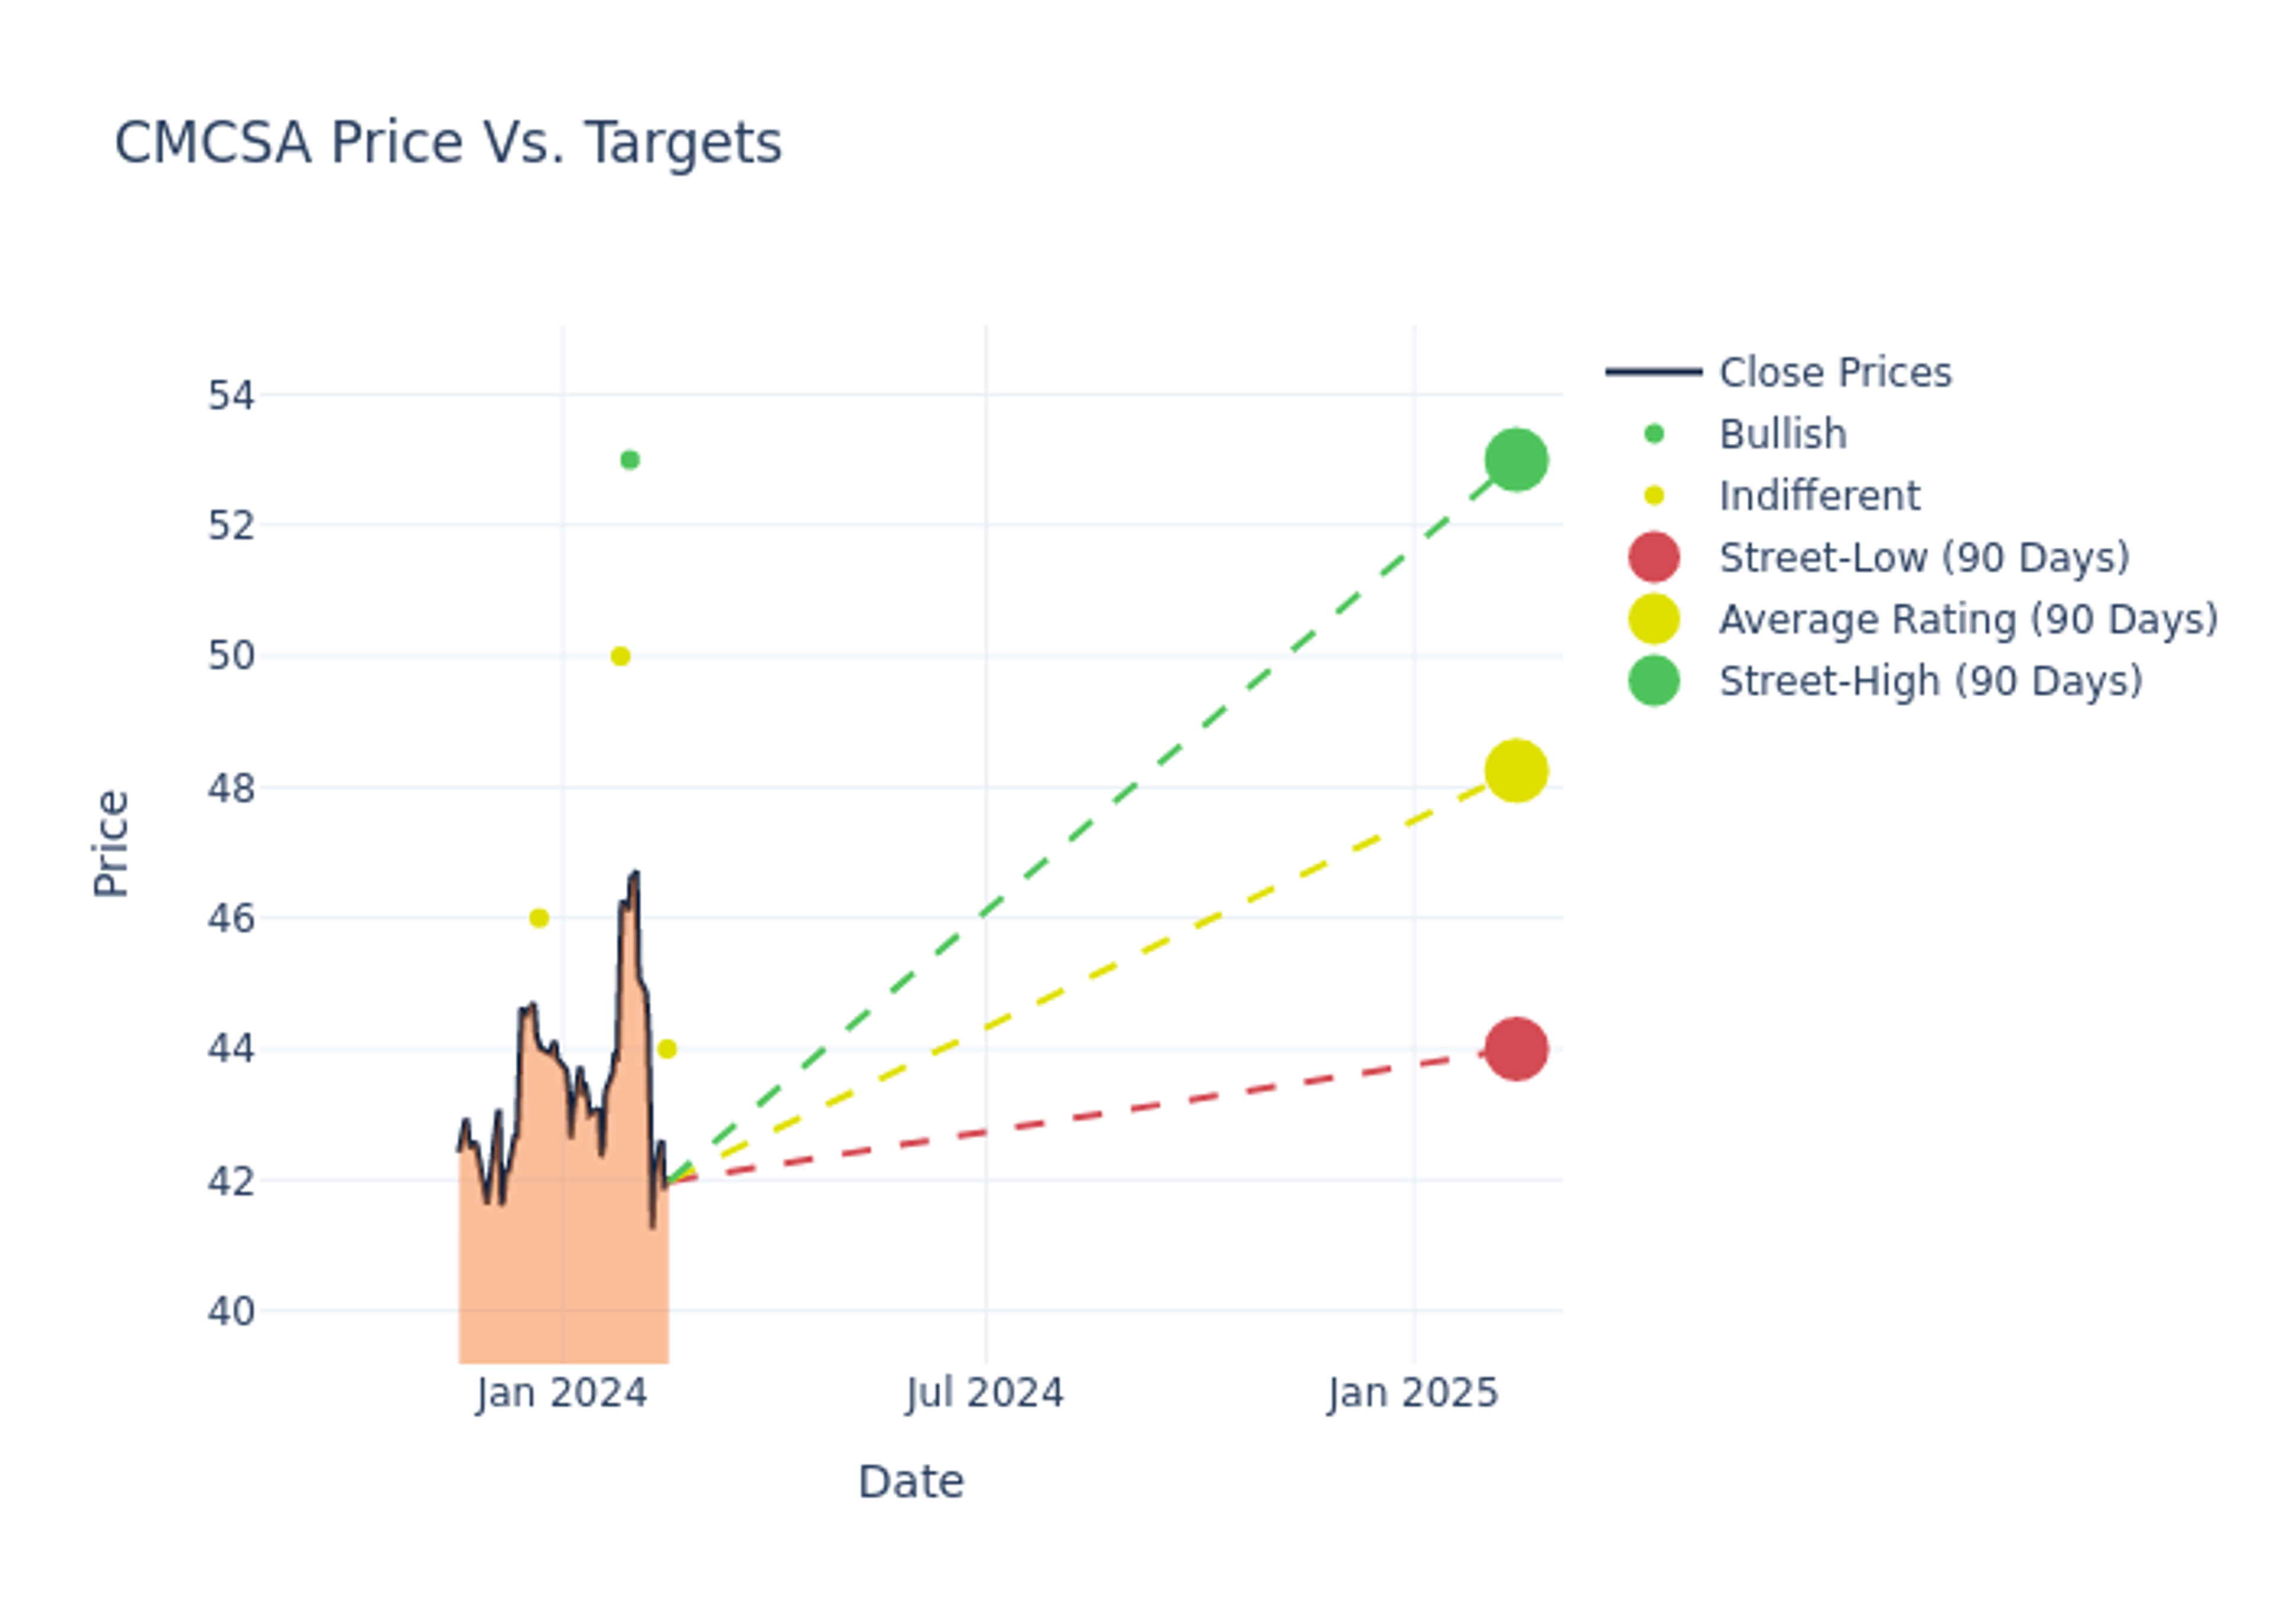
Analysts' evaluations of 12-month price targets offer additional insights, showcasing an average target of $48.25, with a high estimate of $53.00 and a low estimate of $44.00. This upward trend is evident, with the current average reflecting a 1.58% increase from the previous average price target of $47.50.

Analyzing Analyst Ratings: A Detailed Breakdown
The standing of Comcast among financial experts becomes clear with a thorough analysis of recent analyst actions. The summary below outlines key analysts, their recent evaluations, and adjustments to ratings and price targets.
| Analyst | Analyst Firm | Action Taken | Rating | Current Price Target | Prior Price Target |
|---|---|---|---|---|---|
| Hamilton Faber | Redburn Atlantic | Lowers | Neutral | $44.00 | $50.00 |
| Michael Rollins | Citigroup | Raises | Buy | $53.00 | $51.00 |
| Steven Cahall | Wells Fargo | Raises | Equal-Weight | $50.00 | $45.00 |
| Barton Crockett | Rosenblatt | Raises | Neutral | $46.00 | $44.00 |
Key Insights:
- Action Taken: Analysts frequently update their recommendations based on evolving market conditions and company performance. Whether they 'Maintain', 'Raise' or 'Lower' their stance, it reflects their reaction to recent developments related to Comcast. This information provides a snapshot of how analysts perceive the current state of the company.
- Rating: Unveiling insights, analysts deliver qualitative insights into stock performance, from 'Outperform' to 'Underperform'. These ratings convey expectations for the relative performance of Comcast compared to the broader market.
- Price Targets: Analysts explore the dynamics of price targets, providing estimates for the future value of Comcast's stock. This examination reveals shifts in analysts' expectations over time.
Analyzing these analyst evaluations alongside relevant financial metrics can provide a comprehensive view of Comcast's market position. Stay informed and make data-driven decisions with the assistance of our Ratings Table.
Stay up to date on Comcast analyst ratings.
Delving into Comcast's Background
Comcast is made up of three parts. The core cable business owns networks capable of providing television, internet access, and phone services to 62 million U.S. homes and businesses, or nearly half of the country. About 55% of the homes in this territory subscribe to at least one Comcast service. Comcast acquired NBCUniversal from General Electric in 2011. NBCU owns several cable networks, including CNBC, MSNBC, and USA, the NBC broadcast network, the Peacock streaming platform, several local NBC affiliates, Universal Studios, and several theme parks. Sky, acquired in 2018, is the dominant television provider in the U.K. and has invested heavily in proprietary content to build this position. Sky is also the largest pay-television provider in Italy and has a presence in Germany and Austria.
Key Indicators: Comcast's Financial Health
Market Capitalization Analysis: With a profound presence, the company's market capitalization is above industry averages. This reflects substantial size and strong market recognition.
Revenue Growth: Over the 3 months period, Comcast showcased positive performance, achieving a revenue growth rate of 2.29% as of 31 December, 2023. This reflects a substantial increase in the company's top-line earnings. As compared to competitors, the company surpassed expectations with a growth rate higher than the average among peers in the Communication Services sector.
Net Margin: Comcast's financial strength is reflected in its exceptional net margin, which exceeds industry averages. With a remarkable net margin of 10.43%, the company showcases strong profitability and effective cost management.
Return on Equity (ROE): Comcast's ROE stands out, surpassing industry averages. With an impressive ROE of 3.94%, the company demonstrates effective use of equity capital and strong financial performance.
Return on Assets (ROA): Comcast's ROA surpasses industry standards, highlighting the company's exceptional financial performance. With an impressive 1.24% ROA, the company effectively utilizes its assets for optimal returns.
Debt Management: The company maintains a balanced debt approach with a debt-to-equity ratio below industry norms, standing at 1.17.
Understanding the Relevance of Analyst Ratings
Analyst ratings serve as essential indicators of stock performance, provided by experts in banking and financial systems. These specialists diligently analyze company financial statements, participate in conference calls, and engage with insiders to generate quarterly ratings for individual stocks.
Some analysts publish their predictions for metrics such as growth estimates, earnings, and revenue to provide additional guidance with their ratings. When using analyst ratings, it is important to keep in mind that stock and sector analysts are also human and are only offering their opinions to investors.
This article was generated by Benzinga's automated content engine and reviewed by an editor.
Edge Rankings
Price Trend
© 2025 Benzinga.com. Benzinga does not provide investment advice. All rights reserved.
date | ticker | name | Price Target | Upside/Downside | Recommendation | Firm |
|---|
Trade confidently with insights and alerts from analyst ratings, free reports and breaking news that affects the stocks you care about.

