

iShares NASDAQ Biotechnology Index (ETF) IBB traders finally got the breakout they were looking for earlier this month when the ETF surged through the $300 level on strong volume. Benzinga pointed out that a breakout above $300 could lead to some major upside for traders back on June 16, and the breakout that followed sent the ETF as high as $323.27 within days.
But now that the IBB has cooled down a bit, traders need to reassess the situation and determine whether or not the breakout was for real and where the ETF could be headed next.
Related Link: Following Extended Consolidation Period, Biotech ETF's Next Breakout Could Be Big
Early indications are that the IBB breakout is not just a head-fake. After nearly six months without a single day of 3.5 million daily volume, the IBB delivered three straight days of 3.5 million-plus volume when it broke through the $300 level this month.
After jumping from around $290 to above $323 in a matter of four trading days, traders shouldn’t be surprised at the subsequent pullback to the $310 level. In fact, the IBB could even pull back to the $300 level and still have a very bullish technical chart at the moment. In the chart below, potential support levels are indicated by green lines, while resistance levels are red lines.

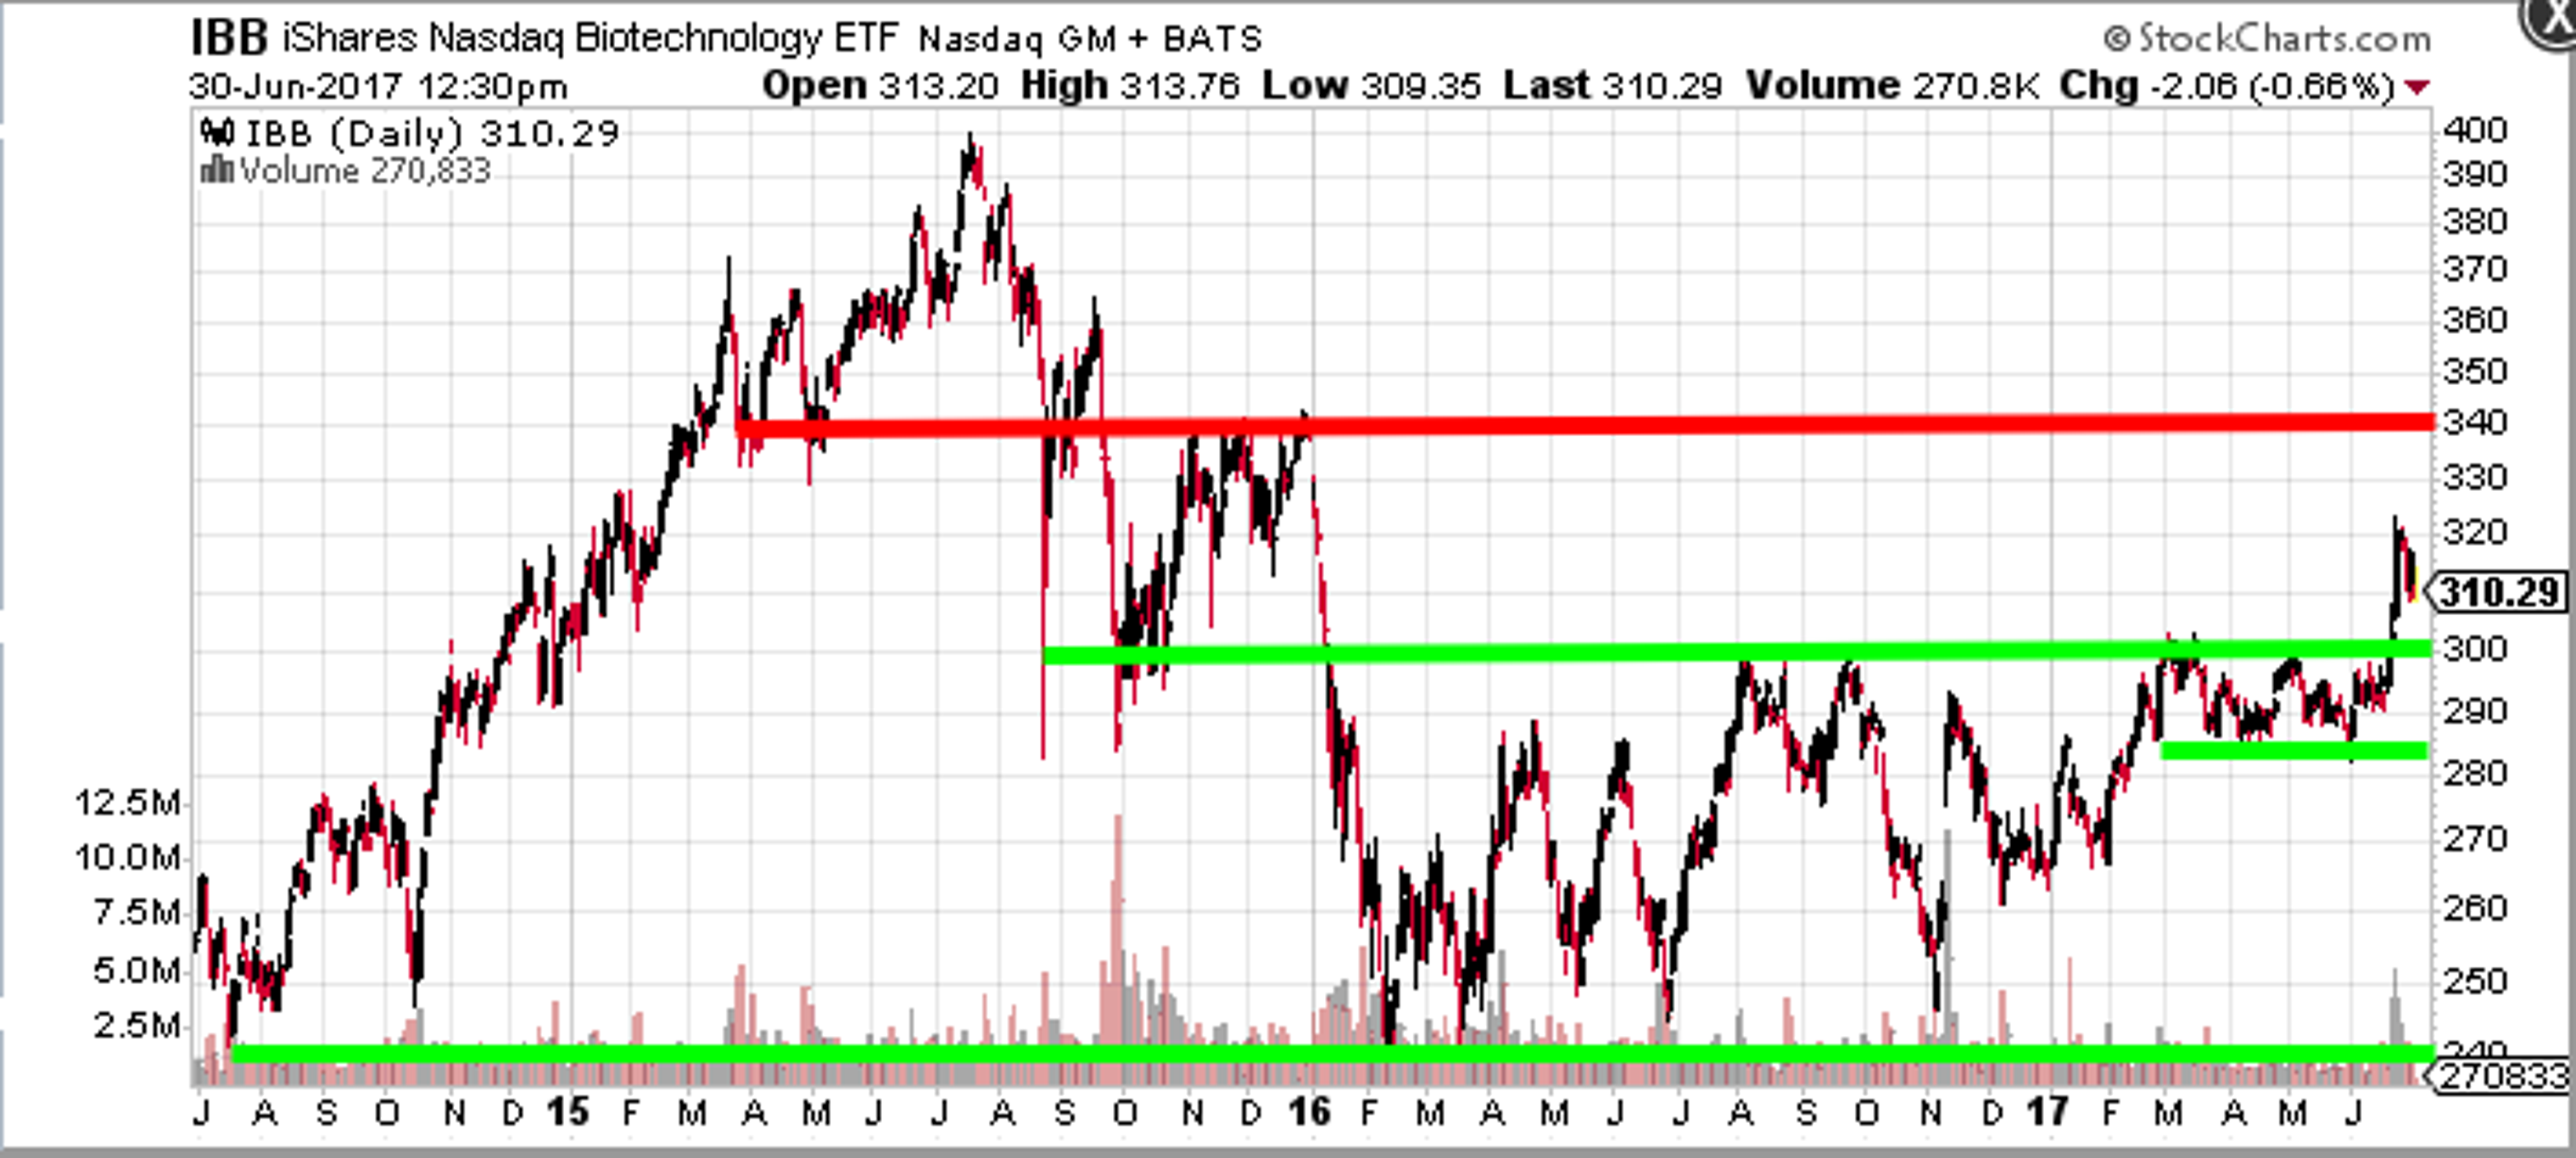
The $300 level was strong resistance dating back to the beginning of 2016. However, now that the IBB has broken through, $300 is a prime potential support level, especially considering it served as support in late 2015.
In fact, traders looking for a new longer-term trading range for the IBB should keep a close eye on the range in which the IBB traded for the final quarter of 2015. If the IBB regains its positive momentum and makes new 52-week highs above $323 in the coming weeks, traders should be looking to the $343 level as the next potential resistance level.
Edge Rankings
Price Trend
© 2025 Benzinga.com. Benzinga does not provide investment advice. All rights reserved.