Going overweight one investment instrument while pouring leverage to short another related instrument is a common portfolio strategy among institutional traders. But, aside from the capital requirements and sheer level of sophistication required, most retail traders would struggle to find a place to start in implementing this strategy.
However, the benefit of the ETF age is that retail traders can now access more complex portfolio strategies like relative weight investing—that is, going 150 percent long one instrument or market while going 50 percent short a correlated market—which can provide superior returns in the right conditions.
A new suite of relative weight ETFs from Direxion Investments allows retail traders to access the leverage needed to simultaneously play the long and short side of the market, increasing their portfolio’s exposure to multiple markets at once.
Direxion Head Of Product Dave Mazza explains, “If my analysis, or the research that I'm taking in, is offering me insights that emerging markets may be a better opportunity than international developed markets, or small-cap stocks may outperform large-cap stocks, or vice versa, a tool like this can be very powerful for an investor to compliment their long term strategic allocation that they likely have as well.”
For example, let’s compare the rolling one-year performance of the growth/value trade over the last 15 years. If you wanted to go overweight growth and underweight value, you could accomplish that by going long growth or by overweighting growth over value in your portfolio.
Both strategies would have worked for you, but there’s a third method that would have outperformed even further.
Direxion’s Russell 1000 Growth Over Value ETF, which holds 150 percent long exposure to the growth index and 50 percent short exposure to the value index, outperformed both strategies in 3,500 backtests. This relative weighting outperformed the long-growth trade 85 percent of the time and outperformed the overweight implementation 90 percent of the time.
Source: Bloomberg; for the period 12/31/2003 through 12/31/2018. The Russell 1000 Growth/Value 150/50 Net Spread Index returns represents PIP data which is hypothetical and based on criteria applied retroactively with the benefit of hindsight and knowledge of factors that may have positively affected its performance and cannot account for all financial risk that may affect the actual performance of the fund. See the Disclosure page for more info. Past performance is not indicative of future results. One cannot directly invest in an index.

Latest Startup Investment Opportunities:


Know The Risks
Although the relative weight ETFs are structured to be net 100 percent long with an additional 50 percent long and short components mitigating their risk profile, the use of leverage can cause them to stray from their benchmarks. Look at the Direxion Russell 1000 Value Over Growth ETF against the performance of the broad market from 2004-2018. This was a period in which value underperformed growth.
Source: Bloomberg, for the period 12/31/2003 through 12/31/2018. Annualized performance calculations used a 12-month calendar. The mountain chart represents rolling 3-year relative performance between the Russell 1000 Growth Index and the Russell 1000 Index. The line chart represents rolling 3-year relative performance between the Russell 1000 Growth/Value 150/50 Net Spread Index and the Russell 1000 Index. Tracking error calculations utilized annualized performance calculations based on a 12-month calendar. The Russell 1000 Growth/Value 150/50 Net Spread Index returns represents PIP data which is hypothetical and based on criteria applied retroactively with the benefit of hindsight and knowledge of factors that may have positively affected its performance and cannot account for all financial risk that may affect the actual performance of the fund. See the Disclosure page for more info. Past performance is not indicative of future results. One cannot directly invest in an index.

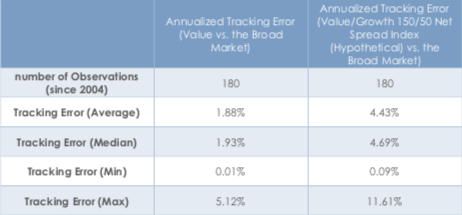
It’s important to understand that the added risk of tracking error in the relative-weight ETFs is both a key component of its ability to outperform similar strategies when correct, but may also introduce greater drawdown risk in the event that the market call is incorrect.
As Direxion V.P of Product & Institutional Strategy Inkoo Kang put it, the new relative weight ETFs “amplify exposures and peg one market segment over another in the attempt to capture that spread. That introduces the opportunity for tracking error risk. If you're on the right side of the trade, and your research has sort of led you the right way, that tracking error risk has led to the opportunity to outperform your benchmark. But when the call is wrong, you could suffer and underperform your benchmark.”
The sum of all this data shows that, when measured over 12 month periods, the return/risk profile of the 150/50 net spread strategy implemented in Direxion’s relative weight ETF can carry greater returns over either an entirely long strategy or a 75/25 overweight strategy without significantly altering the investment risk profile—so long as the market call is correct.
For the active investor with an intermediate time horizon, the relative weighting strategy offered by Direxion’s lineup of ETFs provides a chance to capture increase returns based on cyclical market patterns.
Direxion is a content partner of Benzinga
© 2025 Benzinga.com. Benzinga does not provide investment advice. All rights reserved.
Trade confidently with insights and alerts from analyst ratings, free reports and breaking news that affects the stocks you care about.

