
Stocks made new record highs, with the S&P 500 setting an intraday high of 5,261.10 and a closing high of 5,241.53 on Thursday. For the week, the S&P increased 2.3% to close at 5,234.18. The index is now up 9.7% year to date and up 46.3% from its October 12, 2022 closing low of 3,577.03.
Just because something happens much of the time doesn’t mean it happens all of the time. This is true for the stock market, the economy, and probably everything else in our lives.
In recent years, we’ve learned this is true of two of the most popular and historically consistent recession indicators: the yield curve and the Conference Board’s Leading Economic Index.
The Inverted Yield Curve
The yield curve represents the shape that forms on a chart when you plot the interest rate, or yield, for Treasury debt securities with various maturities. Typically, shorter-term rates like the yield on the 2-year Treasury note will be lower than the yield on the 10-year Treasury note.
The yield curve inverts when a longer term rate is lower than a shorter term rate (e.g., when the yield on the 10-year note is lower than yield on the 2-year note).
Historically, when the yield on the 10-year note falls below the yield on the 2-year note (i.e., when the “2s10s” yield curve inverts), recessions have been somewhat soon to follow.
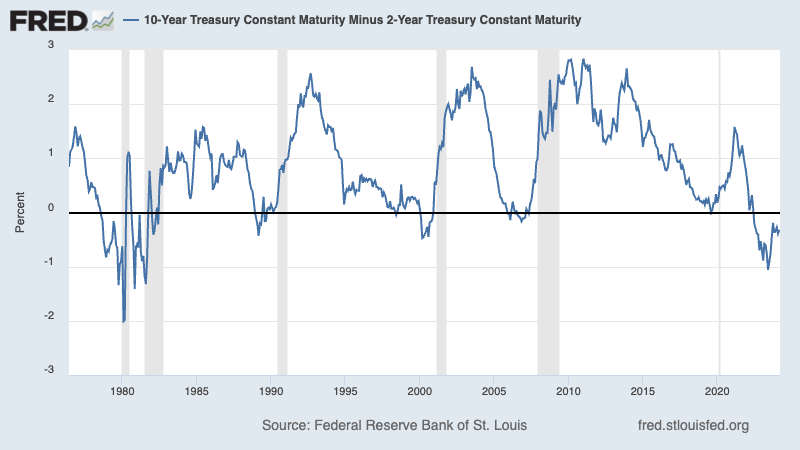
When the line dipped below the X-axis, a recession usually followed. FRED
Two years ago, the 2s10s yield curve inverted, which emboldened economists who were warning of an impending recession.
We’re still waiting for that recession.
Deutsche Bank’s Jim Reid noted that on Wednesday “we passed the longest continuous U.S. 2s10s inversion in history. Although the 2s10s first inverted at the end of March 2022, it has now been continuously inverted for 625 days since July 5th 2022. That exceeds the 624 day inversion from August 1978, which previously held the record.“
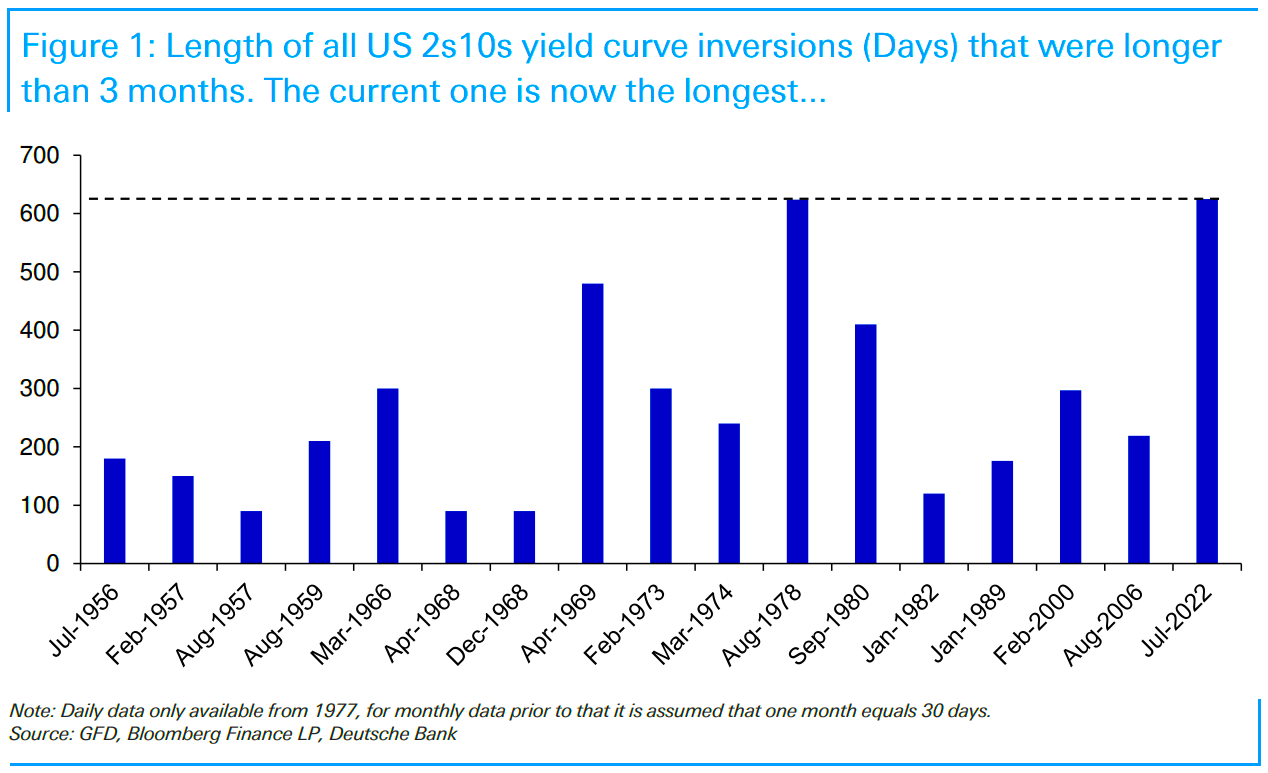
This has been the longest 2s10s inversion in history. (Source: Deutsche Bank)
While the inverted yield curve may have a good track record of predicting recessions, it’s not very precise in predicting when recessions will start. According to a Goldman Sachs analysis of 2s10s inversions since 1965, seven to 49 months passed before recessions occurred, with a median of 20 months.
So, the economy could go into recession a week, a month, or a year from now, which would arguably confirm the inverted yield curve’s signal.
That said, one has to question the value of an indicator that sometimes leads events by two to four years.
As Oaktree Capital’s Howard Marks says, “Being too far ahead of your time is indistinguishable from being wrong.“
The Falling Leading Economic Index
The Conference Board’s Leading Economic Index (LEI) — a composite of market and economic metrics — has had a strong track record of predicting recessions, specifically when its six-month average change is negative.
Over the past two years, it too had been signaling a recession that hasn’t come.
And last month, in its January update, The Conference Board said the LEI’s signal flipped positive. From The Conference Board’s Justyna Zabinska-La Monica:
“While the declining LEI continues to signal headwinds to economic activity, for the first time in the past two years, six out of its ten components were positive contributors over the past six-month period (ending in January 2024). As a result, the leading index currently does not signal recession ahead. While no longer forecasting a recession in 2024, we do expect real GDP growth to slow to near zero percent over Q2 and Q3.“
On Wednesday, The Conference Board confirmed that the positive developments continued into February.
“The U.S. LEI rose in February 2024 for the first time since February 2022,” Zabinska-La Monica said. “Strength in weekly hours worked in manufacturing, stock prices, the Leading Credit Index, and residential construction drove the LEI’s first monthly increase in two years.“
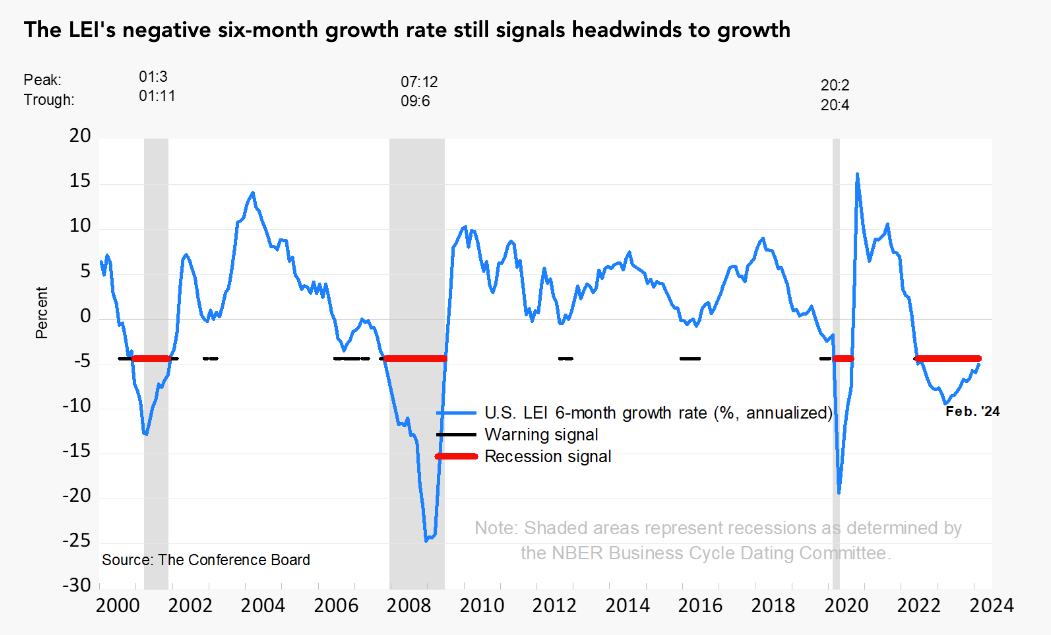
The LEI’s recession signal hasn’t worked out this time. (Source: The Conference Board)
Yardeni Research’s Ed Yardeni and Renaissance Macro’s Neil Dutta are among Wall Street data nerds who’ve pointed out more serious issues with LEI.
The bottom line: The LEI’s signal that people have been citing has been off.
Zooming Out
I think it’s good to heed the warnings of the popular recession indicators. But just because a metric is usually right doesn’t mean it will be right the next time around.
Furthermore, it’s never smart to rely too heavily on the signal of a single metric. Whether it’s interest rates, P/E ratios, or one of these recession indicators, any metric should be considered in the context of other relevant metrics.
The recessionary signals we’ve been reading about over the past two years have come amid massive bullish tailwinds like record job openings and excess savings, which have proven to be more reliable leading indicators during the current economic cycle.
Maybe next time the yield curve and the LEI will be right and timely. But not this time.
A version of this post was originally published on Tker.co.
© 2025 Benzinga.com. Benzinga does not provide investment advice. All rights reserved.
Trade confidently with insights and alerts from analyst ratings, free reports and breaking news that affects the stocks you care about.

