
Zinger Key Points
- Long-duration Treasury bonds entered a bull market for the first time in more than three yeers.
- Technical analysis shows TLT ETF at a pivotal juncture, with the potential for a pullback due to an overbought signal.
- Get the Strategy to Trade Pre-Fed Setups and Post-Fed Swings—Live With Chris Capre on Wednesday, June 11.
Long-duration Treasury bonds, a cornerstone of many investment portfolios, have recently recovered from a bear market that commenced in August 2020. This downturn led to a significant reduction in value, with a maximum drawdown exceeding 50% at their lowest point.
The iShares 20+ Year Treasury Bond ETF TLT, the leading ETF linked to Treasury bonds and a widely-tracked barometer of long-term Treasury performance, has officially entered a bull market, following a remarkable 20% rally from its October lows.
TLT Enters A Bull Market: What Happens Next?
The sudden drop in yields on 30-year bonds from 5.2% to the current 4% over the past two months has been tantamount to the bond’s price rally. This has been driven by a combination of factors, including a continued deceleration of inflation and the Federal Reserve’s remarkably dovish stance.
During the year-end Federal Open Market Committee (FOMC) meeting, the committee hinted at the possibility of a 75 basis point rate cut in 2024, at least according to its ‘dot plot’ projections. However, the market, always forward-looking, seems to be pricing in an even more aggressive rate cut scenario.
Read also: ‘Magnificent 7’ Widens Gap With Rest Of S&P 500, But That May Change In 2024
The Dynamics of Bond Performance
Bonds traditionally thrive in environments with falling interest rates, as lower yields tend to boost the value of fixed-income assets.
In the context of bonds, an economic downturn in 2024 could create an even more favorable situation, as it would intensify the pressure on the Federal Reserve to lower interest rates.
The 2024 performance of U.S. Treasuries will significantly depend on the Federal Reserve’s readiness to lower interest rates. The timing of any rate cut will be contingent upon the speed at which inflation reaches its 2% target and the likelihood of the Fed commencing interest rate reductions.
Technical Analysis: TLT ETF At A Crossroads
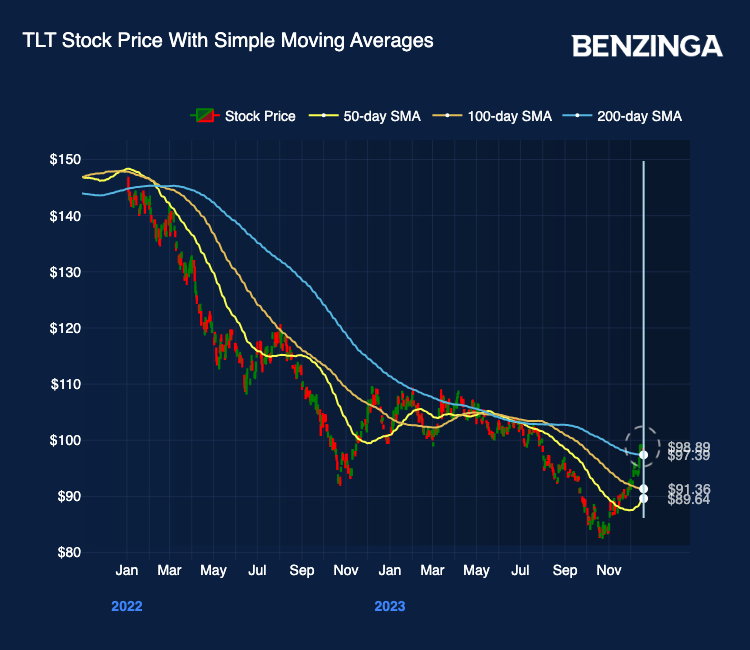
From a technical perspective, the TLT ETF finds itself at a pivotal juncture, testing the crucial range between 99 and 100 per share. This level served as robust technical support on four separate occasions over the past year before experiencing a sharp breakdown in August.
Furthermore, the TLT has recently breached the 200-day moving average, a significant technical resistance level that had held firm since January 2022, barring a few false breakouts in April of this year.

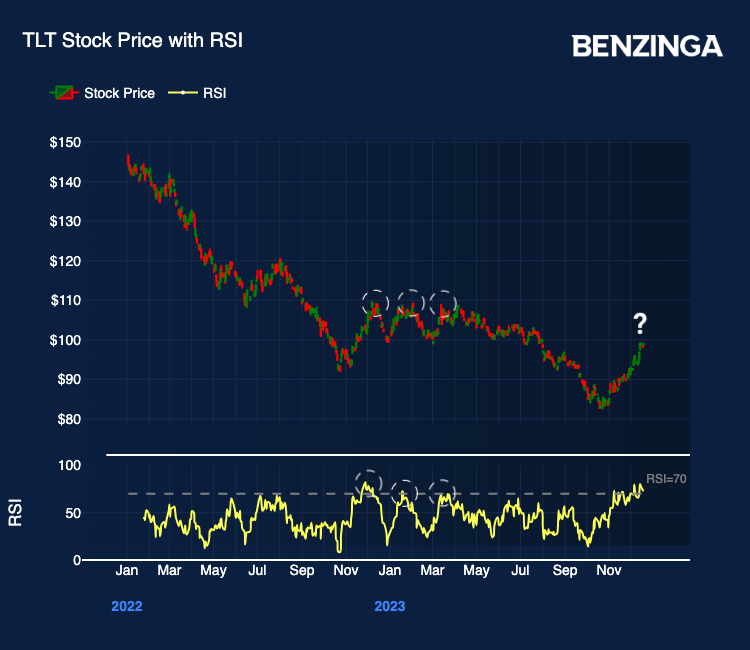
However, amid all these promising technical factor, it’s essential to keep an eye on another critical signal. The daily Relative Strength Index (RSI), a key indicator for gauging trend strength, has now surged past the 70 level, entering the overbought zone.
In prior instances, when the TLT ETF reached an overbought technical level, it often coincided with price peaks followed by bearish price action, signaling a need for caution as we approach the new year.
Read now: US Mortgage Rates Drop To 6-Month Low: A Turning Point For The Housing Market?
Photo: Shutterstock
Edge Rankings
Price Trend
© 2025 Benzinga.com. Benzinga does not provide investment advice. All rights reserved.
Trade confidently with insights and alerts from analyst ratings, free reports and breaking news that affects the stocks you care about.

