2024 Outlook: Put, Pause, Pivot

2024 Outlook

Key Forecasts
Inflation: Core disinflation but only to the top of the FOMC’s 3%-2% comfort zone
Unemployment: Headed well above 4%, likely to be the trigger for the coming Fed pivot
Growth: Consumption and investment are slowing, but unlikely to go significantly negative
Earnings: Weaker than forecast 1H24, leading to mid-single digit growth, below consensus of 11%
Fed Policy Rate: First cut in March, 100bp total will stabilize the bank credit contraction
S&P 500: The first 10% move likely to be down to 4100, followed by a recovery in 2H24 to 5100
USTs: Curve disinversion by mid-year, slightly higher back-end rates at YE24
Sector Allocation: Overweight Industrials, Materials, Energy, Underweight Financials & Small Caps

A Rocky Transition To A Fed Pivot

In our 2023 outlook note, 9 to 4, but then what, we expected disinflation to act as a major tailwind for both equities and fixed income until headline inflation bottomed out with the June readings. One development we did not expect was the banking crisis in March resulting from the FOMC making the second of three hawkish communication errors during the rate hike cycle. It was clear to us in September ‘22 that when the Fed raised the policy rate above 3%, they had reached what the NY Fed calls r**, the financial stability rate. In essence when the Fed’s System Open Market Account (SOMA) remittances to the Treasury ended, both the Fed and banking system were losing money on the massive securities holdings they accumulated during ‘20 and ‘21. The struggles in the banking system were not an isolated event, while not systemic for the largest banks, the losses froze a large percent of assets leading to an outright credit contraction. The market’s reaction, bank stocks falling to a discount to book value, was a clear message the Fed failed to hear, and they hiked three more times.

In August, following the signing of the Fiscal Responsibility Act, an unexpected $500 billion in Treasury coupon supply triggered a sharp move higher in longer maturity nominal and real rates. In September, the Fed made their third hawkish communication mistake by threatening to maintain a policy rate above 5% for 15 months, and the UST selloff accelerated. Actions by the Fed and Treasury, as well as cooperative inflation and labor market data stopped the three-month UST bear steepening, dollar rally, and equity market correction, for now.

In the first of our three year-end notes, we will work through the policy, economic, earnings, and markets outlooks for 2024. In last year’s outlook we expected a favorable environment for equities and Treasuries early in the year and a more difficult second half. For 2024, we expect a difficult start for equities due to a deteriorating growth and earnings outlook, a period of consolidation through mid-year when the Fed begins reversing excessively restrictive policy, and a late rally that leads to decent returns. The correlation of equities and Treasuries is unlikely to be similar to 2023, early in the year weaker growth will lead to a rally in the front end of the Treasury curve, but supply will weigh on the back end throughout 2024. One important point, the loosening of financial conditions in November is not sufficient to move the policy setting from excessive to merely tight, 100bp of cuts in 2024 are the minimum requirement to disinvert the yield curve and loosen the bank credit channel sufficiently to facilitate supply of Treasuries, as well as a range of private sector debt maturities and financing needs.

Policy Outlook: Put, Pause, Pivot

Approaching The Fiscal Limit

While ‘it’s never different this time’, it is rarely the same as the last time. The critical change between the ‘20s and the ‘10s, and the policy impact on financial markets, is the largest stock of government debt since WWII and aggressive debt management by the Yellen Treasury. In 2021, cash management by the Treasury turbocharged monetary liquidity injections and the performance of risky assets. In 2022, increased issuance began withdrawing liquidity before the Fed ended asset purchases and the liquidity injections associated with QE, thereby kicking off the 27% S&P 500 10-month correction. In 2023, the inability to issue debt through 1H23 due to the debt ceiling offset QT keeping liquidity abundant, which contributed to a strong first half for equities. During 3Q23 both the Treasury and the Fed were draining liquidity, and when the Treasury attempted to issue longer maturities and the Fed forecasted a 5+% policy rate through 1H24, a vicious Treasury market bear steepening that increased 30-year real rates 100bp and 10% equity market correction led by banks and small caps sent a message that the US was approaching its fiscal limit.

As the rate hike cycle winds down, the focus on balance sheet contraction and the interaction of QT with Treasury supply, as we discussed in our recent note, New Sheriff in Town, the Treasury Department, will intensify. There are three transmission channels for large scale asset purchases: liquidity, real rates and fixed income volatility. Given the size of debt and deficits, Treasury debt management will continue to have a larger impact than the Fed’s passive QT process on liquidity and real rates, while the supply of implied volatility is driven by the mortgage-backed securities market. The Treasury market rallied sharply following the October Treasury Quarterly Refunding Announcement that slowed the rate of longer maturity issuance, shifting towards the belly of the curve (2s-7s) and bills, aided by a shift in monetary policy away from additional hikes. In our analysis, a Fed pivot driven by lower employment will stabilize the Treasury market during 1H24, however, higher real rates and a continuation of rising term premiums are a secular trend.


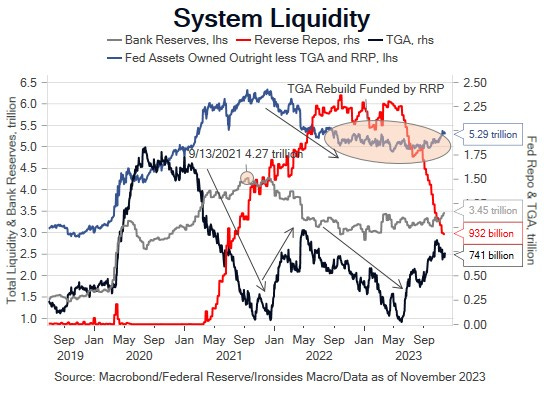
Figure 1: We define liquidity as Fed assets owned outright (not temporary loans) less reverse repo loans (RRP) and the Treasury General Account (TGA). Assets in RRP and TGA can’t not be loaned to the private sector, bank reserves can, although we suspect banks are hoarding reserves due to losses on securities holdings and commercial real estate, particularly multi-family construction.

Market News and Data brought to you by Benzinga APIs
Posted In: EconomicsFederal ReserveMarketscontributorsExpert IdeasInflationS&P 500TreasuryUnemployment
Benzinga simplifies the market for smarter investing

Trade confidently with insights and alerts from analyst ratings, free reports and breaking news that affects the stocks you care about.

Join Now: Free!

Loading...