
Zinger Key Points
- American Express reaches record high at $219, driven by strong bullish momentum.
- Surge since late October propels stock up by 55%, marking most robust four-month growth since March 2021.
- Don’t miss this list of 3 high-yield stocks—including one delivering over 10%—built for income in today’s chaotic market.
Shares of American Express Company AXP rose to a record high of $219 during the intraday session on Wednesday, buoyed by a strong bullish momentum.
The credit card issuer is currently experiencing a streak of six consecutive weeks in the green, with 16 positive weeks out of the last 18.
The surge, initiated in late October, has now propelled the stock upwards by 55%, representing its most robust four-month growth since March 2021 and the second-strongest since November 2009.
Recent News Mixed, AXP Moved Higher On Stronger 2024 Guidance
Despite a lack of significant new catalysts in recent news, stock prices have still been on the rise, primarily fueled by the optimistic outlook presented in the latest earnings reports.
- CFO Christophe Le Caillec mentioned at the UBS Financial Services Forum this week that tenured small-business customers have been spending less, which is dampening the company’s growth rates.
- Raymond Joabar, group president of American Express’ Global Merchant & Network Services, sold 8,625 shares in American Express for $1,837,470 according to an SEC filing.
- Laureen Seeger, chief legal officer, sold 84,420 shares in American Express for $17,979,772 on Feb. 12, 2024.
- Earlier this month, DBS Bank initiated American Express at Hold rating, with $215 price target. Morgan Stanley downgraded American Express From Overweight to Equalweight, lifting the price target from $212 to $222.
- In late January, the company reported results for the fourth quarter of 2023, falling slightly below consensus estimates, but delivering better-than-expected full-year guidance.
- American Express expects full-year 2024 earnings of $12.65 to $13.15 per share, with revenue growth of 9% to 11%.
Upside/Downside Potential
Based on Wall Street’s price target forecasts and the company’s current price-to-earnings (P/E) ratios, valuations closely align with current market prices, indicating limited potential for both upside and downside movements.
Following the fourth-quarter earnings release and adjustments in analysts’ recommendations, the median analyst price target sits at $218, precisely matching current market prices.
The forward P/E ratio stands at 17x, consistent with both the three-year and five-year averages.
Read also: Best Credit Card Offers Right Now
Technical Outlook
Given the limited insights from recent news and fundamentals, technical analysis might offer more value in this situation.
- Both the daily and weekly relative strength index (RSI) indicators suggest overbought conditions.
- The 14-day RSI currently stands at 77.46, remaining in overbought territory since Friday, Jan. 26, coinciding with the company’s earnings report.
- The 14-week RSI also entered overbought territory in late January, reaching 76.66, the highest weekly RSI level since January 2018.
- The 50-day moving average stands at $196, or 10% below current prices.
- The 200-day moving average lies at $169, or 22% below current prices.

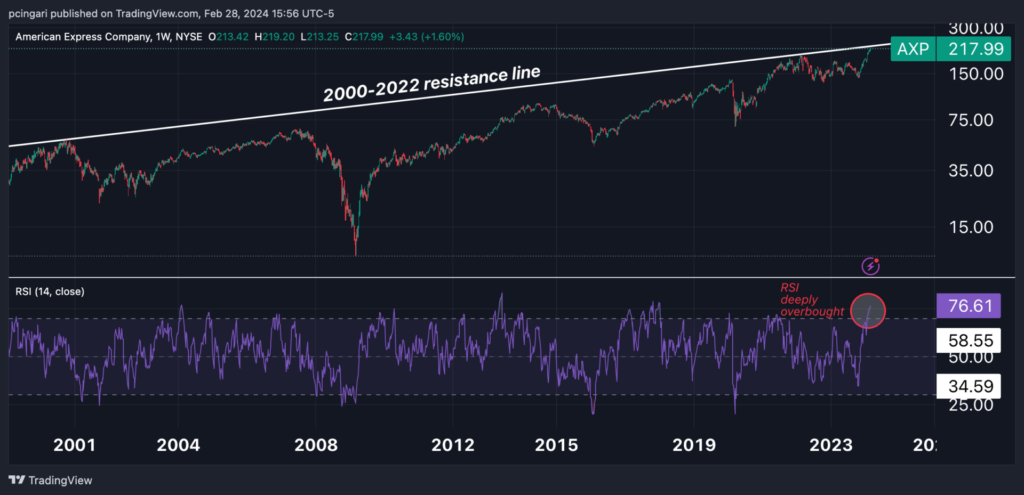
Examining the long-term weekly chart reveals that American Express shares are nearing a significant dynamic resistance line, connecting highs from October 2000 to February 2022.
This major resistance line is about 4 percent away from current levels, around $228 to $229 per share.
As a result, we may anticipate further upward momentum for American Express in the upcoming sessions, potentially leading to a critical resistance test for investors.
A successful break above this resistance level could propel the stock into uncharted territory, likely prompting profit-taking behaviors among bullish investors amid extreme overbought conditions.
Photo: Shutterstock
Edge Rankings
Price Trend
© 2025 Benzinga.com. Benzinga does not provide investment advice. All rights reserved.
date | ticker | name | Price Target | Upside/Downside | Recommendation | Firm |
|---|
Trade confidently with insights and alerts from analyst ratings, free reports and breaking news that affects the stocks you care about.

