

During the last three months, 4 analysts shared their evaluations of Boston Props BXP, revealing diverse outlooks from bullish to bearish.
The following table summarizes their recent ratings, shedding light on the changing sentiments within the past 30 days and comparing them to the preceding months.
| Bullish | Somewhat Bullish | Indifferent | Somewhat Bearish | Bearish | |
|---|---|---|---|---|---|
| Total Ratings | 1 | 0 | 3 | 0 | 0 |
| Last 30D | 0 | 0 | 1 | 0 | 0 |
| 1M Ago | 1 | 0 | 1 | 0 | 0 |
| 2M Ago | 0 | 0 | 0 | 0 | 0 |
| 3M Ago | 0 | 0 | 1 | 0 | 0 |
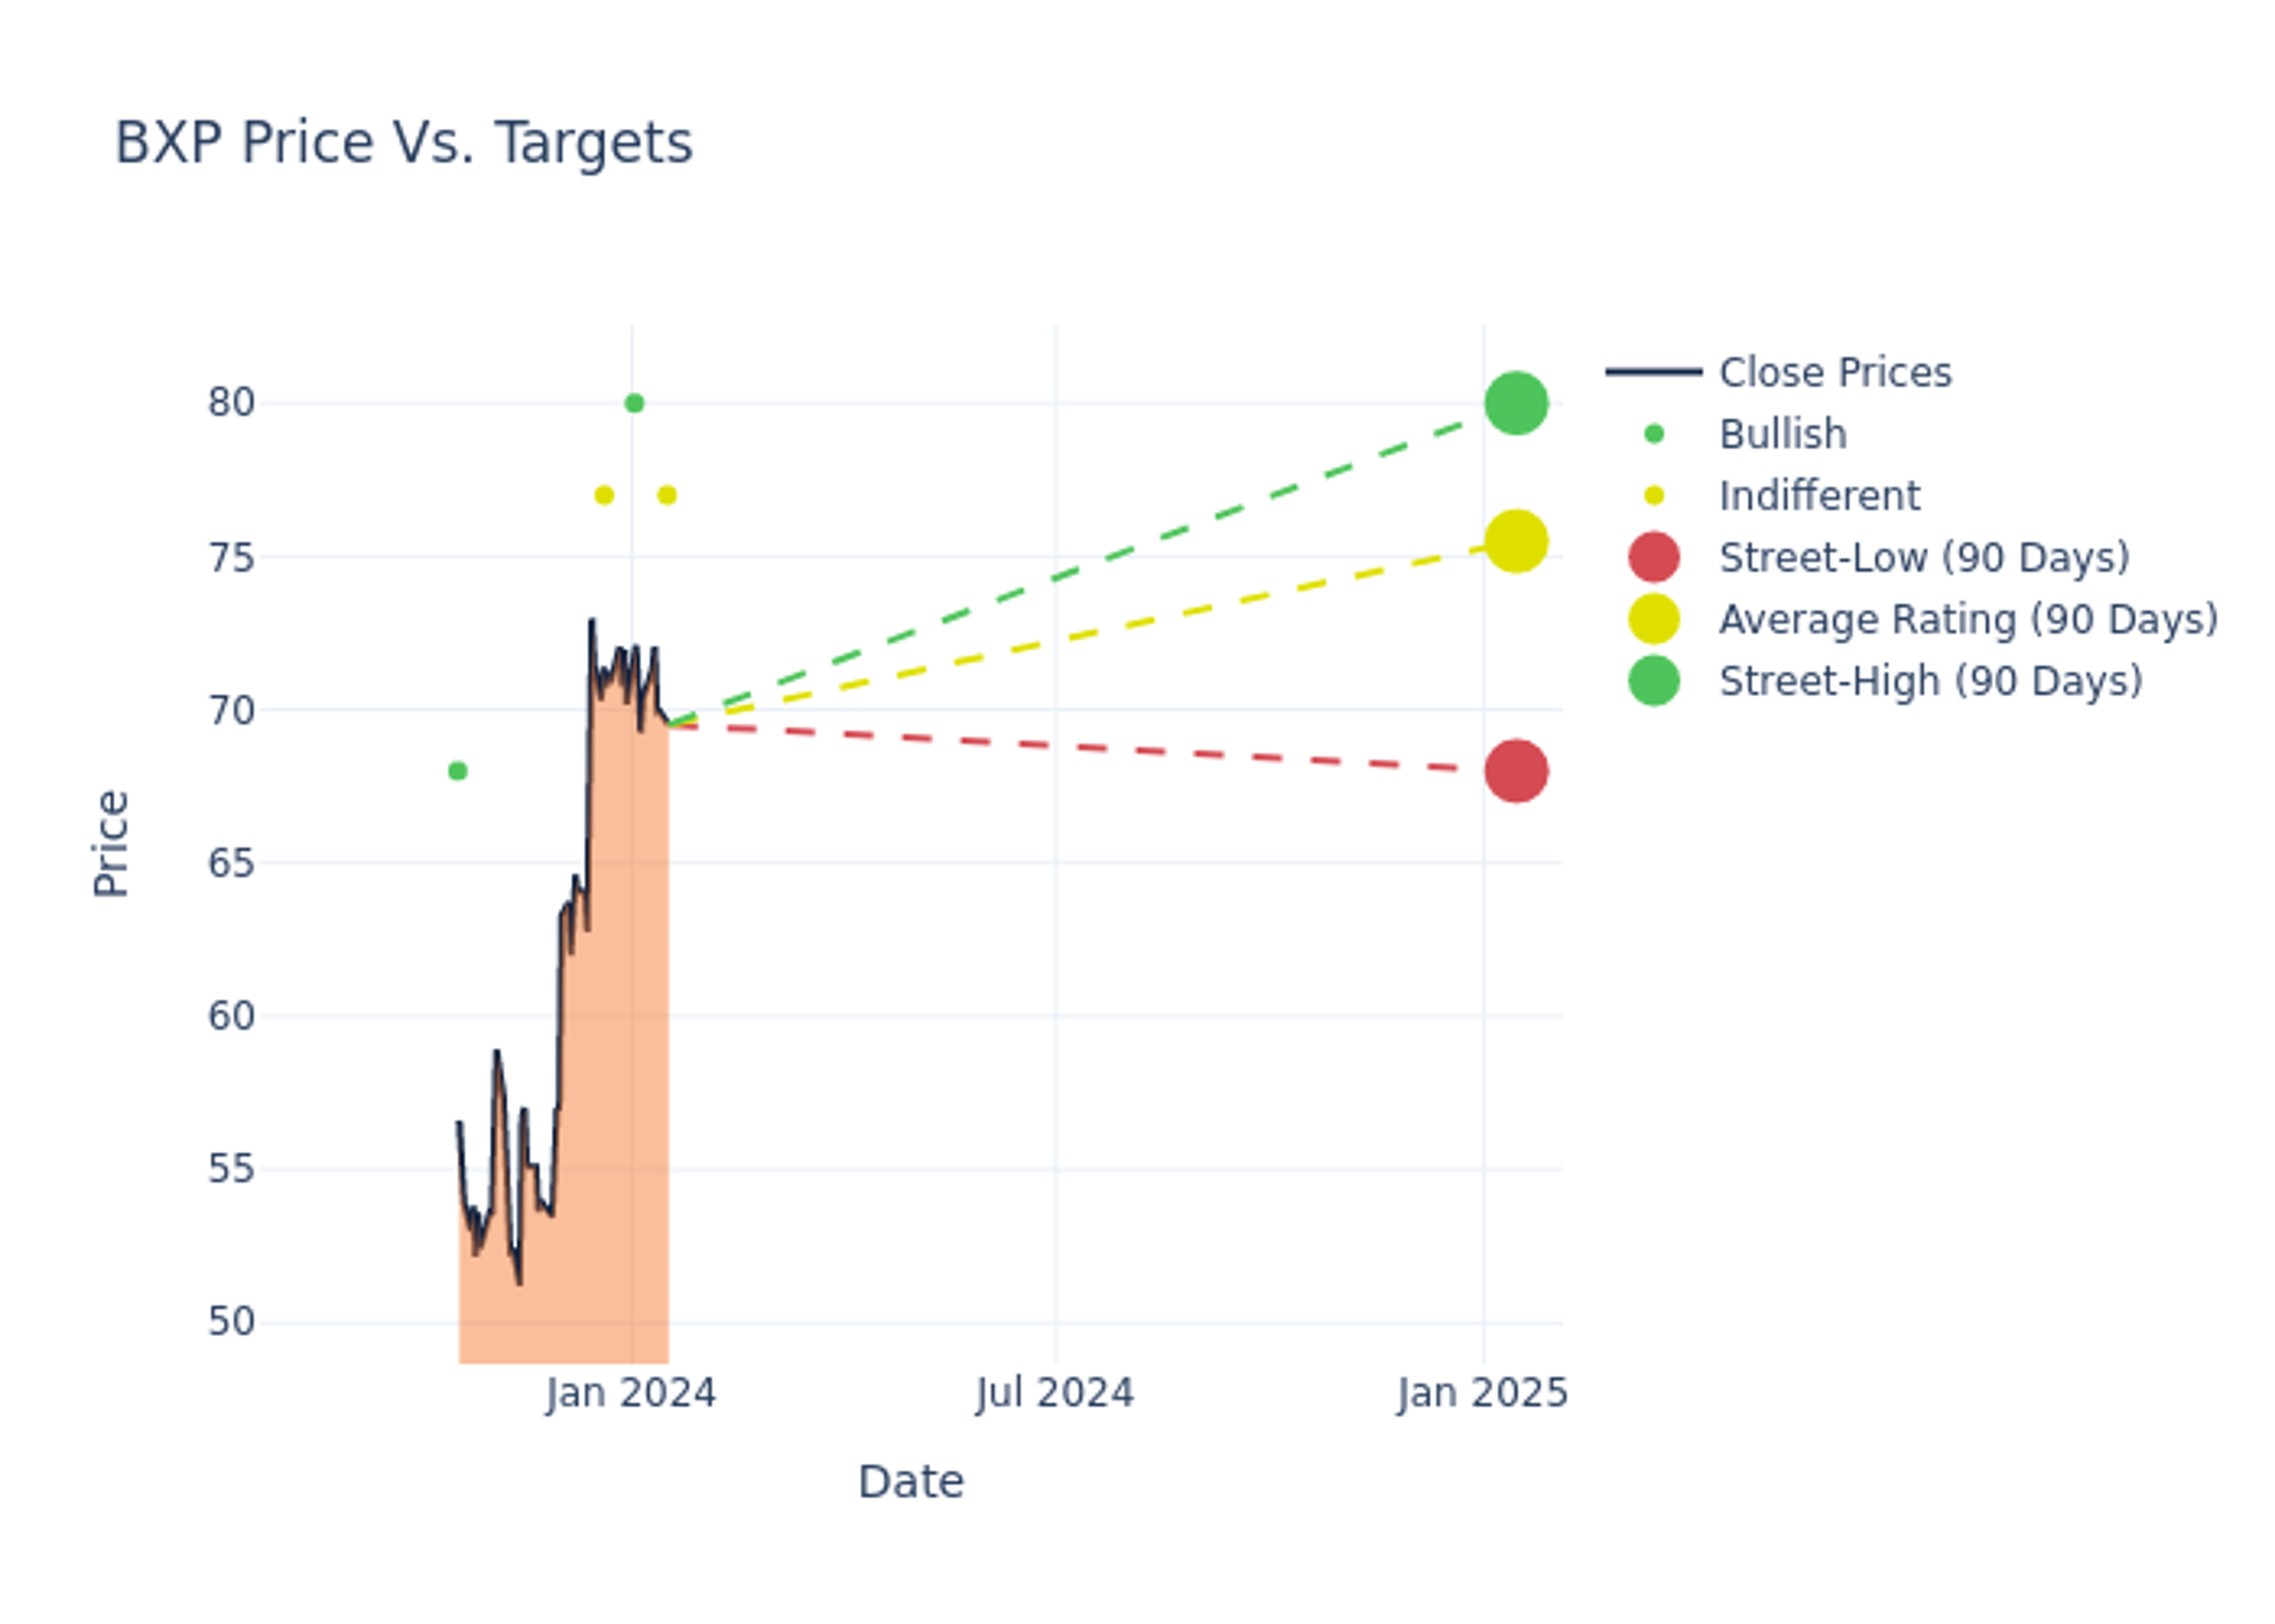
The 12-month price targets assessed by analysts reveal further insights, featuring an average target of $73.5, a high estimate of $80.00, and a low estimate of $60.00. Witnessing a positive shift, the current average has risen by 12.21% from the previous average price target of $65.50.

Exploring Analyst Ratings: An In-Depth Overview
The standing of Boston Props among financial experts becomes clear with a thorough analysis of recent analyst actions. The summary below outlines key analysts, their recent evaluations, and adjustments to ratings and price targets.
| Analyst | Analyst Firm | Action Taken | Rating | Current Price Target | Prior Price Target |
|---|---|---|---|---|---|
| Barry Jonas | Truist Securities | Lowers | Hold | $77.00 | $79.00 |
| Peter Abramowitz | Jefferies | Raises | Buy | $80.00 | $57.00 |
| Alexander Goldfarb | Piper Sandler | Raises | Neutral | $77.00 | $60.00 |
| Alexander Goldfarb | Piper Sandler | Lowers | Neutral | $60.00 | $66.00 |
Key Insights:
- Action Taken: Responding to changing market dynamics and company performance, analysts update their recommendations. Whether they 'Maintain', 'Raise', or 'Lower' their stance, it signifies their response to recent developments related to Boston Props. This offers insight into analysts' perspectives on the current state of the company.
- Rating: Offering insights into predictions, analysts assign qualitative values, from 'Outperform' to 'Underperform'. These ratings convey expectations for the relative performance of Boston Props compared to the broader market.
- Price Targets: Analysts provide insights into price targets, offering estimates for the future value of Boston Props's stock. This comparison reveals trends in analysts' expectations over time.
Assessing these analyst evaluations alongside crucial financial indicators can provide a comprehensive overview of Boston Props's market position. Stay informed and make well-judged decisions with the assistance of our Ratings Table.
Stay up to date on Boston Props analyst ratings.
Get to Know Boston Props Better
Boston Properties owns over 190 properties consisting of approximately 54 million rentable square feet of space. The portfolio is dominated by office buildings and is spread across major cities such as New York, Boston, San Francisco, Los Angeles, Seattle, and the Washington, D.C., region. The real estate investment trust also owns limited retail, hotel, and residential properties.
Understanding the Numbers: Boston Props's Finances
Market Capitalization Analysis: The company's market capitalization surpasses industry averages, showcasing a dominant size relative to peers and suggesting a strong market position.
Positive Revenue Trend: Examining Boston Props's financials over 3 months reveals a positive narrative. The company achieved a noteworthy revenue growth rate of 4.27% as of 30 September, 2023, showcasing a substantial increase in top-line earnings. In comparison to its industry peers, the company stands out with a growth rate higher than the average among peers in the Real Estate sector.
Net Margin: Boston Props's net margin is impressive, surpassing industry averages. With a net margin of -13.57%, the company demonstrates strong profitability and effective cost management.
Return on Equity (ROE): Boston Props's ROE is below industry averages, indicating potential challenges in efficiently utilizing equity capital. With an ROE of -1.89%, the company may face hurdles in achieving optimal financial returns.
Return on Assets (ROA): Boston Props's ROA stands out, surpassing industry averages. With an impressive ROA of -0.45%, the company demonstrates effective utilization of assets and strong financial performance.
Debt Management: Boston Props's debt-to-equity ratio surpasses industry norms, standing at 2.69. This suggests the company carries a substantial amount of debt, posing potential financial challenges.
Analyst Ratings: What Are They?
Experts in banking and financial systems, analysts specialize in reporting for specific stocks or defined sectors. Their comprehensive research involves attending company conference calls and meetings, analyzing financial statements, and engaging with insiders to generate what are known as analyst ratings for stocks. Typically, analysts assess and rate each stock once per quarter.
Analysts may supplement their ratings with predictions for metrics like growth estimates, earnings, and revenue, offering investors a more comprehensive outlook. However, investors should be mindful that analysts, like any human, can have subjective perspectives influencing their forecasts.
This article was generated by Benzinga's automated content engine and reviewed by an editor.
Edge Rankings
Price Trend
© 2025 Benzinga.com. Benzinga does not provide investment advice. All rights reserved.