

- Tesla's stock faces pressure after Q1 delivery dip, down 33% YTD; technical indicators signal bearish trend.
- CEO Elon Musk's push for Full Self-Driving fails to offset challenges; investors navigate amidst oversold conditions.
- The market is reacting to Powell’s speech. Learn how to time your next move. Details here →
Tesla, Inc. TSLA encountered headwinds in its first-quarter deliveries, reporting a decline to 386,810 vehicles from 422,875 a year earlier. Production figures followed suit, dropping to 433,371 units from 440,808 in the same period. The market responded, with Tesla’s stock dropping as news of the delivery numbers circulated.
Tesla March delivery & production numbers update: Tesla Stock Dives As Q1 Deliveries Disappoint — But EV Giant Reclaims Top Spot From Chinese Rival
The company attributed the decline in volumes to several factors, including early production challenges with the updated Model 3 at its Fremont factory and disruptions from the Red Sea conflict and an arson attack at Gigafactory Berlin. Additionally, Tesla’s margins faced pressure from a pricing war with competitors, exacerbating the impact of waning EV industry demand.
Tesla Stock Performance Reflective Of Ongoing Challenges
CEO Elon Musk‘s directive to install and activate Full Self-Driving software on all new vehicles aims to stimulate subscription revenues and showcase technological advancements. Despite these efforts, Tesla’s stock performance reflects ongoing challenges, down 14.52% over the past year and 33% year-to-date.

Bearish Technical Signals For Tesla Stock
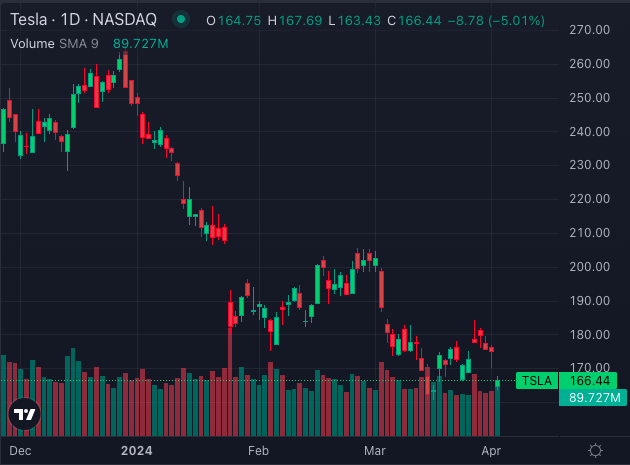
Technical analysis paints a bearish picture, with Tesla’s share price below its key moving averages.
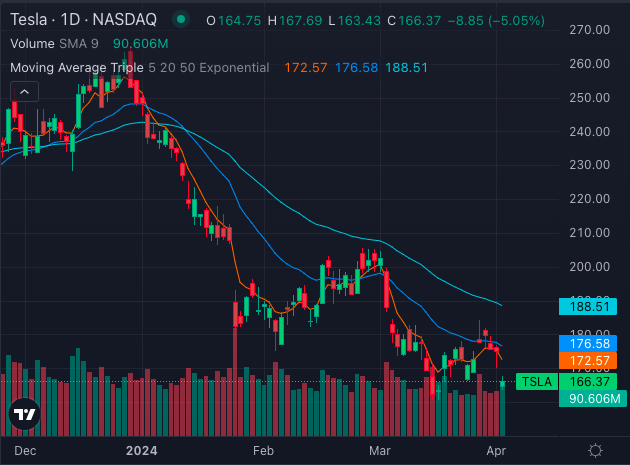
The chart above shows Tesla’s stock is currently trading below its 5, 20, and 50-day exponential moving averages. This indicates short-term bearish sentiments currently reigning over the stock.
Despite experiencing buying pressure, the stock faces significant bearish signals based on various moving averages and indicators.
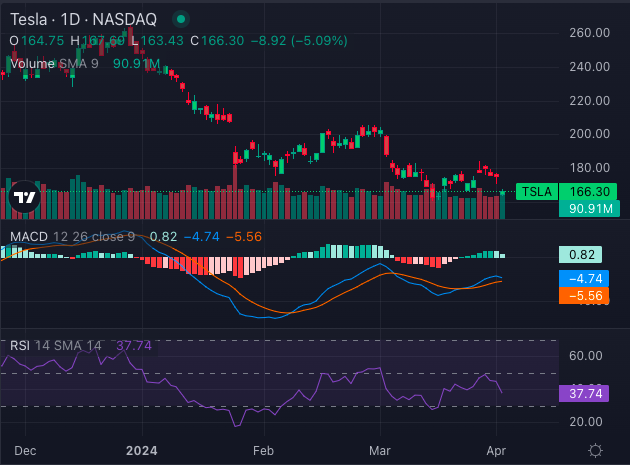
The Moving Average Convergence Divergence (MACD) indicator stands at -4.74, indicating a bearish signal, although the Relative Strength Index (RSI) suggests oversold conditions at 37.74.
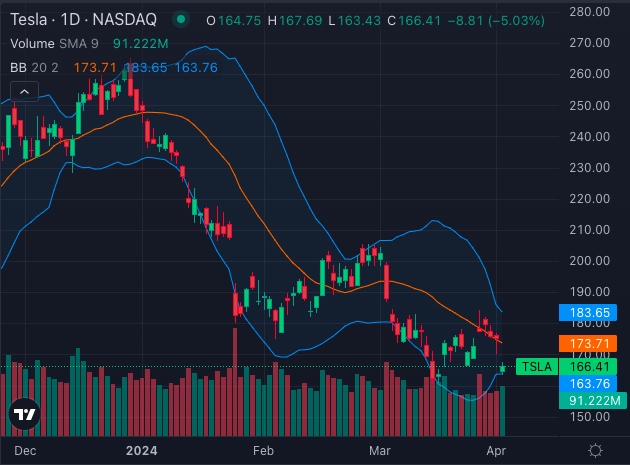
Additionally, the Bollinger Bands point to a bearish outlook, further reinforcing the challenging terrain for Tesla’s stock performance.
Overall, investors face a complex landscape, balancing Tesla’s strategic initiatives with technical signals. While the company seeks to address production challenges and stimulate demand, the stock’s performance reflects prevailing market sentiment.
Monitoring key indicators will be crucial for investors navigating Tesla’s stock amid evolving dynamics in the EV industry and broader market trends.
TSLA Price Check: Shares of Tesla were down 5.3% to $165.79 at the time of publication Tuesday.
Read Next: Tesla Stock Is Tumbling Tuesday: What’s Going On?
Image generated using artificial intelligence via Midjourney.
Edge Rankings
Price Trend
© 2025 Benzinga.com. Benzinga does not provide investment advice. All rights reserved.